$REALIS 2H 2025 road to $200m FDV (100x)Realis Worlds ($REALIS) is the SAND or MANA of this cycle (but probably much bigger). First major milestone in price action and value is $200m FDV by end of 2025. From there, probably much higher, but I'll set modest expectations for now and re-evaluate in December.
Crypto market
SIXTHB Huge falling wedgeFalse break last year but here we go again. 0.5-0.6 Very strong support. Price spike but has been taking down immediately mean something.
HOLD and SL if price below supply zone.

W/USDTKey Level Zone: 0.06700 - 0.07000
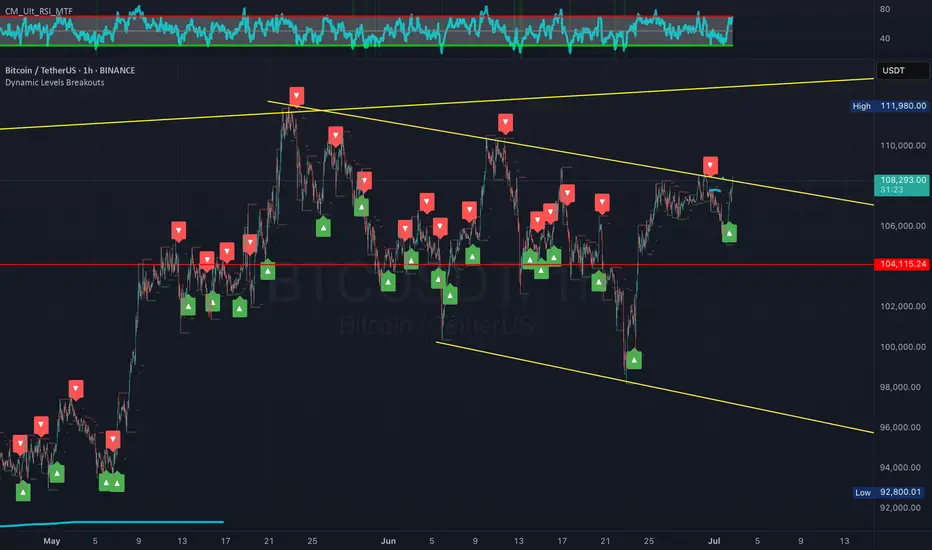
LMT v2.0 detected.
The setup looks promising—price previously trended upward with rising volume and momentum, then retested this zone cleanly. This presents an excellent reward-to-risk opportunity if momentum continues to align.
Introducing LMT (Levels & Momentum Trading)
- Over the past 3 years, I’ve refined my approach to focus more sharply on the single most important element in any trade: the KEY LEVEL.
- While HMT (High Momentum Trading) served me well—combining trend, momentum, volume, and structure across multiple timeframes—I realized that consistently identifying and respecting these critical price zones is what truly separates good trades from great ones.
- That insight led to the evolution of HMT into LMT – Levels & Momentum Trading.
Why the Change? (From HMT to LMT)
Switching from High Momentum Trading (HMT) to Levels & Momentum Trading (LMT) improves precision, risk control, and confidence by:
- Clearer Entries & Stops: Defined key levels make it easier to plan entries, stop-losses, and position sizing—no more guesswork.
- Better Signal Quality: Momentum is now always checked against a support or resistance zone—if it aligns, it's a stronger setup.
- Improved Reward-to-Risk: All trades are anchored to key levels, making it easier to calculate and manage risk effectively.
- Stronger Confidence: With clear invalidation points beyond key levels, it's easier to trust the plan and stay disciplined—even in tough markets.
Whenever I share a signal, it’s because:
- A high‐probability key level has been identified on a higher timeframe.
- Lower‐timeframe momentum, market structure and volume suggest continuation or reversal is imminent.
- The reward‐to‐risk (based on that key level) meets my criteria for a disciplined entry.
***Please note that conducting a comprehensive analysis on a single timeframe chart can be quite challenging and sometimes confusing. I appreciate your understanding of the effort involved.
Important Note: The Role of Key Levels
- Holding a key level zone: If price respects the key level zone, momentum often carries the trend in the expected direction. That’s when we look to enter, with stop-loss placed just beyond the zone with some buffer.
- Breaking a key level zone: A definitive break signals a potential stop‐out for trend traders. For reversal traders, it’s a cue to consider switching direction—price often retests broken zones as new support or resistance.
My Trading Rules (Unchanged)
Risk Management
- Maximum risk per trade: 2.5%
- Leverage: 5x
Exit Strategy / Profit Taking
- Sell at least 70% on the 3rd wave up (LTF Wave 5).
- Typically sell 50% during a high‐volume spike.
- Move stop‐loss to breakeven once the trade achieves a 1.5:1 R:R.
- Exit at breakeven if momentum fades or divergence appears.
The market is highly dynamic and constantly changing. LMT signals and target profit (TP) levels are based on the current price and movement, but market conditions can shift instantly, so it is crucial to remain adaptable and follow the market's movement.
If you find this signal/analysis meaningful, kindly like and share it.
Thank you for your support~
Sharing this with love!
From HMT to LMT: A Brief Version History
HM Signal :
Date: 17/08/2023
- Early concept identifying high momentum pullbacks within strong uptrends
- Triggered after a prior wave up with rising volume and momentum
- Focused on healthy retracements into support for optimal reward-to-risk setups
HMT v1.0:
Date: 18/10/2024
- Initial release of the High Momentum Trading framework
- Combined multi-timeframe trend, volume, and momentum analysis.
- Focused on identifying strong trending moves high momentum
HMT v2.0:
Date: 17/12/2024
- Major update to the Momentum indicator
- Reduced false signals from inaccurate momentum detection
- New screener with improved accuracy and fewer signals
HMT v3.0:
Date: 23/12/2024
- Added liquidity factor to enhance trend continuation
- Improved potential for momentum-based plays
- Increased winning probability by reducing entries during peaks
HMT v3.1:
Date: 31/12/2024
- Enhanced entry confirmation for improved reward-to-risk ratios
HMT v4.0:
Date: 05/01/2025
- Incorporated buying and selling pressure in lower timeframes to enhance the probability of trending moves while optimizing entry timing and scaling
HMT v4.1:
Date: 06/01/2025
- Enhanced take-profit (TP) target by incorporating market structure analysis
HMT v5 :
Date: 23/01/2025
- Refined wave analysis for trending conditions
- Incorporated lower timeframe (LTF) momentum to strengthen trend reliability
- Re-aligned and re-balanced entry conditions for improved accuracy
HMT v6 :
Date : 15/02/2025
- Integrated strong accumulation activity into in-depth wave analysis
HMT v7 :
Date : 20/03/2025
- Refined wave analysis along with accumulation and market sentiment
HMT v8 :
Date : 16/04/2025
- Fully restructured strategy logic
HMT v8.1 :
Date : 18/04/2025
- Refined Take Profit (TP) logic to be more conservative for improved win consistency
LMT v1.0 :
Date : 06/06/2025
- Rebranded to emphasize key levels + momentum as the core framework
LMT v2.0
Date: 11/06/2025

ETH H&S Pattern ?ETH H&S Pattern ?____ Who knows_______
Will the end of this year be crypto bullish year ? DCA brother.

Sei long to $0.2845Sei long to $0.2845. Just went long.
Currently attempting to flip bullish on 1hr tf and will also likely push to flip bullish on 4hr tf as well based on my analysis.
Roughly 3RR setup

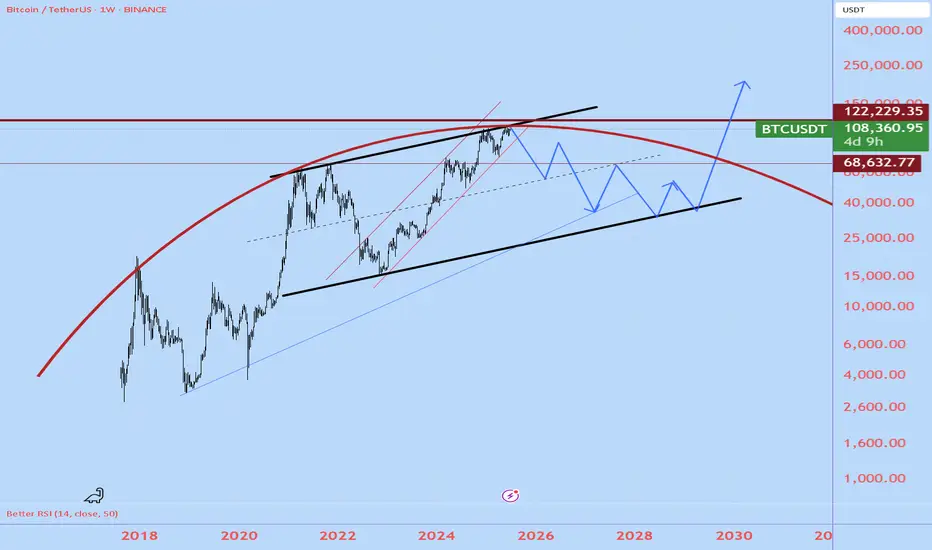
BTCusdtWill BTC go for another 4-year cycle? Everything is possible..
I think the next weeks will be conclusive to see if we can stay in the red channel or will go down.
I believe BTC will reach about 35K, but in a zigzaggy way, giving push to altcoins seasonally.
It is just speculation
BTC SCALP TradeWait for the entry then take with small amount no high risk must use SL. If BTC don't retrace towards 106.5k in coming hours then don't take risk on shorting it will breakout towards 113k


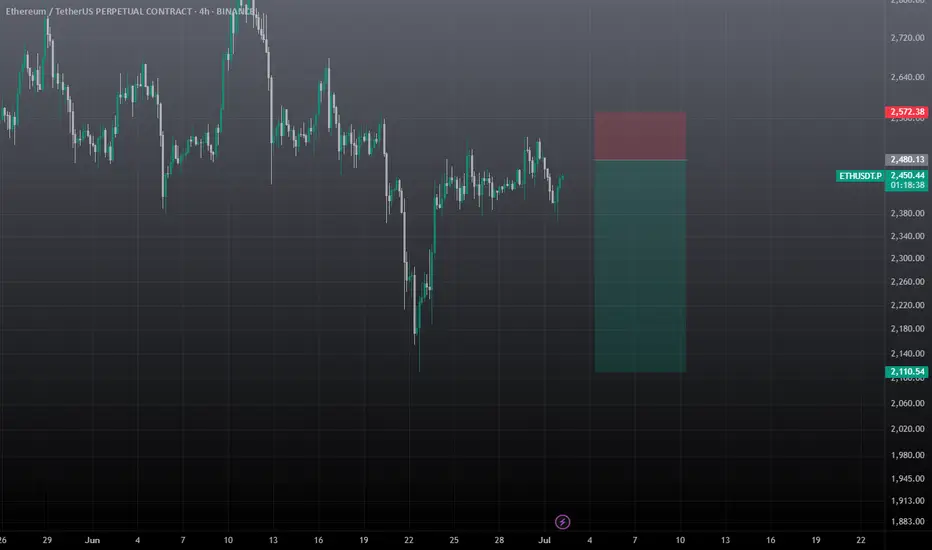
ETHUSDT SWING TRADE SetupWait for the entry and must use sl, if sl hits then wait for candle closure, candle managed to close above the SL, still there is lot of supply zone for eth till 2.7k, So fakeout also possible. I will comment the update, SO closely follow me.
SUI: Closing in on the Target Zone?SUI should continue closing in on our blue Target Zone between $2.27 and $1.72. We expect blue wave (ii) to complete there, ideally above support at $2.02, before the next move higher kicks off in wave (iii). However, because the June 22 low came within just $0.03 of our zone, we must consider the possibility that blue wave alt.(ii) has already concluded. In that case, a direct breakout above resistance at $3.60 could follow (33% probability).
📈 Over 190 precise analyses, clear entry points, and defined Target Zones - that's what we do.


HUGE SHORT ON BTC - SIMPLE AS THATas per title. Don't need to mention, it very easy to know that it will drop.
GOGLZ - Sonic main meme coin, longGOGLZ - a risky memecoin for degens or a big opportunity for smart investors?
Every chain should have one king of memecoins. I think GOGLZ is Sonics chosen one.
Airdrop will soon land on Sonic users - the Sonic momentum will follow?
GOGLZ thin 4 million dollar market cap could be a lot more soon.
When GOGLZ pops its gonna run fast. I think it could be the right time to take a small before the opportunity is gone!
No financial advice - risky meme coin...and I'm a Sonic bull!
First target is a 70% move

This looks eerily similar to last cycle top. just sayinLast cycle top and this cycle look identical from this angle. Its going to be hard to push through this top and make a new ATH in my opinion. the more the cycle looks the same, the more fear, and more dump. Self fullfilling prophecy here.

This is a better way to analyze the Bitcoin chart.rising support + target IF breakdown from rising support line A
This is a better way to analyze the Bitcoin chart.


Litecoin ProphecyOne of the oldest coins, with zero down time:
Litecoin, one of the most undervalued altcoins out there for the following reasons:
- zero down time
- silver to gold narrative
- most used for payments
- ETF incoming
According to TA, we should see $600-$700 shortly, then retrace back to previous ATHS ($400). From there, infinite ($1k+).
Be in or miss out.

BITCOIN - NEW BREAKOUT !Hello Traders !
The Bitcoin failed to create a new lower low!
The price broke the lower high (Change of character).
So, I expect a bullish move🚀
______________
TARGET: 108270🎯

Bitcoin Breakdown? Support Zone & CME Gap in FocusBitcoin ( BINANCE:BTCUSDT ), as anticipated in my previous analysis , attacked the Resistance lines and then resumed its decline. In previous analysis, both Long and Short positions could have been profitable .
Bitcoin is approaching a Support zone($106,800-$105,820) and the CME gap($106,645-$106,295) .
From an Elliott Wave theory perspective , it appears that Bitcoin has finally completed a five-wave impulsive move with the help of an Expanding Ending Diagonal .
I expect Bitcoin to attack the Support zone($106,800-$105,820) after breaking the lower line of the Expanding Ending Diagonal .
Note: To break through the Support zone($106,800-$105,820), Bitcoin may potentially use either a Head and Shoulders pattern or a Bearish Quasimodo formation.
Note: If Bitcoin breaks the Resistance lines, we can expect more pumps.
Cumulative Long Liquidation Leverage: $106,249-$105,094
Cumulative Short Liquidation Leverage: $109,483-$108,790
Please respect each other's ideas and express them politely if you agree or disagree.
Bitcoin Analyze (BTCUSDT), 1-hour time frame.
Be sure to follow the updated ideas.
Do not forget to put a Stop loss for your positions (For every position you want to open).
Please follow your strategy and updates; this is just my Idea, and I will gladly see your ideas in this post.
Please do not forget the ✅' like '✅ button 🙏😊 & Share it with your friends; thanks, and Trade safe.

$PLUME - Scalp Long Trade$PLUME | 6h
You can risk at current price or wait for a rejection at vwap, and enter on pullback
Might tag .12–.125 first, possible pullback into .105-.094
Stoploss just below .082
TPs:
.12 to .125
.132 to .138
.154 to .163

BTC - Perfect Trendline TestOur previous post can be found here: www.tradingview.com
From what we were pointing out yesterday how BTC was testing our trendline of support - today we have seen the fulfillment of this move as we saw two more touchpoints of support on the trendline and are now making our way back towards the red trendline as stated in our last post.

BTI risk is neutral The BTC risk is still at the mid-7s. With a max of 13 on the risk, that means we are still likely far from the cycle top. There are a few indicators that are nearing top signals (NUPL, RP extension, CVDD extension, PDM), but most indicators are far from their top signals. We had a much needed cool down period for BTC to reset some of the overheated indicators.

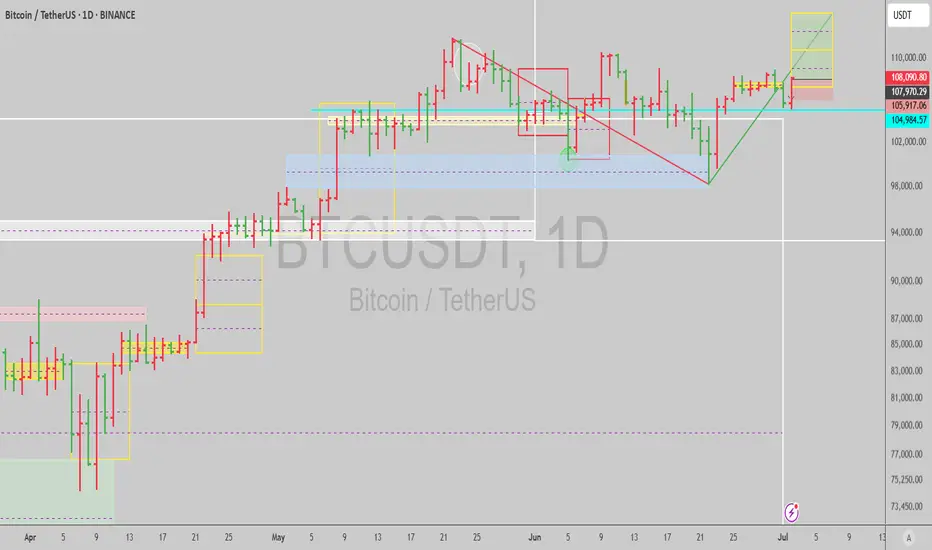
$BTCUSDT: Bullish trend resumingBitcoin turning bullish in the daily confirming the correction is likely over and longer term timeframe trends will resume next if it gets follow through.
See monthly, it fired a trend on close during June, bullish till EOY easily as per this forecast:
Best of luck!
Cheers,
Ivan Labrie.