Head and Shoulders Head and shoulders at the bottom of a downtrend.
Closed below neckline and rejected the neckline on the uptrend.
Heigh of head to neckline (price difference) x 2 = price target.
needs to close above the right shoulder to invalidate.
Always set a SL
Crypto market

#5572025 | BTCUSD Supply Zone 1:10BTCUSD Supply Zone Appears in D1 Time Frame Looking Price Action for Long Term Sell
Risk and Reward Ratio is 1:10
After 50 pips Profit Set SL Entry Level
"DISCLAIMER" Trading & investing business is "Very Profitable" as well as risky, so any trading or investment decision should be made after Consultation with Certified & Regulated Investment Advisors, by Carefully Considering your Financial Situation.

Pudgy Penguins PENGU price analysis🪙 It seems that #PENGU is being sold off, and the price of OKX:PENGUUSDT has been stuck in consolidation at conditional highs for several days now, where positions are likely being redistributed.
Nevertheless, if at the beginning of the year, after listing, the price of the #PudgyPenguins token was released into not even “free float,” but simply into “free fall,” now, for several months, it has been “held” in a controlled manner.
🐻 If our assumption is correct, then the price of #PENGUUSDT should adjust to $0.01 or, in the worst case, to $0.0065-0.0070
📈 And if we are wrong, then the price of #PENGU has every chance of breaking out through to $0.02 in the coming days. With a global target of $0.03
⁉️ What is your opinion
Is this a fundamental project that is doomed to grow, or just a manipulative memecoin toy?
_____________________
Did you like our analysis? Leave a comment, like, and follow to get more

SPX6900 — Dream Scenario1. Wait for price to sweep EQ lows (buy zone)
2. Enter long only after SFP / bullish confirmation
3. Target: 2.13+
4. Stop: below buy zone
If no sweep — no trade!

ETH | Long | 3 Hrs | Target: 2,540This technical analysis is for informational and educational purposes only. It does not constitute financial advice. Remember to always research and consult with a professional before making investment decisions. Good luck! 📈💼🚀

Pyth Big long to $0.1155Just recently opened a long trade on pyth. Aiming for $0.1116 to $0.1155
Beautiful setup.
Market is bullish and seems the correction have come to an end on the 1hr tf. Anticipating strong push soon.
Not much to be said here, the price action is clean and the idea is clear, trade with the trend.
Whales are also loading up.
DTT setup


TON/USDT : Are you Bullish or Bearish? Let's Talk!By analyzing the #Toncoin chart on the 3-day timeframe, we observe that the price is still within the demand zone between $2.40 and $3.00.
If the price manages to break above the $3.10 level and hold within the next 7 days, we can expect further growth from this cryptocurrency.
The expected returns are approximately 20% in the short term, 40% to 55% in the mid-term, and up to 110% in the long term.
Please support me with your likes and comments to motivate me to share more analysis with you and share your opinion about the possible trend of this chart with me !
Best Regards , Arman Shaban

ETHERIUM LONG FOR TARGET 3000ETH has fallen from its recent high of 2879 to present levels of 2184 it has formed an anti butterfly pattern this is a good demand zone we can expect an up move from here targets and stop loss mentioned on the chart

ETH/USDT : Gearing Up for a Major Breakout? (READ)By analyzing the Ethereum chart on the weekly timeframe, we can see that the price has started rising just as expected and is now approaching the first target. For now, ETH faces major resistance in the $2,600–$2,900 zone.
If price breaks above this key area, I expect a strong bullish move from Ethereum!
Based on the main analysis, the short-term targets are $2,700 and $2,890, while the mid-term targets are $3,100 and $4,100.
Please support me with your likes and comments to motivate me to share more analysis with you and share your opinion about the possible trend of this chart with me !
Best Regards , Arman Shaban

Lingrid | ETHUSDT Price Compression and Expansion PhasesBINANCE:ETHUSDT is struggling to hold gains after a rejection from the top of the range, with price retracing back toward the breakout point and key trendline support. The structure remains intact above 2,363, where bulls may attempt another rebound. A sustained move above the blue ascending trendline would open the way toward the 2,650 target, completing the projected rebound path.
📈 Key Levels
Buy zone: 2,363–2,400
Sell trigger: breakdown below 2,363
Target: 2,650
Buy trigger: breakout and retest of 2,475–2,500 with volume
💡 Risks
Failure to hold the trendline could push price toward 2,159
Weak follow-through may stall near 2,550
Bearish engulfing from current range top can trap early buyers
If this idea resonates with you or you have your own opinion, traders, hit the comments. I’m excited to read your thoughts!

AVA/USDT – Long-Term Bullish Reversal in PlayAVA has been trading within a well-defined downward channel for weeks, making consistent lower highs and lower lows. However, price has now broken above the upper boundary of the channel with strong volume and momentum, signaling a potential trend reversal.
Technical Analysis:
Channel Breakout:
Price has successfully closed above the descending trendline (channel top), confirming breakout and bullish intent.
RSI Surge:
RSI has shot past 80, a sign of strong bullish momentum. Short-term pullbacks may occur, but long-term sentiment is shifting.
Higher Lows Forming:
Structure is starting to shift from bearish to bullish, especially with current candle body closings above $0.03016.
Volume Spike:
Notable increase in buying volume, often seen before trend flips in micro caps or small altcoins.
Key Levels to Watch:
Support Zones:
$0.03016 – Key breakout level; should act as support now
$0.02440 – Historical accumulation zone
$0.02100 – Long-term base support
Resistance / Target Zones:
T1: $0.04026 – Local structure and previous consolidation
T2: $0.05550 – Psychological and technical resistance
T3: $0.07971 – Major reversal zone
T4: $0.10185 – Long-term target from macro high
Stoploss:
$0.02400 (close below re-enters channel and invalidates breakout)
Entry Idea:
Accumulation Zone: $0.029–$0.031
This is the ideal area for positioning with minimal risk and a good reward ratio.
Not Financial Advice | DYOR Always

ADA/USDT : Get Ready for another Bullrun (READ THE CAPTION)By analyzing the #Cardano chart on the 3-day timeframe, we can see that the price is currently trading around $0.59. After sweeping the liquidity below $0.51, our bullish outlook for the next upward wave has strengthened significantly.
I'm now expecting a strong move from ADA, with short-term targets at $0.61 and $0.76, and longer-term targets at $0.93, $1.05, and $1.33!
Please support me with your likes and comments to motivate me to share more analysis with you and share your opinion about the possible trend of this chart with me !
Best Regards , Arman Shaban

Bullish confirmation today on both the daily and 4hrly.Bullish confirmation today on both the daily and 4hrly.
4hrly Chart:
Caught the dip?

XRP Army - prepare for a 72% crash to 0.6 USD! (lifetime chance)The current price of XRP is 2.19 USD, and I predict a big crash in 2025/2026 to 0.6 USD. Yes, I know you may think that that's completely impossible, especially if you are high on your XRP holdings, but I can assure you that this is going to happen! What can you do?
If you are a hodler, then you need to prepare for your portfolio to drop by 72%. Can you really handle this situation? If not, you need to take some action.
If you are a trader and you still speculate on the price increase, you can consider exiting your position. If you bought before the huge pump, take your profit now.
If you are a trader and you bought after the pump, that means at the TOP, you basically FOMOed-IN. It's time to take a small loss or exit your position at break-even. If you found yourself in one of the situations above, you have some work to do. And you need to do the work as soon as possible, before XRP starts crashing, which can be any day now. Otherwise, I strongly recommend entering a short position on futures on a strong resistance if you want to make money on XRP.
Now, importantly, why do I think XRP will crash? Technically, XRP is in a big range and has been in a range since 2017. Nothing changed at all after the pump; the price is still inside this ascending triangle. After the huge pump, the price created a big FVG (Fair Value GAP), and historically this has been a big issue for XRP because we went down each time and wiped out the GAPs. Don't forget that XRP is something like a bitch coin, it's doing weird moves, and it's always ranging and taking liquidity from traders, like a casino. Smart traders can take advantage of it and trade it, but you need to have a strategy. Right now it's obvious that XRP is going to go down in the next months!
Write a comment with your altcoin + hit the like button, and I will make an analysis for you in response. Trading is not hard if you have a good coach! This is not a trade setup, as there is no stop-loss or profit target. I share my trades privately. Thank you, and I wish you successful trades!

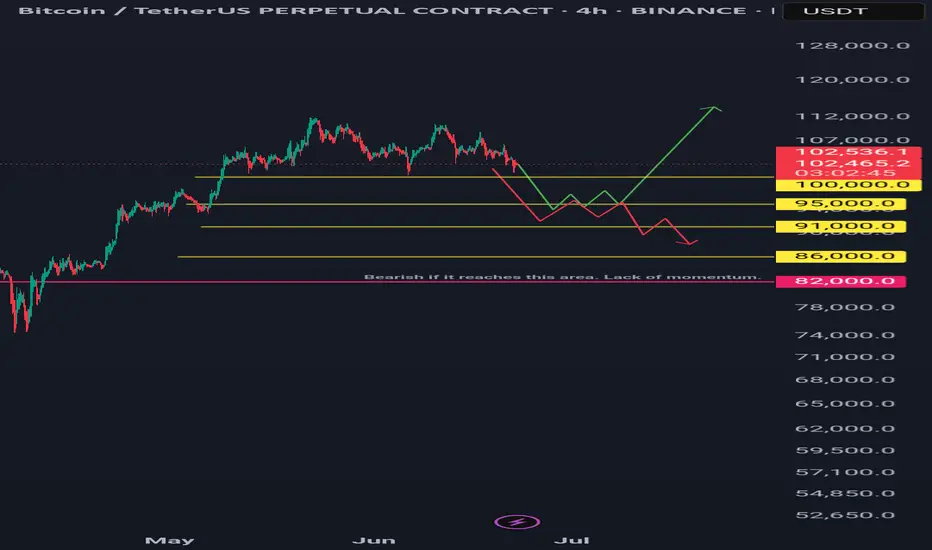
Btcusdt 4hr tf scenarios.Two scenarios: green and red lines.
Green Line: A bounce and sustained recovery above the 100-day and 200-day daily moving averages is bullish.
Red Line: A bounce followed by a lack of momentum and a break below a previous low is bearish.
Long Horizontal Red Line: If the price reaches this area, it could signal the start of a downtrend unless new bullish fundamentals emerge.
My Point of View (POV): I am bearish, primarily due to the ongoing war, similar to the conflict that began between two other countries a year ago.
However, it's important to note that every crisis and recession has historically presented a buying opportunity for institutions and 'whales.' Therefore, be prepared with funds for dollar-cost averaging (DCA), then simply hold and forget. It is recommended to conduct backtesting and research to identify optimal buying areas. DCA is key. Only invest money you can afford to lose.
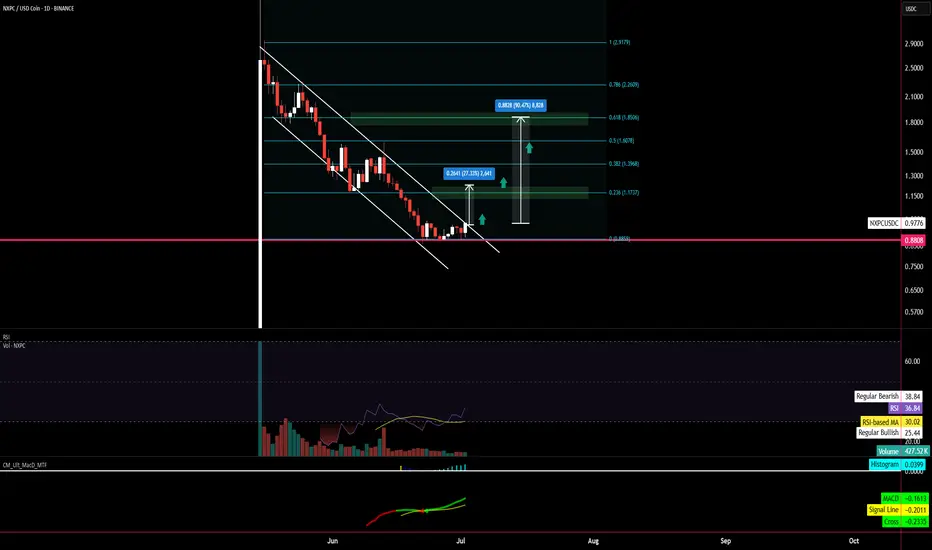
[NXPC] Between 30 to 100% gain to take?Hello all!
Looks like NXPC is ready to break the long-term downtrend since its listing on Binance. Selling volumes are decreasing and it seems like the 0.88-0.90 support is holding strong.
I expect a pump to 0.236 (minimum) fib retracement level, but could go even higher to the 0.618 level if attention drastically increases onto this project.
Let's see how it goes in the next couple of days!
Not a financidal advice, dyor! :)
Xrpusdt 4hr tf bearishA bearish head and shoulders pattern is forming.
If it closes below 2.0811 on the 4-hour timeframe, the pattern may be activated.
Targets are 1.95, 1.80, and 1.65.
Invalidation occurs if the high of the right shoulder (2.3355) is broken.

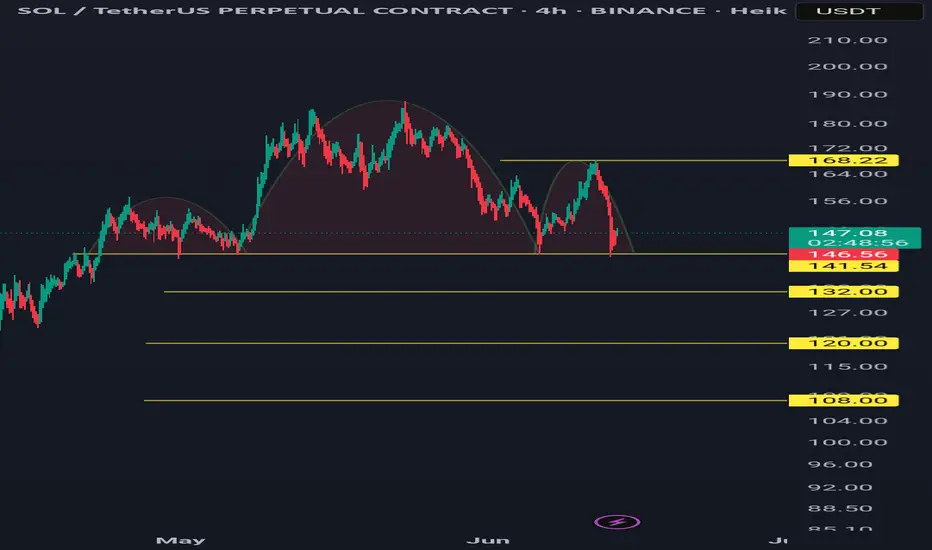
Solusdt 4hr tf bearishA bearish head and shoulders pattern is forming.
If it closes below 141.54 on the 4-hour timeframe, the pattern may be activated.
Targets are 132, 120, and 108.
Invalidation occurs if the high of the right shoulder (168.22) is broken.
BTC Just Breakout! Are we ready for new ATH? BTC just breakout from 4h trendline and anticipate for any retracement soon before sky rocket into new ATH, historically saying my target will be on $148k.
NFA!!
DYOR!!

XLMUSDT bearish 4hr time frameBTC is still in an uptrend but in a consolidation phase. However, many altcoins appear to be outliers and are significantly weaker when BTC is in a pullback phase. One of them is XLM/USDT, which is trading below the 100 and 200 MA on the daily timeframe.
A close below 0.25267 on the 4-hour timeframe may activate the pattern.
Targets are 0.215 and 0.195.
Invalidation: If it closes above 0.286.

BTC LONG TP:110,000 30-06-2025Still riding the bullish pattern 🚀
Looking for an entry between 106,200 – 106,700, targeting 109,500 – 110,500, with a clean 4 RR average.
🕓 Timeframe: 4H
⏳ Duration: 40–50 hours
Context: This is all about catching a manipulative wick — small entry now, stack more if price hits the suggested levels later.
If the move doesn’t happen within the estimated time, the trade is invalid.
We don’t use indicators, we’re not out here drawing lines or cute little shapes — I just give you a clean trade.

BTC short squeeze in the makingMany people believe that BTC is running "too hot," and we're seeing what appears to be a short squeeze. We all know what's next. No one in their right mind will buy at the top, esp. given it's volatility. Some economic events are right around the corner over the next 1-2 weeks which could impact BTC and S&P. Typically, market rallies are short lived, esp. when the fundamentals are out of whack. Unemployment is cooling (remember is a lagging indicator), high # of bankruptcies, housing unaffordability highest in decades, high interest rates, student loans will start making a dent soon...the list goes on. Don't let the Champagne effect fool you! Berkshire stocking up on cash for a reason.
Best of luck and always do your own DD! Staying positive, with a healthy dose of keeping things real.
