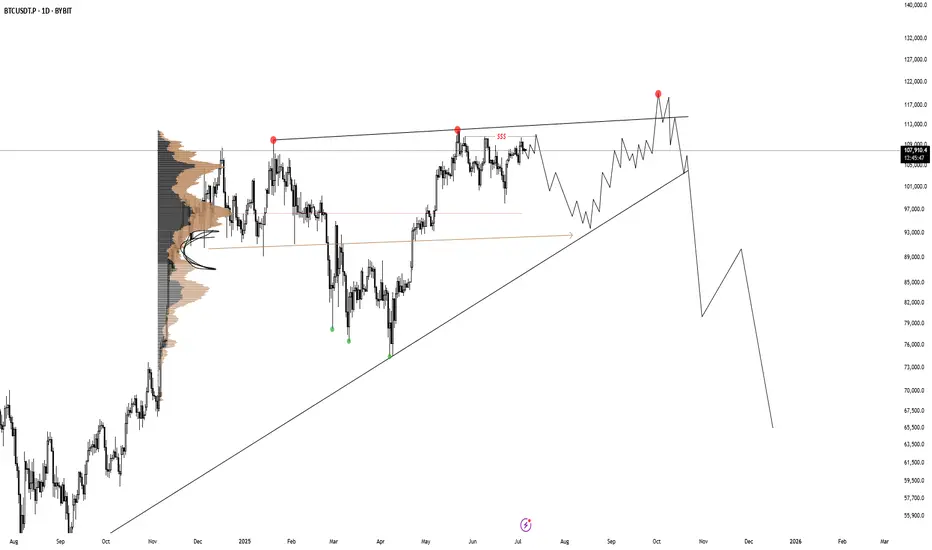
BTC HTF Distribution V2This is still the main scenario I'm looking for until it's invalidated. A build up like this, followed by a fake breakout out of this rising wedge as 3rd tap would be perfect.
Crypto market
XRP/USDT| Targeting $3.3 to $3.7📝 Description:
XRP has been consolidating inside a large symmetrical triangle on the daily chart since early 2025. Price is now approaching the apex, suggesting a potential breakout move is near.
🔹 Upper trendline resistance: ~$2.49
🔹 Lower trendline support: ~$1.90
🔹 Breakout level to watch: $2.45–$2.50
✅ If a breakout is confirmed with strong volume, potential upside targets include:
🎯 $3.30 – mid-range target
🎯 $3.70 – full breakout objective
A spike in volume will be key to confirming the move. Until the breakout is validated, this setup remains neutral.
📌 This is not financial advice – please do your own research before making any trading decisions.
💬 What’s your target for XRP if this breaks out?

XRP wants to ripCould happen faster than anticipated, and the pullbacks could be a little deeper.
Those are the levels I will be watching regardless of pace.

Btc / UsdtBITSTAMP:BTCUSD
1. **Current Price Zone (\~108,000):**
* Price is consolidating just under a supply zone (red rectangle), showing potential rejection from the upside.
* The price briefly pushed above the rising trendline but failed to hold it.
2. **Bearish Structure Forming:**
* Price action suggests a **lower high** and potential **head-and-shoulders** pattern.
* Red squiggle indicates a likely **short-term bearish movement** — a drop to the **demand zone** around **105,700–106,900**.
3. **Demand Zone/Order Block:**
* Marked below near **105,741** with label **"Order"**, showing where potential buy orders may sit.
* This is the first major area where price might find support.
4. **Downside Levels:**
* **106,933** and **105,741**: Potential short-term supports.
* **98,332 (Weekly level)**: If the structure breaks fully, price could revisit this major demand zone.
5. **Upside Resistance:**
* **Red supply zone above 109,000** acts as strong resistance — if BTC breaks that with volume, bullish bias resumes.
---
### 📉 **Short-Term Bias:**
* **Bearish** unless BTC breaks and holds above **109,000**.
* Expecting a pullback toward **106.9k** or **105.7k**, which may offer **buy-the-dip** opportunities.
Disclaimer : Not Financial Advice

SOLUSDT.P – Watch for Reversal from Key Demand Area (4H Outlook)SOL on the 4-hour timeframe is forming a potentially bullish setup, but patience is key as price nears a critical reversal zone.
🧠 Market Context:
After a strong move up in late June, SOL faced heavy rejection near $155–$157, which aligns with both a supply zone and a long-term descending trendline (visible across higher timeframes).
Since then, we’re seeing a series of lower highs, signaling ongoing seller control in the short term.
🔄 Short-Term Price Action:
The recent candles form a rounded consolidation, with volatility compressing.
Price is expected to retest the $143–$144 area, highlighted as the "Reversal Area" on the chart.
This area previously acted as a pivot and may serve again as a demand zone.
🛠️ Trade Plan:
Wait for a reaction at $143–$144: either a bullish engulfing, hammer, or strong volume candle to confirm buyer presence.
If reversal occurs, potential move is toward $150–$152, where price meets the long-term descending trendline again.
This setup aligns with a classic "higher low" formation before continuation.
❌ Invalidation:
Clean break below $142 with strong volume would invalidate the short-term bullish thesis and may open up downside to $138.
✅ Summary:
Bias: Bullish on confirmation
Reversal Zone: $143–$144
Target: $150–$152
Invalidation: Below $142
This setup provides a low-risk, high-reward opportunity — but only with a confirmed reversal. Let the market show its hand.

#TON Update #1 – July 6, 2025⚪️ #TON Update #1 – July 6, 2025
Toncoin has partnered with the UAE to provide a 10-year golden visa for LSE:TON stakers.
The recent surge in Toncoin is primarily driven by this news. This sharp rise should be viewed with caution, as it’s not the result of a steady, healthy trend. While it may appear to have initiated a new impulsive move, the underlying structure is not solid. Therefore, I strongly advise against making any purchases until a proper correction takes place.

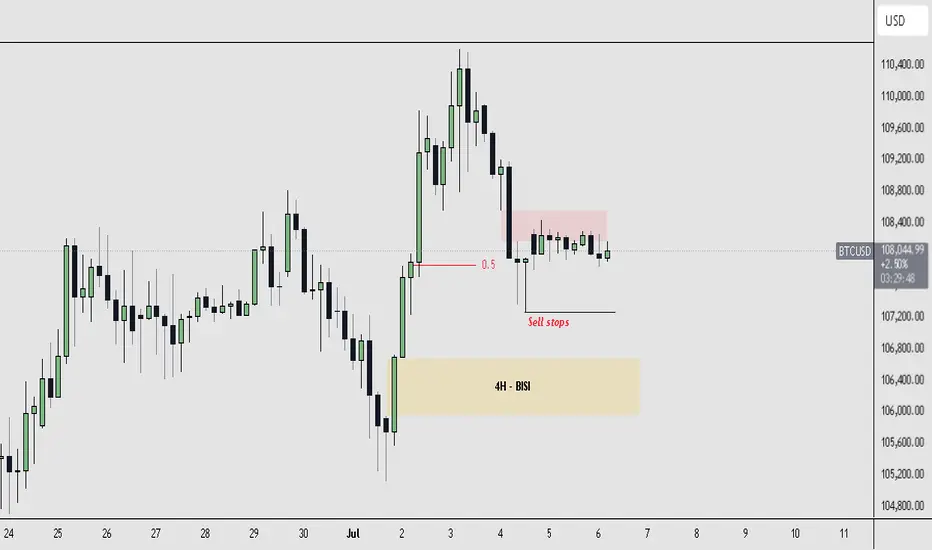
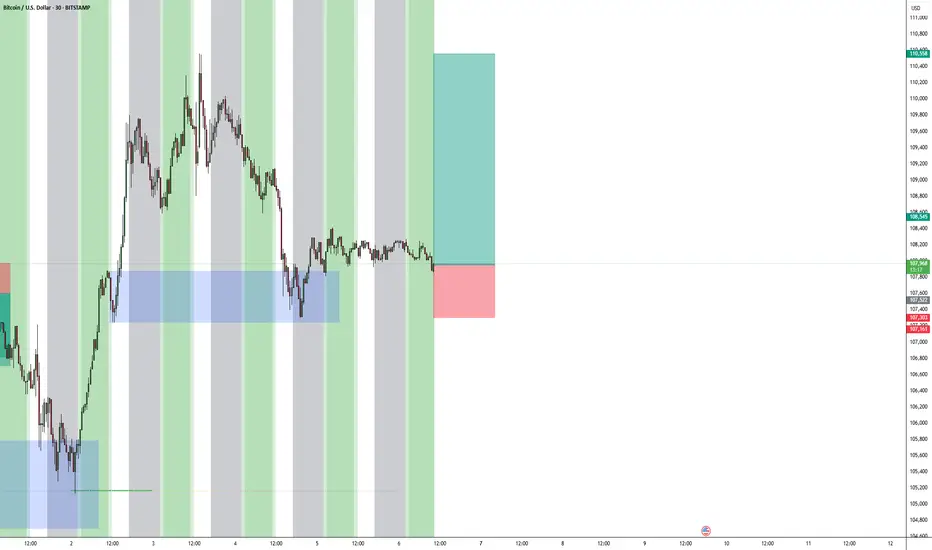
$BTCUSD Trade Idea Currently, BTCUSD is operating within a defined dealing range between $105,000 (low) and $110,600 (high). Price is consolidating near the equilibrium (0.5 level) of this range and forming a sideways structure just above visible sell-side liquidity.
We are seeing confluence with a 4H SIBI (Sell-side Imbalance, Buy-side Inefficiency) overhead, which is currently capping price and adding to short-term bearish pressure. At the same time, price is hovering above a clear liquidity pool marked by sell stops, creating a potential for a liquidity sweep scenario.
Below current price action lies a well-defined 4H BISI (Buy-side Imbalance, Sell-side Inefficiency) zone, which serves as a strong demand area and an ideal draw on liquidity before any potential bullish continuation.
LTC, he Hidden Strength Beneath the Retrace Ma dudes, we might just be witnessing something big and beautiful here. 🤌✨
Okay okay, I might sound like a total degen, but hear me out:
✅ Double bottom (check those two green arrows)
✅ Bullish divergence on the RSI
✅ MACD on the monthly just crossed bullish — for the first time ever on this pair!
✅ OBV stayed strong, didn’t collapse even during that nasty monthly retrace
✅ Notice how volume was climbing during the uptrend, but fell off during the retrace? That means the drop lacked real conviction.
We’re also sitting at an ATL (all-time low) — the lowest we've been.
Check out that red arrow pointing at the volume: that's the first sign of a burst. The next bursts? 💥 They should be explosive.
…And that’s just to name a few.
See you somewhere up there 🚀 — once we break through that T1 level, we should start trending higher fast.
That's it, that's the idea" - Good night !

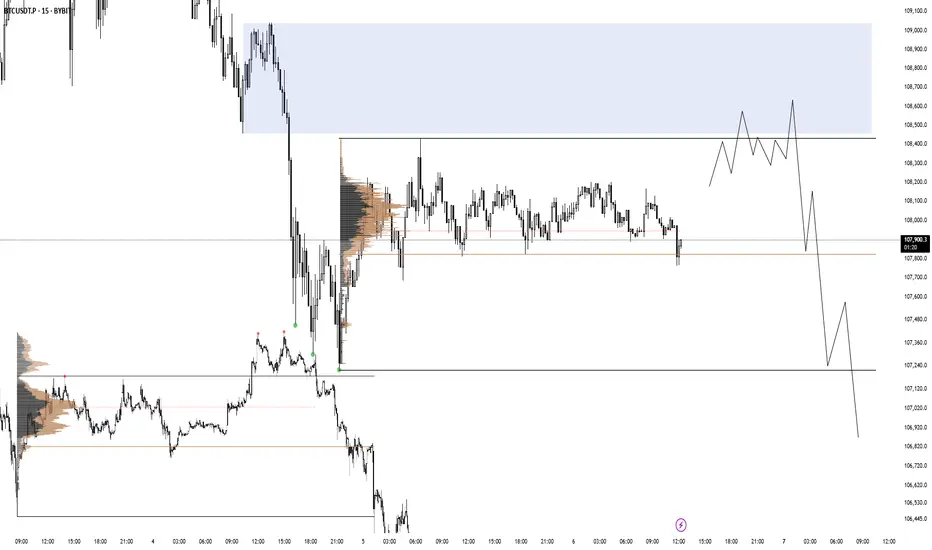
BTC 06.07.25There is a range imbalance with no price action in discount after BTC accumulated on friday afternoon. I am looking for a valid distribution like in the picture on the left.
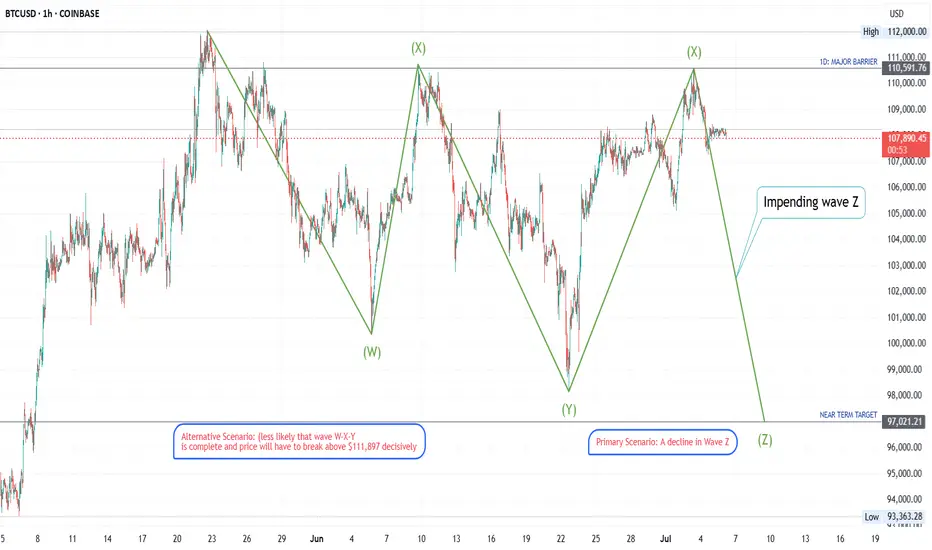
BEARISH ELLIOTT WAVE PATTERN ON BITCOINIn this short video, I explain the complex Triple Three Elliott wave pattern identified on the hourly chart on Bitcoin.
Based on the identification of the second wave X at $110,600 my most probably expectation is the completion of wave Z which will take the corrective form of an A-B-C pattern to an intended target below $98,225.
The alternative scenario is that the corrective wave ended at wave Y and the depicted Y-X wave is an impulse wave 1 and were likely on wave 2 to continue to a wave 3 which will break into a new all time high above $125,000.
Currently, I am personally in favor of the completion of wave Z as wave Y-X could not break above the MAJOR Resistance at $112,000.

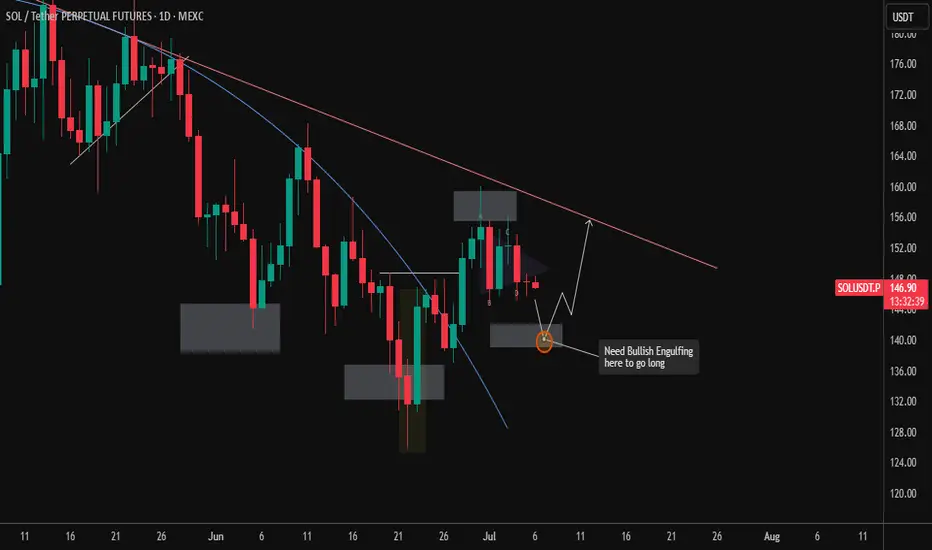
SOLUSDT.P – Waiting for Bullish Confirmation at Key ZoneThe daily chart of SOLUSDT Perpetual Futures (MEXC) is currently showing signs of a potential reversal setup, but confirmation is key before taking a long position.
🔍 Chart Overview:
Price action is in a clear downtrend, with lower highs forming consistently, capped by a descending trendline.
We’ve recently seen a pullback after a failed breakout near the $152–$154 region.
📌 Key Zone to Watch:
A demand zone around $137–$140 is marked, which previously acted as a springboard for bullish movement.
There's a confluence of this demand zone with the wedge breakout retest area.
📈 Trade Setup & Plan:
The chart notes: "Need Bullish Engulfing here to go long".
This implies a waiting strategy: look for a strong bullish engulfing candle at the $137–$140 zone before entering a long position.
If confirmed, price could rally back toward the descending trendline near $150–$154, which aligns with the prior resistance level.
⚠️ Invalidation:
A daily close below $135 would invalidate the bullish setup and likely trigger continuation toward $128–$130 support area.
📊 Summary:
Bias: Cautiously Bullish (Waiting for confirmation)
Entry Trigger: Bullish engulfing candle at $137–$140
Target: $152–$154
Invalidation Level: Below $135
Patience is key here. Let the price come to you and confirm intent before jumping in.
BTC/USDT.P ShortMy Trade Thesis & Rationale:
Here is my thinking on this short setup. I believe this is a high-confluence opportunity where the price action aligns perfectly with what I'm seeing in the underlying market dynamics.
1. The Big Picture (Daily/4H Context):
Price is currently operating at a major historical resistance zone ($110k+). This level has acted as a "ceiling" multiple times, making it a high-probability area for sellers to step in.
I've noticed that momentum on the 4-hour chart has clearly stalled, which to me signals buyer exhaustion after the last run-up.
2. The Tactical Setup (1H/15M Price Action):
After stalling at the highs, the price formed a clear distribution range on the 1-hour chart—a sign that sellers were likely absorbing the remaining buying pressure.
✅ THE TRIGGER: My entry is based on a decisive, high-volume breakdown below the key support of this range at $107,300. This breakdown was followed by what I see as a weak, low-volume retest, confirming buyer weakness and offering a prime entry.
3. My Logic:
🎯 TARGET: I've set my take profit at $106,800 because it's located within a dense pool of long liquidations. I believe these levels often act as a strong magnet for price.
❌ INVALIDATION: My stop loss at $107,550 is placed just above the broken structure. If the price reclaims this level, my bearish breakdown thesis would be proven wrong, and it's my signal to get out.

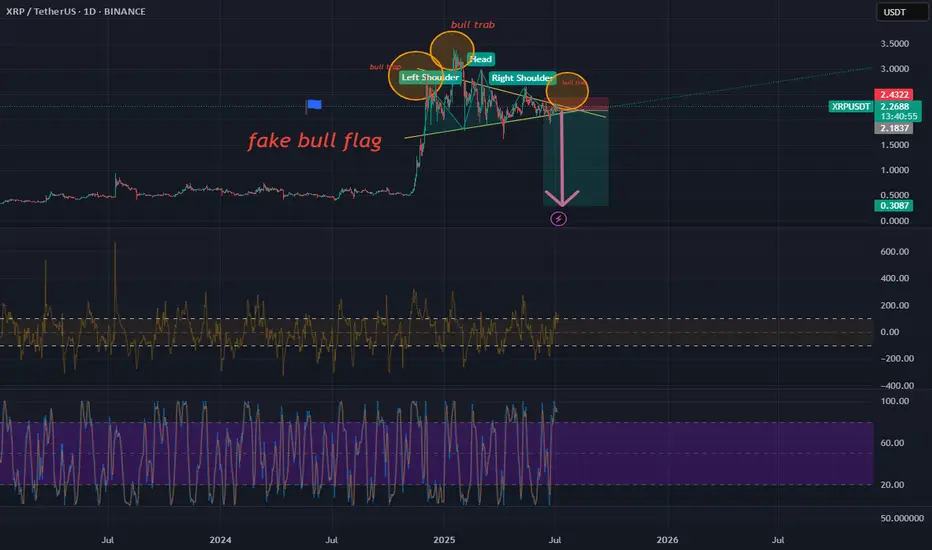
XRP is setting up fake bull flag ! SHORT TO USD 0,30 The meaningless bullish formation seen specifically for XRP is actually a big trap. This big bullish pennant formation that is being drawn is actually a big trap. I expect a very clear short position in XRP along with ETH.
This is a personal study for educational purposes. It is never investment advice. Please do your own research.
LTC - Time to buy again! (Update)Finally, this pattern was broken and had a positive impact, leading to significant growth. Now, with a slight price correction, higher price levels can be reached.
PREVIOUS ANALYSIS
Best regards CobraVanguard.💚

AKT Swing Long – High Risk, High RewardI’ve entered a swing long on AKT at $1.048, targeting a potential trend reversal off a developing base structure. This setup is riskier than my others, as price is still below macro resistance and hasn’t confirmed a full breakout yet. However, the high R:R potential and strong volume support at this level make it a worthwhile calculated risk. The setup is based on the daily chart for structure and volume confluence, and the 1-hour chart for entry timing.
My stop is placed below structural invalidation, and I have two profit targets: one conservative (TP1) and one trend-continuation (TP2). I plan to move my stop to breakeven after TP1 is hit in order to protect the trade and let the remainder run risk-free.
Entry at $1.048 – Price is compressing into a base with heavy volume support around $1.00–$1.10. The entry is just above a high-volume node and near fib retracement levels. 1H structure supports the idea with higher lows forming.
Stop-loss at $0.98 – Below the consolidation base and high-volume support. If broken, the setup is invalidated and structure breaks down.
TP1 at $1.23 – Prior breakdown level and first supply zone. Logical place to take partial profits and move stop to breakeven. Locks in ~2.7R.
TP2 at $1.50 – Full rotation target to upper volume gap and possible fib extension. If momentum builds, this is where I expect a major reaction. Gives ~6.6R.
DISCLAIMER: I am not providing trading signals or financial advice. The information shared here is solely for my own documentation and to demonstrate my trading journey. By openly sharing my process, I aim to put pressure on myself to stay focused and continually improve as a trader. If you choose to act on any of this information, you do so at your own risk, and I will not be held responsible for any outcomes. Please conduct your own research and make informed decisions.

LTC Swing Long Setup - Positioning Early for BreakoutLimit swing long placed on LTC based on consolidation above higher timeframe support and compression below a descending trendline. The setup targets a potential breakout continuation, with defined invalidation and a clear take profit ladder. Risk is tight, reward to risk is strong, and capital protection is included.
I am entering before full confirmation due to the price squeezing near support. I accept the chance of a failed breakout in return for early entry and better reward to risk.
The setup combines both daily and one hour timeframes. The daily shows structure holding above support and pressing into the trendline. On the one hour chart, the 0.236 Fibonacci level has held after an impulsive move, with high volume support around 84 to 85. A higher low is forming locally.
Limit Swing Long LTC.
Entry: $84.25
Stop-Loss: $81.70
Total risk: 1% of account capital.
TP1: $86.80 (30% – early profit, reduce risk). Move SL to $84.7.
TP2: $91.70 (40% – take out most capital)
TP3: $103 (20% – trend continuation)
TP4: $124 (10% – moonshot runner)
Take profit one locks in gains and reduces exposure. Take profit two is the main target near resistance. Take profits three and four aim for continuation if the breakout develops. Stop loss is placed below structural support and the 0.236 Fibonacci level, far enough to avoid noise but close enough to protect capital.
DISCLAIMER: I am not providing trading signals or financial advice. The information shared here is solely for my own documentation and to demonstrate my trading journey. By openly sharing my process, I aim to put pressure on myself to stay focused and continually improve as a trader. If you choose to act on any of this information, you do so at your own risk, and I will not be held responsible for any outcomes. Please conduct your own research and make informed decisions.

Altcoin Dominance Channel.Timing macro swing highs and lows, for buying and selling lower market cap altcoins.

D/USDT -ignition candle D/USDT is quietly building a strong bullish structure that’s hard to ignore. The chart shows a clear sequence of Higher Highs (HH) and Higher Lows (HL), suggesting growing buyer strength and accumulation.
What stands out is the slow, methodical price action — a classic prelude to a "God candle" ignition move. This could act as the early signal of a major reversal in trend.

bitcoin long trade setup ALL trading ideas have entry point + stop loss + take profit + Risk level.
hello Traders, here is the full analysis for this pair, let me know in the comment section below if you have any questions, the entry will be taken only if all rules of the strategies will be satisfied. I suggest you keep this pair on your watchlist and see if the rules of your strategy are satisfied. Please also refer to the Important Risk Notice linked below.
Disclaimer

Wave Pattern: Complex Correction (Triple Three) on BITCOINThe price action on this BTC chart displays the characteristics of an overlapping, sideways, and downward-drifting nature of the price swings strongly indicates a complex corrective pattern. The most fitting pattern is a Triple Three, denoted as W-X-Y-X-Z. This is an extended consolidation pattern composed of three simpler corrections (W, Y, and Z) linked by two intervening waves (X).
Most Probable Next Moves
Based on the identification of the market being at the end of a second Wave X, the following are the most probable scenarios:
Primary Scenario: A Decline in Wave Z
The highest probability path is a decline in Wave Z.
Immediate Move: The price is expected to turn down from the current resistance area (the peak of the second Wave X, roughly $110,600).
Structure of the Move: Wave Z will itself be a corrective pattern, most likely another zig-zag (structured as A-B-C down).
Price Target: A common characteristic of a Triple Three is that Wave Z will often push to a new low for the entire structure. The chart's pre-marked "NEAR TERM TARGET" at $97,021 is a logical objective. This would involve breaking below the previous Wave Y low of $98,225.
Alternative Scenario (Less Likely)
A less probable scenario is that the entire W-X-Y correction completed at the June 23rd low. In this case, the rally since then would be the beginning of a new impulsive uptrend (Wave 1). This is considered less likely because the rally from late June to early July appears corrective and lacks the powerful, non-overlapping structure typical of a new impulse wave. For this scenario to gain credibility, the price would need to decisively break above the major barrier at $111,897.
EDU/USDT “CZ’s baby”EDU, often dubbed “CZ’s baby”, is currently sitting at its under value price zone, forming a solid support base for a potential upcoming leg. After a strong reversal in April 2025, buyers stepped in aggressively around the $0.10 zone, which now acts as a key demand area.
Currently retraced nearly 40% from its recent pump, EDU is showing early signs of accumulation and strength. Given its backing and low market cap exposure, it remains one of the most underrated plays heading into the next altcoin season.

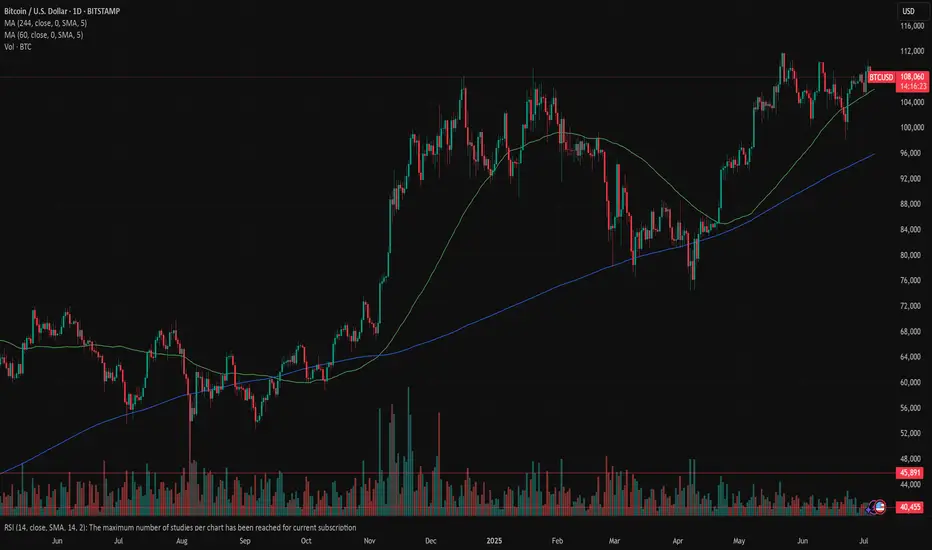
Bitcoin: higher for longer?The investors optimism supported by better than expected US jobs data was reflected mostly in the US equity market, but the crypto market was not left behind on this occasion. Although the week for crypto was quite volatile, it showed that investors are still strongly considering investments in crypto coins for diversification of portfolios, especially BTC. The BTC spent a week struggling around the level of $107K, while making its final breakthrough toward the upside, reaching the highest weekly level at $110K. It is ending the week around the level of $108K, with an equal level of buying and selling order during the weekend.
Although the price was pushed toward the $110K, the RSI did not reach the overbought market side. Actually, the indicator continued to move between levels of 50 and 60, indicating that the market is still not ready to finish the cycle and revert it toward the oversold market side. Although slowed down, the MA50 is still oriented toward the upside, same as MA200, without an indication that the cross might occur anytime soon.
Current charts are indicating the probability that the support line at $106K might be tested again in the coming period. This short reversal is necessary for BTC in order to collect enough interest for a further push toward the upside. Whether the BTC will have strength to try to reach old ATH, remains unclear from current charts, but some indication holds. However, there is some probability that the $110K might be tested for one more time.