ARPAUSDT Forming Falling WedgeARPAUSDT is drawing fresh attention from crypto traders as it forms a classic falling wedge pattern on the daily timeframe. This technical pattern is widely recognized as a strong bullish reversal signal when backed by healthy volume and growing investor interest. The falling wedge indicates that the downtrend is losing momentum, and a breakout to the upside could trigger a significant move. With current market dynamics, ARPAUSDT is showing promising signs that it could deliver an expected gain of 80% to 90% or more once this pattern resolves.
Good volume levels in recent sessions confirm that accumulation is happening quietly, which is often the case before a breakout from a wedge pattern. Traders looking for high-probability setups should keep an eye on the breakout zone around the wedge’s upper trendline. A confirmed close above this resistance with increased volume could be the catalyst for a strong rally. ARPA’s fundamentals, coupled with positive sentiment from investors taking interest in the project, add extra fuel to the potential upside.
As more altcoins regain momentum, ARPAUSDT stands out as one of the most interesting pairs to watch for short- to mid-term gains. Technical traders and pattern-based investors often target these setups to capture explosive price action. Staying patient for a clean breakout and using proper risk management will be crucial to maximize the reward potential in this setup.
✅ Show your support by hitting the like button and
✅ Leaving a comment below! (What is You opinion about this Coin)
Your feedback and engagement keep me inspired to share more insightful market analysis with you!
Crypto market

NOTUSDT UPDATE 07/02/25Liquidity cluster above: A significant band of liquidation levels exists above 0.00178–0.00180, where market makers likely enticed longs and are now ready to reverse.
Thin liquidity zones below: The area from 0.00174 down to 0.001675 has less dense heat, suggesting an easy path for a quick move down.
Last price reaction: Price recently tagged upper high-liquidity levels, followed by rejection and an initial roll over.

BELLUSDT Forming Bullish BreakoutBELLUSDT is shaping up as an interesting crypto pair to watch closely in the coming weeks. The chart structure shows a well-defined falling channel, which historically indicates a potential trend reversal when price breaks above the channel’s resistance. With the volume staying healthy, it is clear that investors are starting to accumulate positions in anticipation of a bullish breakout. This is often the early signal that smart money is entering the market before a major move.
Currently, the technical projection for BELLUSDT suggests an impressive upside potential of around 90% to 100%+. This aligns with broader market expectations as altcoins begin to show signs of recovery after extended downtrends. If this breakout confirms with increased volume and strong daily closes above the resistance line, BELLUSDT could attract more momentum traders, further driving the price upward toward the projected target area.
What makes BELLUSDT particularly attractive is the recent surge in investor interest and positive sentiment building around the project. When paired with technical clarity like this, it creates an ideal scenario for traders looking for high-reward setups. Keep an eye on the breakout zone and be ready to manage positions accordingly, as such moves can develop rapidly.
In summary, BELLUSDT is offering a compelling technical setup that could deliver significant returns for traders who position themselves wisely. Adding this pair to your watchlist and monitoring volume trends will be key in catching the next big move.
✅ Show your support by hitting the like button and
✅ Leaving a comment below! (What is You opinion about this Coin)
Your feedback and engagement keep me inspired to share more insightful market analysis with you!

BTC's Situation, A Comprehensive Analysis !!!The situation has become quite strange. Bitcoin is forming deceptive patterns, and altcoins continue their downward trend. Currently, Bitcoin is positioned within two triangles—one symmetrical and the other descending. Now that Bitcoin has reached the top of the triangle and appears ready to break upward, it might actually be hiding yet another trap within the price action.
This market has shown disregard for technical patterns, and every time the price approaches historically significant levels, it reveals its true intentions and disappoints us. This cycle tends to repeat.
In my opinion, we’re likely to see one more drop in Bitcoin’s price. After that, instead of continuing the expected downtrend from the pattern, the price could break the descending formation and experience a strong upward move.
Stay Awesome , CobraVanguard.

HOOKUSDT Forming Falling WedgeHOOKUSDT is currently showing promising technical signals that have captured the attention of many traders looking for high-upside crypto setups. The recent price action has formed a classic falling wedge pattern, which is widely known in crypto trading for its bullish breakout potential. This pattern combined with a healthy volume profile indicates that buyers are stepping in at crucial levels, increasing the probability of a strong upside move.
The price projection for HOOKUSDT suggests a gain of 90% to 100%+, which is an attractive risk-reward opportunity for swing traders and mid-term investors. With the broader market sentiment slowly improving, HOOKUSDT stands out as one of the altcoins gaining fresh investor interest. As the coin tests its upper trendline resistance, a confirmed breakout could set off a rally fueled by momentum traders and fresh capital inflows.
Investor sentiment for HOOKUSDT is building steadily, supported by good volume and a clearly defined breakout structure. This makes it an ideal crypto pair for traders who prefer setups with technical clarity and strong potential for explosive moves. Keep an eye on daily closes and volume spikes to validate the breakout and secure optimal entry points.
In conclusion, HOOKUSDT is one to watch closely as it positions itself for a potential reversal that could deliver solid gains. For those looking to diversify their crypto portfolio with setups ready for a breakout, HOOKUSDT deserves a place on your watchlist.
✅ Show your support by hitting the like button and
✅ Leaving a comment below! (What is You opinion about this Coin)
Your feedback and engagement keep me inspired to share more insightful market analysis with you!

MAVUSDT Forming Bullish ReversalMAVUSDT is currently showing strong technical signs that have caught the attention of traders who are searching for the next breakout altcoin. This crypto pair is moving within a clear downward channel, which often sets the stage for a significant bullish reversal once the price breaks out convincingly. Combined with good volume, this indicates healthy market participation and interest, a key factor for sustainable upward momentum.
Many investors are eyeing MAVUSDT because the expected gain is projected between 40% to 50%+, a realistic target considering its price structure and historical volatility. The recent price action shows that buyers are stepping in near key support levels, which adds to the conviction that a breakout could push prices higher. The confluence of a well-defined pattern, solid volume, and growing investor sentiment makes MAVUSDT an attractive setup for swing traders and medium-term investors.
Additionally, MAVUSDT aligns well with the broader crypto market recovery trend, which has seen altcoins reclaiming lost ground. As traders hunt for high-potential coins with clear technical setups, MAVUSDT stands out for its ability to deliver consistent price swings. Watching the breakout levels and monitoring daily closes will be crucial to confirm the move and manage risk properly.
In summary, MAVUSDT is worth keeping on your radar for its clear technical pattern, solid volume profile, and potential to deliver a strong upside move in the coming sessions. Stay alert for a confirmed breakout to capture the best part of this anticipated run.
✅ Show your support by hitting the like button and
✅ Leaving a comment below! (What is You opinion about this Coin)
Your feedback and engagement keep me inspired to share more insightful market analysis with you!

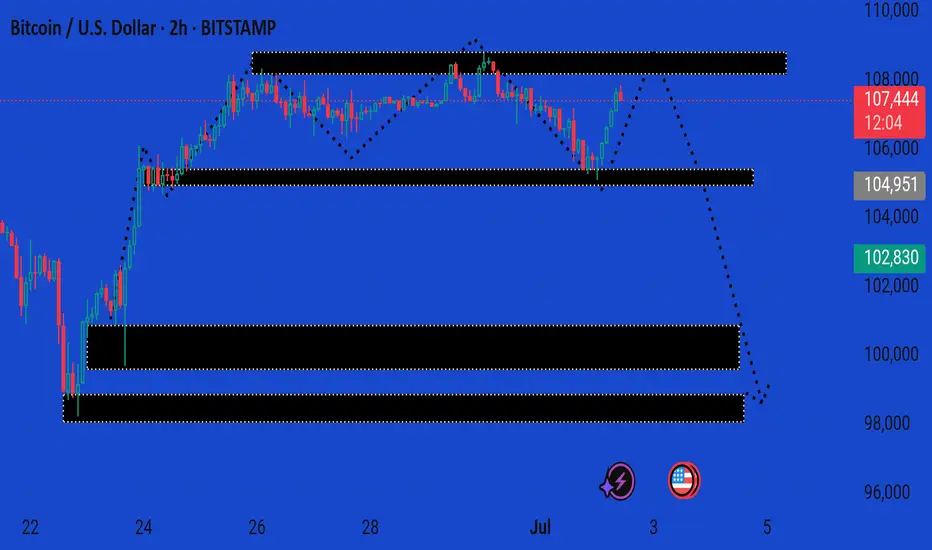
BTCUSD UPDATE MARKET This is a 2-hour BTC/USD (Bitcoin to US Dollar) chart showing a bearish projection after a consolidation phase. Here's a breakdown of the analysis:
---
🔍 Current Price:
107,549 USD
Up +1.74%, suggesting a recent bullish push — likely a short-term rally.
---
🧠 Technical Zones & Forecast:
1. Resistance Zone (~107,500–109,000):
This area has been tested multiple times.
The dotted arrow from this level suggests a projected reversal, possibly forming a lower high.
2. First Demand/Support Zone (~104,800–105,200):
Shallow support. If broken, it may confirm the start of a deeper correction.
3. Second Demand Zone (~101,500–102,800):
More robust support.
Could serve as a bounce zone or long-entry area.
4. Third Major Demand Zone (~97,500–99,000):
Strong long-term support; a bearish target if momentum increases.
---
🧭 Directional Bias:
The dotted line shows a bearish trajectory with targets at 104.9k, 102.8k, and potentially 99k.
The price action reflects a distribution range at the top, hinting at potential markdown phase starting soon.
---
✅ Conclusion:
Short-term bullish, but showing signs of weakness near resistance.
Watch for rejection around 108k–109k to confirm the bearish move.
Breakdown below 104.9k would accelerate downside toward 102.8k and 99k.
Let me know if you'd like entry/exit signals or stop-loss suggestions based on this outlook.
TIA Scalp trade setupwait for the retest of breakout, set sl & tp. While on swing trade will long below 1.31 and tp 2.0$, TIA is extremely oversold, So less affected by BTC.

Ethereum (ETH): Good Start, Seeing Buyside DominanceEthereum has done well, where we have established a proper support area near the local buy zone, which should be enough for us to have a proper bounce from here towards our target of $2800.
As long as buyers keep the dominance near the buy area, we are bullish!
Swallow Academy

Bitcoin Uptrend Momentum, Key Buy Zone at 106.3K–105.9K__________________________________________________________________________________
Technical Overview – Summary Points
__________________________________________________________________________________
Momentum : Uptrend confirmed across all timeframes ≥1H; no signs of exhaustion or overheating.
Major supports : 106,319, 99,581, 98,133 USD
Major resistances : 108,239, 108,685, 111,949 USD (ATH)
Volume : Normal on higher TFs, very high on 30min/15min (potential breakout or institutional shake-out).
Behavior : Risk On / Risk Off Indicator = Strong Buy from 1D to 1H, neutral on 15min; ISPD DIV neutral across all TFs (no extreme behaviors).
__________________________________________________________________________________
Strategic Summary
__________________________________________________________________________________
Bias : Bullish as long as 98,133 is held on daily closes; structural buying pressure confirmed.
Opportunities : Swing accumulation on pullbacks to 106,319–105,900; targeting 108,700 then 111,949 on breakouts.
Risk : Geopolitical catalyst or break below D Pivot Low 98,133.
Macro catalyst : No major events (Fed, CPI, NFP) over the next 48h. Watch Powell’s speech (2 July).
Action Plan : Long entry on pullback to 106,300–105,900, stop <105,900, targets at 108,700 then 111,900. Exit on daily close below 98,133.
__________________________________________________________________________________
Multi-Timeframe Analysis
__________________________________________________________________________________
1D – Daily : Strong uptrend; balanced volumes; supports at 98,134 / 99,581; resistance at 108,239–111,949.
12H/6H/4H : Positive confluence. Accumulate on any return to support; no behavioral excesses detected.
2H–1H : Rising volumes, no divergences; strong timing for entries on dips.
30min/15min : Very high volume (breakout/shake-out); structure remains bullish. 15min Risk On / Risk Off Indicator =Neutral → watch for short-term consolidation or traps but broader trend holds.
Clear bullish confluence on all TFs ≥1H, with no behavioral or macro warning.
Short-term risks on micro-TFs (extreme volume, possible shake-out).
Accumulation zone on 106,300–105,900 pullbacks, invalidation below 98,133.
__________________________________________________________________________________
Cross-Analysis & Strategic Synthesis
__________________________________________________________________________________
Trend : No reversal signals. All indicators (volume, price action, Risk On / Risk Off Indicator) point to trend continuation.
Macro & newsflow : Monetary status quo, no negative catalyst in the short term. Only open risk: geopolitical tensions, closely monitored.
On-chain & fund flows : Ongoing ETF inflows, stable capitals, strong HODL trend, SSR stable.
Risk management : Stop <105,900, hedge on geopolitical signals.
Summary:
All TFs ≥1H aligned in bullish cycle, corrections = structured long accumulation opportunities.
Key buy zone: 106,300 – 105,900; prudent stop <105,900; main targets 108,700 and ATH.
Closely monitor for Powell/Fed headlines.
__________________________________________________________________________________

$ADA Bulls Wake Up—Potential 9% Rally If This Level HoldsCardano (ADA) appears to be attempting a short-term recovery after a prolonged decline, as shown in the 4H chart from Binance. The price recently bounced from a well-defined support level around $0.5391, which has held multiple times in recent sessions, confirming buyer interest in this zone. This support also aligns with a previous consolidation range and has proven reliable in the past.
The price is now approaching a zone of dynamic resistance marked by the BEST Cloud ALL MA indicator. This red-shaded cloud represents the bearish control zone, and ADA has repeatedly failed to break through this area in recent weeks. However, ADA is now showing early signs of upward momentum as it consolidates just beneath the first resistance at $0.5734 (also marked as TP1). This resistance corresponds with the bottom of the cloud and recent swing highs.
The broader trend is still bearish, but the structure suggests a possible reversal if bulls can reclaim levels above the cloud. A further push above $0.5734 could attract fresh buying interest and target the next resistance level near $0.6155, which also represents TP2 on the chart. This upper zone served as a breakdown point in mid-June and may now act as a key level to watch.
Meanwhile, the green moving average line (part of the cloud setup) is starting to flatten. This often signals a transition from downtrend to range or even an early reversal—especially when combined with a support bounce and higher low formation.
There’s no clear bullish breakout yet, but the setup looks favorable for a cautious long position.
Trading Idea
• Entry Zone: 0.5550 – 0.5600 (near current consolidation)
• Target 1 (TP1): 0.5734
• Target 2 (TP2): 0.6155
• Stop Loss: Below 0.5391 (e.g., 0.5320 – adjust based on your risk appetite)
• Risk/Reward to TP2: Around 2:1
If price breaks below $0.5391, the bearish structure would be confirmed, possibly leading ADA back toward the $0.50–$0.48 region. But as long as this support holds, the market favors a recovery scenario toward the resistance levels mentioned.
Overall, this is a textbook support-to-resistance play, with potential for an 8–9% upside if bullish momentum sustains. Confirmation through volume breakout above the cloud will further strengthen the case for short-term gains.

BTC: Price to 134,500$ , FVG, Fib 0.5 and 0.618 ratio ?Price to 134,500$:
Bitcoin is now moving in a triangle pattern, which is getting smaller. The price is around $107,758. Here is possible move is a breakout to the downside first, where the price may drop to fill the "Fair Value Gap" area, which is marked in purple. This area is between the Fibonacci levels of 0.5 and 0.618. After that, Bitcoin could go up again and reach the price of $134,000.
Trade Ideas:
I marked 2 areas with arrow let the price reach here and wait for confirmation in both areas. Specially in Fair Value Gap area.
Trade Signal:
I will provide both trade signal here so follow my account and you can check my previous analysis regarding BITCOIN. So don't miss trade opportunity so follow must.
BINANCE:BTCUSDT BITSTAMP:BTCUSD COINBASE:BTCUSD COINBASE:BTCUSD BINANCE:BTCUSDT.P CRYPTO:BTCUSD BYBIT:BTCUSDT.P BINANCE:BTCUSD

108400 Breakout Level – Bullish Above, Bearish BelowWatching 108400 closely as a key breakout level.
Above 108400: Momentum shifts bullish – potential for upward continuation.
Below 108400: Bias remains bearish – risk of further downside.

Bitcoin (BTC): Buyers Are Back in Control | New ATH Incoming?Buyers have taken full control once again where we had a good bounce near our buy zone. As we approach the local resistance zone, we are expecting to see a proper breakout from here, which would then lead us to a new ATH (around $120,000).
Swallow Academy

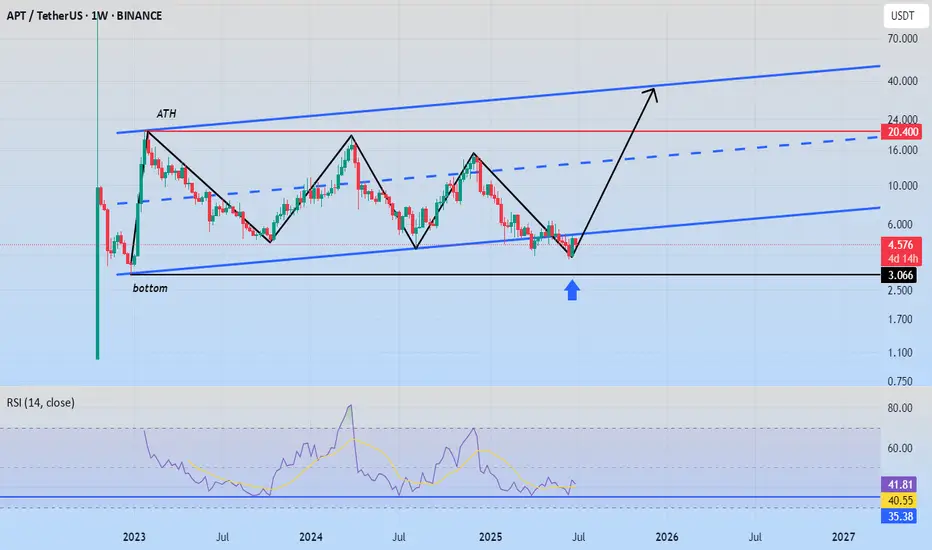
APT 35$ SOONHI GUYS
See the masterpiece on the chart.
Coinciding with very positive news for the currency,
The currency has been moving within a price channel since its launch.
We also see a false break of the channel, while maintaining the bottom on the RSI.
There was no break, so it's considered a false break.
With any chance of a market recovery, we'll find the currency rising strongly.
It will be a star in the Bull Run.
I wish everyone abundant profits.
Like and follow for more.
1000 Floki swing trade setupwait for the entries, must use SL. Don't go for long at any coin wait for the short entries.

Bitcoin Faces Impending Drop to Mid-30,000sAs of July 02, 2025, Bitcoin’s price chart, crafted by "RoadToAMillionClub" on TradingView, paints a concerning picture. Currently hovering at $107,831, the cryptocurrency appears to be teetering at the edge of its upper channel, signaling potential trouble ahead. The recent 0.51% dip may be just the beginning of a more significant decline.
The long-term upward trend, marked by a supportive orange line since 2018, has been a beacon for bulls. However, the green trend line projecting a drop toward the mid-30,000s range, around $37,932, suggests a looming correction. This level, a historical support zone, could become the next battleground as selling pressure mounts.
Market indicators point to overextension, with the price hitting a 4-day and 14-day high of $107,831 before the recent pullback. The speculative fervor that drove Bitcoin to these heights seems to be waning, increasing the likelihood of a bearish turn. Investors should brace for volatility, as the cryptocurrency may struggle to maintain its current altitude, potentially sliding toward the mid-30,000s in the coming months.

ETH/USD (Ethereum to US Dollar) on the 1-hour timeframe. ETH/USD (Ethereum to US Dollar) on the 1-hour timeframe.
Here’s a quick breakdown of what’s visible:
There is an Ichimoku Cloud indicator on the chart.
A resistance zone is marked at the top (around $2,540 – $2,550).
A support zone appears around $2,440 – $2,460.
There's a bullish arrow pointing toward the resistance zone, suggesting an expected upward movement.
🎯 Target:
Based on the chart setup and your markup:
Short-term bullish target (Take Profit): $2,545 – $2,550
Entry zone appears to be: Around $2,460
Stop loss (if managing risk): Below $2,430
This setup looks like a range play or breakout attempt, betting on ETH bouncing off support and retesting resistance.
.

CULT DAO ON ITS WAY TO A BILLION DOLLAR MARKET CAPIf you want an in-depth look at everything CULT DAO, check out the TA below:
This is just a technical update.
A massive breakout occurred as expected. I’ve been highlighting the divergence forming in the MACD for months — it’s all detailed in the TA above.
Over the last 1,096 days, CULT DAO has formed a giant descending wedge — both in price structure and on the MACD. The path was clear.
Onwards and upwards.
A billion-dollar market cap is very possible by Q4 2025.
Breakthrough tech.
Mainnet launch around the corner.
Rocket ship loading.

BTCUSD | 89.99%++ Accuracy Trade | Bitcoin AnalysisThe trade has a defined risk-to-reward structure, with the stop-loss (SL) set at approximately $93,590 to manage downside risk. The target is clearly identified at $98,460, suggesting a potential breakout toward higher levels. The highlighted support and resistance areas provide context for price action, signaling a continuation of the bullish trend if the support holds.
BINANCE:BTCUSDT

Bitcoin Long Now ! Details chart ! 89% Accuracy VIP Signal !🟢 BTCUSDT Long Setup | 15min (BINANCE)
Entry: ~108840 zone
Stop Loss: Below 108192.82
Take Profits:
TP1: 109488.98
TP2: 110149.67
TP3: 110855.75
Reasoning:
Liquidity grab below support.
Bullish rejection and structure shift.
Potential W pattern forming.
Clean RR and price action setup.
Trade Plan:
Expecting price to break above 109488.98, retest it, and then push toward 110855.75.
📊 Classic support rejection + market structure shift play.
🔔 Not financial advice. Manage your risk!
#BTC #BTCUSDT #Crypto #TradingView #PriceAction #LongSetup #Binance #TA

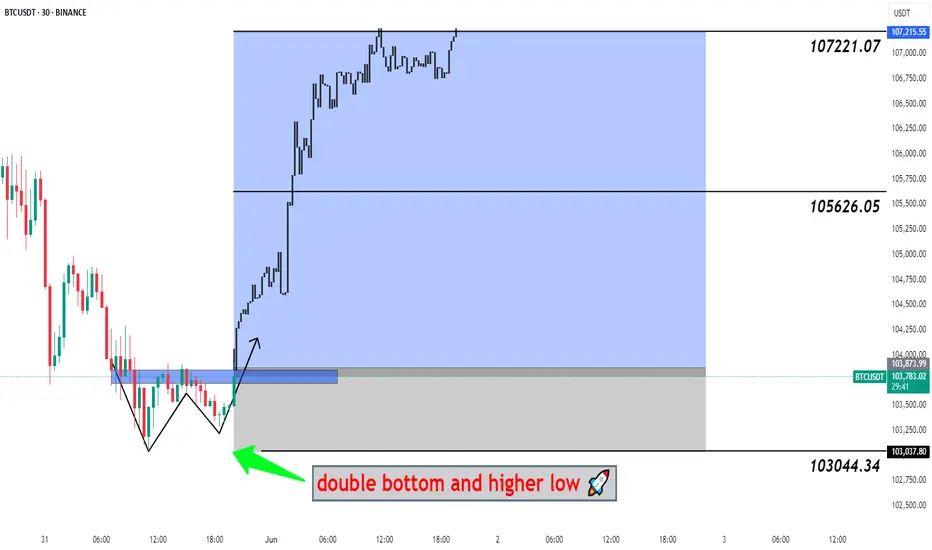
#BTCUSDT Big Pump Next Hour - Bitcoin, BTCUSD, BTCUSDT 📉 Double Bottom Pattern Forming – Potential Reversal Setup
The current price structure is showing signs of a Double Bottom – a classic bullish reversal pattern. After an extended downtrend, this pattern suggests that the market may be preparing for a trend reversal from this key demand zone.
🔹 Trade Setup
Entry, Targets, and Stop Loss (SL) are marked on the chart.
Entry: Upon breakout confirmation above the neckline.
Stop Loss: Just below the recent swing low to manage downside risk.
Targets: Calculated using the measured move method from the bottom to the neckline .
🔹 Risk & Money Management (Professional Approach)
To maintain consistent profitability and protect capital, strict risk management is essential. For this setup:
🔸 Position Sizing: Based on a fixed % of total capital (typically 1–2% of account equity per trade).
🔸 Risk-to-Reward Ratio: Minimum of 1:2, ideally higher.
🔸 Stop Loss Discipline: No arbitrary changes after entry. SL only adjusted for breakeven or trailing stops once price moves favorably.
🔸 Trade Management: Secure partial profits at key levels, trail stops as structure forms.
🔸 Capital Allocation: Avoid overexposure. Trade fits within overall portfolio strategy.
💬 Let the setup come to you. React, don’t predict.
🔁 Like, comment, or share your thoughts below!
BINANCE:BTCUSDT BITSTAMP:BTCUSD COINBASE:BTCUSD BINANCE:BTCUSDT.P INDEX:BTCUSD CRYPTOCAP:BTC.D CRYPTO:BTCUSD BYBIT:BTCUSDT.P BINANCE:BTCUSD
BTC - High Probability Trade Idea Here we have a major resistance at this upper level. And market seems to create a "Double Top Patter". So its indicating a possible bearish move.
Target and Sl on chart. Follow risk and money management.
BINANCE:BTCUSDT BITSTAMP:BTCUSD BINANCE:BTCUSDT.P INDEX:BTCUSD BYBIT:BTCUSDT.P BINANCE:BTCUSD
