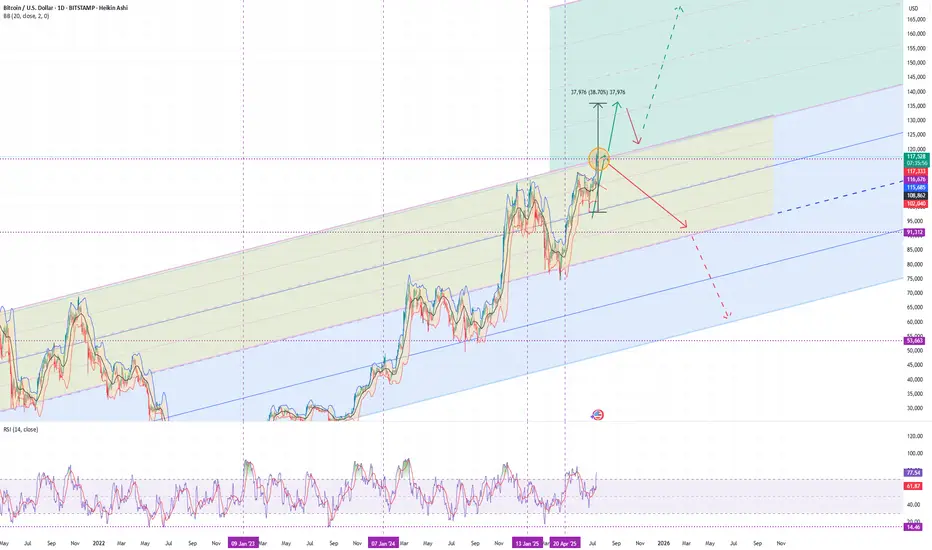
BTCUSDTIf Bitcoin's weekly timeframe is modeled according to the previous step, it can go up to $120,000 for the first target, according to the previous analysis, but the second target could be in the range of $137,757 to $144,000.
Crypto market

You Seek Profit, they seek you !who?Every time you think the market’s about to crash, it pumps.
And when you’re sure it’s time to enter, it dumps.
Maybe it’s time to ask a serious question: Who’s really hunting whom?
Hello✌
Spend 3 minutes ⏰ reading this educational material.
🎯 Analytical Insight on Ethereum:
As noted earlier, after several days of sideways action, BINANCE:ETHUSDT has confidently broken above its parallel channel. 🚀 This breakout sets the stage for a potential gain of at least 10%, targeting around 3200. There is also a chance for a retest of the channel’s upper boundary before continuing higher. 🔄
Now, let's dive into the educational section,
🎯 The Modern Market Hunters
Markets today aren’t simple anymore. Behind every candle lies a strategy, an algorithm designed for one thing:
Profiting from your fear and greed.
In crypto, liquidations have turned from a mere term to a deadly tactic. When you enter a position, exchanges know exactly where your stops are. Often, price moves are designed to trigger liquidations of traders like you.
🛠 TradingView’s Tools to Spot the Traps
In a market where hunters are always one step ahead, TradingView’s default tools can be your secret weapon. You just need to know where and what to check:
Volume Profile (Range & Fixed): Shows where real money volume has entered, not just pretty candles.
Liquidity Zones Indicators: Pinpoints exact areas where stops cluster the prime hunting grounds.
Order Block Detection Scripts: Marks zones where whales place heavy orders, always moving against retail trader sentiment.
Set these tools on 1H to 4H timeframes and focus on overlapping areas. This way, you can spot traps before they activate, not after.
🔬 How Are Traps Actually Set?
Markets first build a nice trend, making everyone FOMO in. Then, a sudden shadowy candle crashes the party.
This is called a liquidity sweep or stop hunt.
Signs are clear:
Sudden volume spikes
Positions quickly flipping to profit or loss
Long shadows on candles signaling stop grabs
This is exactly where Open Interest and Liquidity Maps come in handy. They reveal the hunting map before your eyes.
🧠 Your Mind Is The Biggest Liquidity Map
The biggest traps are built inside traders’ minds. When the market moves against you, you panic and set stops.
But that’s exactly the lesson market makers want you to learn: don’t react emotionally.
Instead, a pro trader uses others’ behaviors as cues before market moves.
While you focus on profit, whales focus on your biggest fear: stop loss.
🔄 Your Greed Is Their Data
Every stop you set is a data point for them. You chase profit, they chase your surrender.
Lots of long volume in one zone? Price gets dragged down.
Everyone’s short? Expect a fake pump.
Volume is a footprint, and they track emotional traders like a bloodhound.
🚧 Escape The Trap, Don’t Predict The Market
Pro trader’s formula:
Don’t try to predict track.
When you realize the market isn’t moving naturally but hunting orders, your mindset shifts. You become a tracker, not a soothsayer.
📉 Every Candle Can Be A Killer If You’re Unaware
When a big opposing candle hits your position, ask:
Are we all thinking the same thing?
If yes, you’re likely the next target.
📌 Final Summary
If you only chase profit, you miss the fact the market is hunting you.
The only way out: know they play with your info, not just the charts.
Trading blindfolded is walking into the wolf’s den.
✅ What To Do Next?
Learn to analyze other traders’ moves, not just price action.
Use TradingView tools to see behind the candles.
You’re not here to be hunted you’re here to hunt. So this time, guess where everyone’s stop will be before entering!
✨ Need a little love!
We pour love into every post your support keeps us inspired! 💛 Don’t be shy, we’d love to hear from you on comments. Big thanks , Mad Whale 🐋
📜Please make sure to do your own research before investing, and review the disclaimer provided at the end of each post.

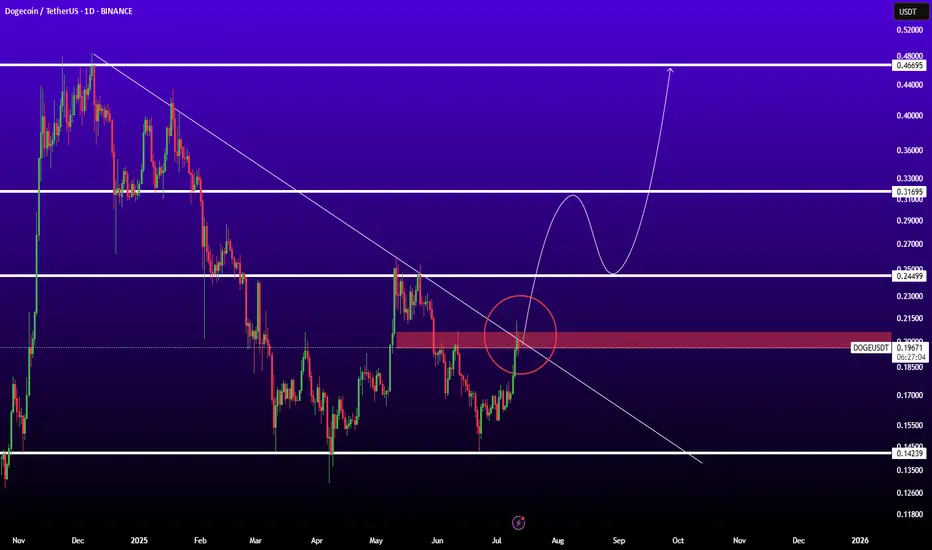
DOGEUSDTBINANCE:DOGEUSDT is in good level for pump because if breaked trendline and resistance 0.200$ ready for sharp movement to next levels.
Resistances: 0.25 - 0.32 - 0.45
Support: 0.15
Bitcoin price increaseAfter the tensions between traders in the United States and the strong price fluctuations in the dollar and other stocks, and after the 3-month increase in gold, this time it will be the turn of digital currencies to increase again and there are signs of their increase in the market. For Bitcoin, two increase targets can be considered: $110,000 - $120,000.
Sasha Charkhchian

XRP - ContinueRipple's price movement in the main channel and its decline or decrease to the lowest price level has been completed, and we can expect an increase in the price of this currency in the crypto market. Ripple's analysis has recorded a 200% increase so far, which you can see the results of in past analyses.
Sasha Charkhchian

BTCUSDTWait for breaked ATH for 115K target.
BINANCE:BTCUSDT.P
Now price is in two level trading renge but come entry volume of buyers.

Continued Bitcoin AnalysisAccording to the exact analysis, Bitcoin fell to the specified range and is currently on an upward path. You can follow the rest of the analysis in the main analysis updates.
Sasha Charkhchian

$SUI/USDT Breakout Analysis 1D Chart: SUI has broken out$SUI/USDT Breakout Analysis 1D Chart:
SUI has broken out of a clear falling wedge pattern on the daily timeframe — a bullish reversal structure. This breakout is significant, especially with strong volume confirmation and price now trading above both the wedge and the 50 EMA.
🔸 Support $3.05:
The 50 EMA aligns closely with the $3.05 level, now acting as a solid support. Retesting this area successfully would validate the breakout further.
🔸 Upside Target: $5.5
The projected move based on the wedge's height suggests a run toward the $5.0–$5.5 zone, especially if bulls maintain control.
🔸 Risk Level at $2.80:
A daily close back below the wedge and 50 EMA would invalidate the bullish breakout and suggest caution
🔸 Watch for a potential retest of $3.05–$3.20. If this zone holds, it could be a strong entry area with upside potential toward $4.0, $4.7, and $5.5 in the coming weeks.

TRX Grinding Higher – Are These the Next Targets?📈🔥 TRX Grinding Higher – Are These the Next Targets? 🧱🚀
Continuing the Altcoin Series, let’s take a look at TRX (Tron) — quietly grinding higher while the crowd stays distracted elsewhere.
As I’ve said before: I’m preparing to divorce altcoins at the top of this cycle. But until then, I’m a trader — and TRX is a chart that deserves our attention right now.
🔍 Two Perspectives, One Message
The 1H intraday chart shows clear structure within an ascending channel, holding its higher lows beautifully.
Meanwhile, the 2D macro chart reveals a long-term channel breakout, now pressing up into key resistance.
📊 Levels That Matter
Short-Term Support (1H):
🔹 $0.29926
🔹 Mid-channel trendline
Macro Zones (2D):
🔸 Current Price: $0.30991
🔸 Next key levels:
$0.38540
$0.46122
Structure to Watch:
Price remains well-supported by the orange trendline — a multi-year diagonal that’s been acting as dynamic support. As long as that holds, TRX remains on the offense.
⚠️ Narrative-Free Trading
Let’s be real — Tron isn’t the sexiest narrative play.
But the chart doesn't lie: structure is intact, trend is up, and targets are in sight.
This is the kind of setup where emotion gets left at the door — we trade the level, not the label.
Buy over support
Exit near resistance
Control risk — always
TRX may not trend forever — but for now, it’s trending just fine.
One Love,
The FXPROFESSOR 💙
Disclosure: I am happy to be part of the Trade Nation's Influencer program and receive a monthly fee for using their TradingView charts in my analysis. Awesome broker, where the trader really comes first! 🌟🤝📈

ETHEREUM DAILYETHEREUM DAILY CONFIRMATION FOR LONG IS NOT APPROVED YET.BE PATIENT
Ethereum Approximately $2,930.55 per ETH, watch for 30754 ascending trendline breakout or pull back into 2680 zone ,if we keep buying then 4100 zone will be on the look out as immediate supply roof break and close will expose 4900.my goal in this context is to see ETHUDT buy into my purple supply roof,it will happen .
Market Capitalization: Around $358 billion, making Ethereum the second-largest cryptocurrency by market cap.
Circulating Supply: About 120.7 million ETH.
Recent Performance: Ethereum has gained roughly 17.3% over the past week and about 7% over the last month, though it is down about 4% compared to one year ago.
Market and Technical Overview
Ethereum remains a key player in the blockchain ecosystem, supporting decentralized finance (DeFi), NFTs, and smart contract applications.
The price is consolidating near the $3,000 level, with technical indicators suggesting moderate bullish momentum but some short-term volatility.
Trading volume in the last 24 hours is around $29 billion, indicating strong liquidity and active market participation.
Ethereum continues to be a foundational blockchain platform with strong institutional interest and ongoing development, maintaining its position as a major digital asset in 2025.
#ethusdt #btc #bitcoin

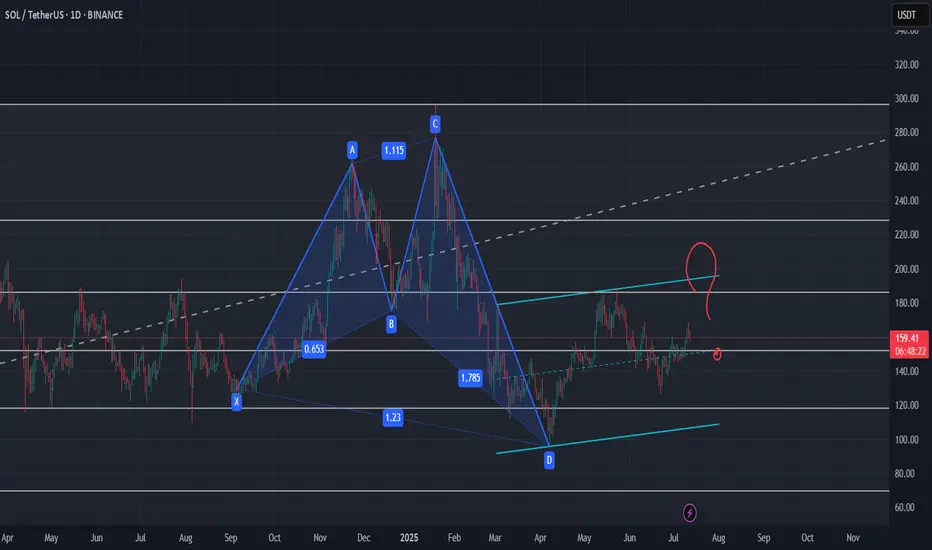
HARMONIC PATTERN on Daily for SOL ?I wonder if this pattern is the one which is highlighted by our friend and chart analyst @The_Alchemist_Trader_
Let's see if it need to test one last time the support of this channel or if it will break out for the long waited rally.
Level to keep an eye :
0.5 Fib support need to hold and clean breakout of the 0.382 Fib
Indicators : RSI, volume and volatility (liquidations)
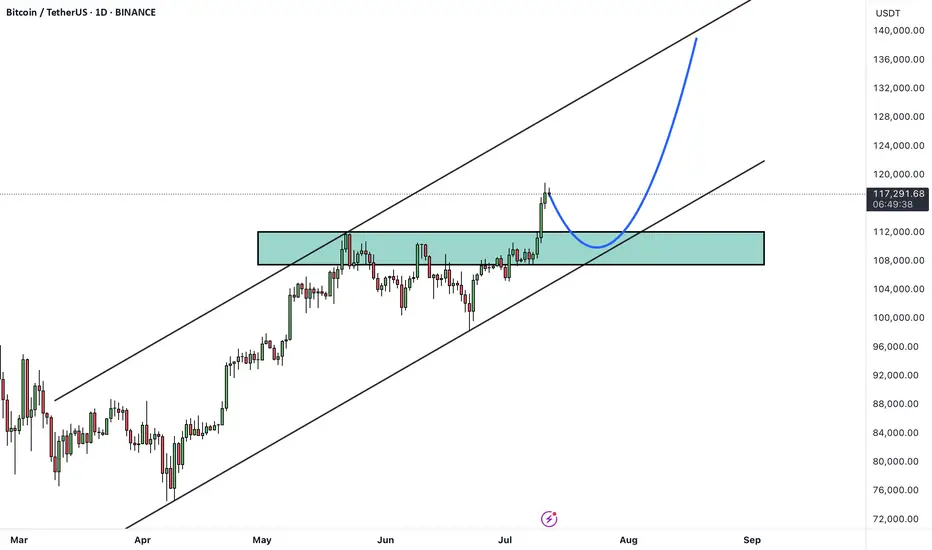
BTCUSDTHello Traders! 👋
What are your thoughts on BITCOIN?
Bitcoin has recently broken above its all-time high and printed a new record high, signaling strong bullish momentum. Currently, the market has entered a consolidation phase, which is typical after such a major breakout.
A pullback toward the previous breakout level (the old all-time high) is expected, which now acts as new support.
After this consolidation and pullback, the price could resume its bullish trajectory and move toward higher targets, including the upper boundary of the current bullish channel.
As long as the price remains above the key support zone, the overall trend remains bullish and any dip could be seen as a buying opportunity within the broader uptrend.
Will this consolidation lead to the next leg up, or is a deeper correction ahead? Share your thoughts below! 🤔👇
Don’t forget to like and share your thoughts in the comments! ❤️
Layer3 Can Grow 600% Easily (1,000%+ Possible) · Weekly & DailyWe are going to start by looking at the weekly timeframe. After we do a deep analysis on this scale we will move to the daily.
Layer3 (L3USDT) produced its main low in September 2024 after it started trading. We can consider this the market bottom. After this low a bullish wave develops and totals +330%. The peak happened in November 2024. After a bullish wave, there is always a correction and that's exactly what happened for L3USDT.
The correction produced a low that ended 10-March 2025. This is the first low after September 2024 and ended up as a higher low, which means bullish. Buyers were present on the drop and bought before sellers were able to compromise the previous support, our market bottom.
The reaction to this support zone holding produced 300% growth within 3 weeks. Then the same dynamic plays out again. A bullish move is followed by a correction.
The new correction, starting after the late March high, ended the 16-June week. This low moves lower compared to 10-March but the candle/session ends up closing higher. Above the 10-March week wick low, a signal of strength.
When comparing June 2025 vs September 2024 we have a long-term higher low and this supports a bullish bias and a new bullish wave. Just like March but this time stronger.
Now L3USDT has been green three consecutive weeks, this is good. A local downtrend has been broken and seeing how the overall market is doing, the rest of the altcoins, we can expect strong growth. Layer3 is set to move and is already moving, bullish momentum will only build-up.
The targets on the chart are all high probability. The first two are very easy targets. So 600% can happen easily mid-term, which is within 3 months (90 days). The remaining target should be considered long-term.
Daily Timeframe:
The daily timeframe is basically the same. The bullish bias is early but very strong based on multiple reversal bottom patterns and the break of a local downtrend.
This is a good choice.
Thanks a lot for your amazing support, it is truly appreciated.
Namaste.

Can SOL break out strong and rally 12% to $185?Hello✌
let’s dive into a full analysis of the upcoming price potential for Solana📈.
BINANCE:SOLUSDT is forming a clear inverse head and shoulders pattern near a strong daily support zone, signaling a potential trend reversal. This setup suggests at least a 12% upside, targeting $185, marking a promising start for SOL’s next bullish move. 📊🔥
✨ Need a little love!
We pour love into every post your support keeps us inspired! 💛 Don’t be shy, we’d love to hear from you on comments. Big thanks , Mad Whale 🐋

Will Cardano’s breakout drive a 15% surge to $0.80?Hello✌
let’s dive into a full analysis of the upcoming price potential for Cardano 📈.
BINANCE:ADAUSDT has broken out of its descending channel with strong volume, indicating a potential bullish reversal. Price is currently near a key support level, setting the stage for further upside. A move toward the $0.80 target, offering at least 15% gain, looks likely. 📊🔥
✨ Need a little love!
We pour love into every post your support keeps us inspired! 💛 Don’t be shy, we’d love to hear from you on comments. Big thanks , Mad Whale 🐋

Is SUI ready to surge 13% toward $3.95 target?Hello✌
let’s dive into a full analysis of the upcoming price potential for SUI 📈.
BINANCE:SUIUSDT has broken out of its descending channel with notable volume, indicating a potential shift in momentum. Price action is currently holding near a key support area, which could act as a solid base for further upside. With sustained buying pressure, a move toward the $3.95 target offering at least 13% upside remains on the table. 📈🔥
✨ Need a little love!
We pour love into every post your support keeps us inspired! 💛 Don’t be shy, we’d love to hear from you on comments. Big thanks , Mad Whale 🐋

UNI up 13% – is $10 the next stop?Hello✌
let’s dive into a full analysis of the upcoming price potential for Uniswap 📈.
BINANCE:UNIUSDT has maintained solid bullish structure within a well-formed ascending channel and is now approaching a key daily support zone. Recent volume spikes and a 13% price increase indicate growing buying interest. A breakout above the channel resistance could open the way toward the psychological target at $10, a level watched by many traders. Monitoring price action and volume confirmation here is essential for potential trend continuation. 📈🧠
✨ Need a little love!
We pour love into every post your support keeps us inspired! 💛 Don’t be shy, we’d love to hear from you on comments. Big thanks , Mad Whale 🐋

Xrp wave countXrp wave count to see where this bull run is going to take us.
Please be realistic and don’t miss out on massive profits by being greeedy!!! Xrp will not be $100 this year.
Probably have to wait a while, like years. So take your profits at $7-10, and then buy back in after the corrective phases.
Be smart.

Decisive moments: breakout of longtime trendchannel or down downAs you can see we have been moving around a longtime trendchannel. Could this the needed outbreak? Or are we close to the end of the uptrend? We will know soon.... Anything could happen now. Don't BELIEVE... just look at the signs!
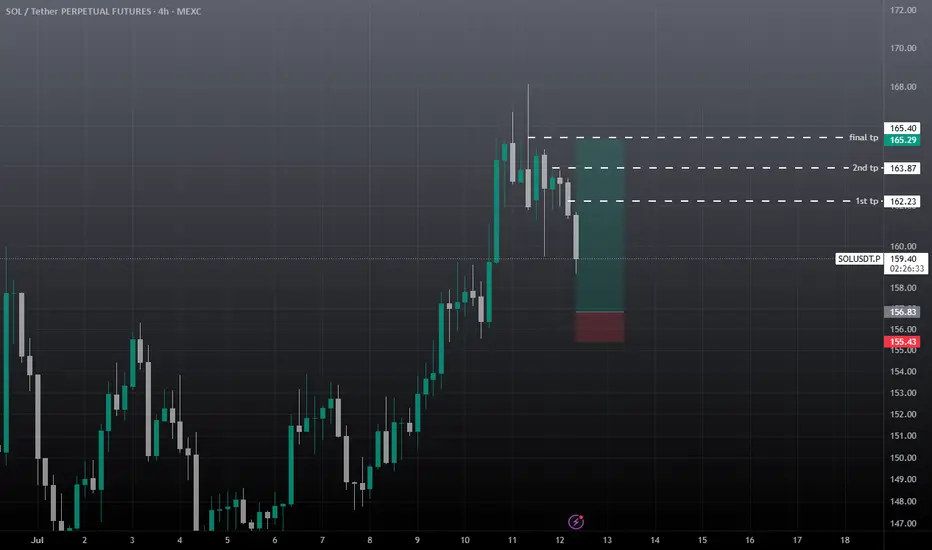
SOL USDT SCALP Long / Buy Setupwait for the entry and then take, as liquidation still lies upside, chances are high that sol will re-visit 164, before any major move to the downside. SL is important on any side. We took good profit on previous SOL short setup.
Notcoin short to $0.002035stop: $0.002181
TP: $0.002035
Roughly 2RR
Market is high and I think its more likely to correct a bi lower before pushing higher

sei scalp short to $0.31 areaJust hopped into a short position on sei. I think the market is high and is likely to correct down tonight.
Stop: $0.3370
Roughly 2RR trade

TRX - Double signal short Wyckoff Up-Trust + PRS Reading the chart (annotations in sync with chat):
1. Largest Up volume wave
3. Resistance Level coming from Daily chart
3. Fast Up Wave (could be fake)
4. Placed AVWAP on fast wave and
5. Our Entry: Double Plutus signal after the retracement Wyckoff Up- Trhust + PRL
Enjoy reading the waves , speed index and Plutus signals.
