BROCCOLI714/USDT Double bottom +WBROCCOLI714 has formed a double bottom and is showing signs of recovery. The price action suggests it’s getting ready to complete the W pattern, which could trigger strong upward momentum.
DCA zone: Green box area for optimal entries
Crypto market

SANDUSDT 1D#SAND is currently trading inside a Falling Wedge on the daily chart.
Let’s see if it can hold the wedge support and bounce from here.
Looking at the bigger picture, it may be forming a Double Bottom.
Just like it broke out of the descending channel in April, we could now see a breakout above the wedge.
⏳ Don’t rush — wait for confirmation before entering.
If a breakout occurs, the potential targets are:
🎯 $0.2539
🎯 $0.2756
🎯 $0.2932
🎯 $0.3107
🎯 $0.3356
🎯 $0.3674
⚠️ As always, use a tight stop-loss and apply proper risk management.

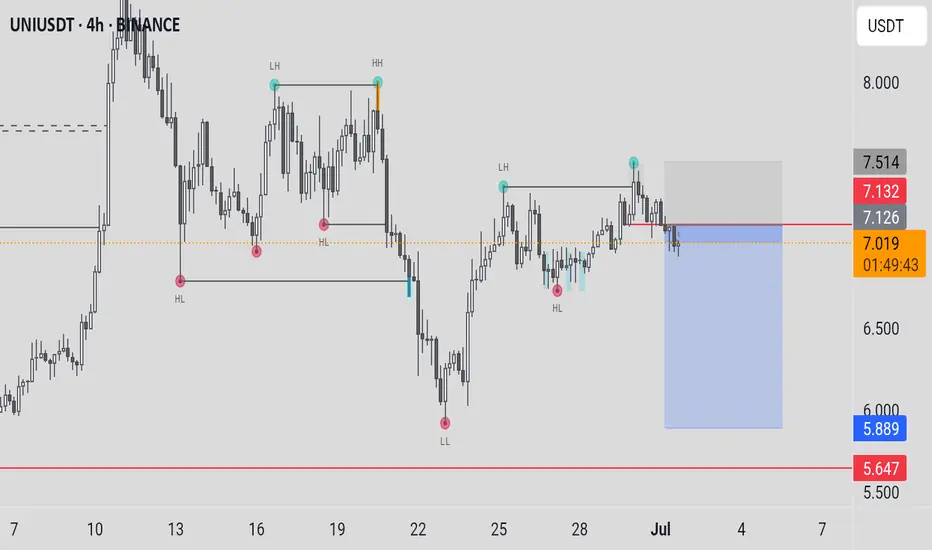
UNIUSDT Cryptocurrency Futures Market Disclaimer 🚨🚨🚨
Trading cryptocurrency futures involves high risks and is not suitable for all investors.
Cryptocurrency prices are highly volatile, which can lead to significant gains or losses in a short period.
Before engaging in crypto futures trading, consider your risk tolerance, experience, and financial situation.
Risk of Loss: You may lose more than your initial capital due to the leveraged nature of futures. You are fully responsible for any losses incurred.
Market Volatility: Crypto prices can fluctuate significantly due to factors such as market sentiment, regulations, or unforeseen events.
Leverage Risk: The use of leverage can amplify profits but also increases the risk of total loss.
Regulatory Uncertainty: Regulations related to cryptocurrencies vary by jurisdiction and may change, affecting the value or legality of trading.
Technical Risks: Platform disruptions, hacking, or technical issues may result in losses.
This information is not financial, investment, or trading advice. Consult a professional financial advisor before making decisions. We are not liable for any losses or damages arising from cryptocurrency futures trading.
Note: Ensure compliance with local regulations regarding cryptocurrency trading in your region.
thanks for like and follow @ydnldn
Q3 Could Be Big for #ETH, Breakout Watch ON#ETH bounced exactly from the 0.5 level of Fib Retracement, as expected.
Now it appears to be gearing up for its next breakout move!
After weeks of chopping inside a falling channel, ETH is showing signs of strength. It's reclaiming key levels and slowly pushing toward the breakout zone near $2,520.
A breakout above this resistance could trigger a sharp move toward $2,880 and beyond.
However, bulls need to hold the $2,300 zone, a drop below might delay the pump.
Structure is bullish, just needs confirmation.
IMO, Q3 could be massive for ETH.
Like & retweet for more updates.
#Ethereum

NFP/USDT double bottomNFP has formed a clear double bottom pattern on the daily time frame, signaling a potential trend reversal. Volume is gradually picking up, indicating growing interest and possible momentum shift.

AI (SPOT ) 15min Time frameBINANCE:AIUSDT
#AI/ USDT
Entry same as chart
SL 15MIN close below (Same as chart)
Target same as chart
_______________________________________________________
Golden Advices.
********************
* collect the coin slowly in the entry range.
* Please calculate your losses before the entry.
* Do not enter any trade you find it not suitable for you.
* No FOMO - No Rush , it is a long journey.

FRD Triggered the daily low. Started to accumulate position but only got gone lot in and it hit the target

#ADAUSDT: Is the crypto hype finally over? ADAUSDT is likely to drop first then it can reverse and continue the bullish move upwards of previous all time high. Before we can confirm any entry on this pair we need strong confirmation which will allow us to predict a correct and accurate swing move.
If you like the work then do consider liking and commenting on the idea.
Team Setupsfx_❤️

AAVEUSDTCryptocurrency Futures Market Disclaimer 🚨🚨🚨
Trading cryptocurrency futures involves high risks and is not suitable for all investors.
Cryptocurrency prices are highly volatile, which can lead to significant gains or losses in a short period.
Before engaging in crypto futures trading, consider your risk tolerance, experience, and financial situation.
Risk of Loss: You may lose more than your initial capital due to the leveraged nature of futures. You are fully responsible for any losses incurred.
Market Volatility: Crypto prices can fluctuate significantly due to factors such as market sentiment, regulations, or unforeseen events.
Leverage Risk: The use of leverage can amplify profits but also increases the risk of total loss.
Regulatory Uncertainty: Regulations related to cryptocurrencies vary by jurisdiction and may change, affecting the value or legality of trading.
Technical Risks: Platform disruptions, hacking, or technical issues may result in losses.
This information is not financial, investment, or trading advice. Consult a professional financial advisor before making decisions. We are not liable for any losses or damages arising from cryptocurrency futures trading.
Note: Ensure compliance with local regulations regarding cryptocurrency trading in your region.
thanks for like and follow @ydnldn

SXT/USDT buy setup SXT, backed by Microsoft, is showing signs of accumulation and gearing up for a potential breakout move toward the key supply zone at $0.15. Momentum is gradually building, and a breakout could trigger a strong rally.
DCA can be considered if price retests lower support levels.

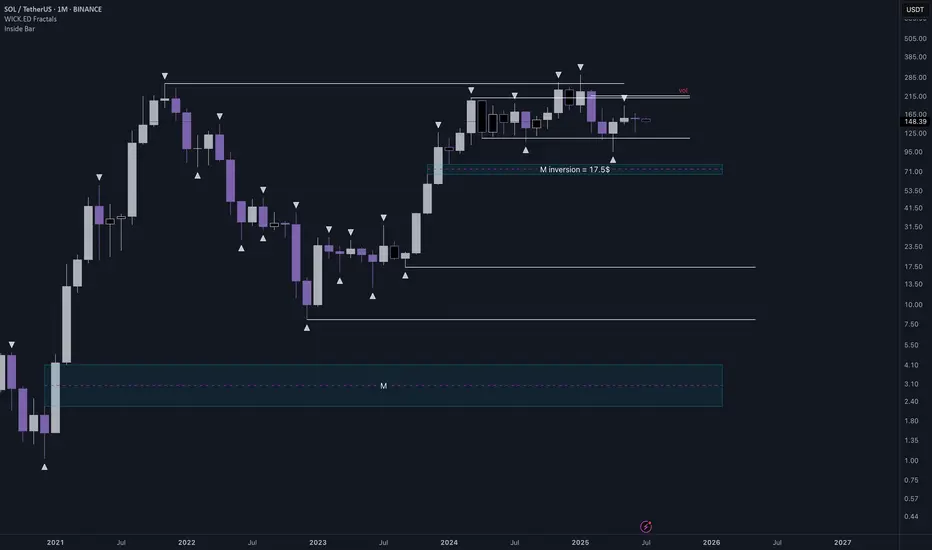
SOLUSDTThere is no confirmation about short scenario yet, but I think we are in distribution phase, so I will wait for short opportunity in 190-220$ zone
News about Solana ETF with staking just give more confidence in such scenario
First target is 80$.
Also we have much lower targets but it is too early to say about them
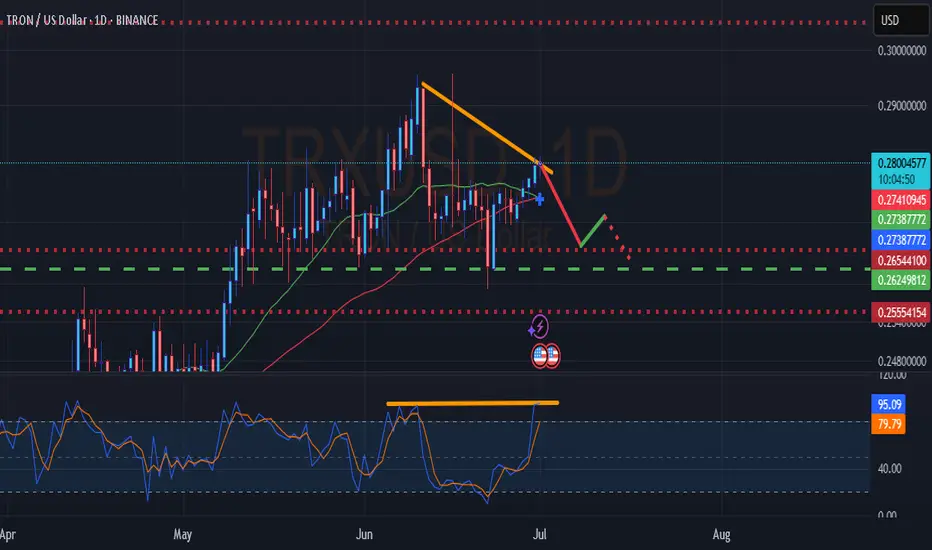
TRX USD Hidden Bearish DivergenceGood day all. TRX puts in hidden bearish divergence. Time to be cautious. Not financial advice. Good luck with your trade.
KAITO | High MindshareKAITO presents a compelling bullish setup as social media attention drives renewed interest in this token. The chart shows a textbook bounce from the ascending trendline support around $1.25, with price now testing the upper consolidation zone.
**Key Technical Points:**
• Clean bounce off multi-month ascending trendline
• RSI recovering from oversold conditions
• Breaking above immediate resistance levels
• Social media buzz providing fundamental catalyst
**Trade Setup:**
• **Entry**: Golden box zone (slight pullback from current levels)
• **Target**: Upper green resistance zone around $1.42-$1.48
• **Stop Loss**: Below $1.20 (trendline violation)
**Risk Management:**
The ascending trendline acts as critical support - any close below $1.20 would invalidate the bullish case. Social media hype can be volatile, so position sizing should account for potential quick reversals. Volume confirmation on any breakout above the consolidation zone would strengthen the bullish thesis significantly.

FUN - one more push leftFUN is doing similar pattern as in 2021 where majority of the bounce up is already done (see blue arrow marks). I expect one more push higher into target range (red box) and from there again correction which if forms a higher low opens path for breakout of triangle pattern and test of March 2021 pivot at 0.06$ range.

Bitcoin Monthly Candle Close colour and patterns since 2011
At the beginning of June , I wrote this
""On only 2 occasions have we had a GREEN JAN, RED FEB, RED MARCH, GREEN APRIL
And Both of them were on the way to ATH. (Boxes )
On both those occasions we also had a GREEN MAY, though the gains were minimal and one was followed by a Green June and the other by a Red June."
We just got the GREEN June and so this draws my eye to the sequence on the left, ( arrow )
If we are to follow this, then July should be a larger Green (Arrow) - BULLISH
In-fact, in both the sequences we have been following ( boxes), July was GREEN- BULLISH
And using just the month candle colours, we have a higher chance of another Green candle, with July having had 9 Green to 4 Red previously. - BULLISH
However
Of the previous 8 Green June Closes , only 3 went to a Green July - BEARISH
And I have to say, on NONE of the previous Green Junes were we so close to the current ATH.
July 2021 being the closest with a price at 41K, around 18K below the current ATH at the time.
We are currently only around 200 usd below Current ATH
This adds enormous resistance to the ability to rise
I wanted a RED June because I felt it was more sustainable and would lead to a cycle ATH at the end of the year. As can be seen in the middle Box
If we look back toward the 2012 Box on the left, we may now get a Hot July / August , September and then a Cool off for October, November & December.
But something tells me this will not happen.
The Candles for our current cycle in April, May and June are diminishing in size, the opposite of 2012
But they are similar to the 2020 box, except for the red June close.
This could lead to the desired "Cooling" in August & September and a new lift off in autumn.
And if you look at the chart Candle Colour Count, , August and September are usually RED by some majority
This also gives us the Bigger Green July candle that the "Odds" point towards.
So, as ever, we have to wait and see how this plays out.
Odds in favour of a Green July using previous cycle Data
PA position just below current ATH could lead to a slightly Bearish out look in the short term.
And if you are hoping to see ALTS Rally, PLEASE keep your eye on the BTC.D chart
This also points to wards BTC ATH in Q4 this year
And then, we have the BIG question.......Will we ever see a Classix Bear again ?
With so many Holding Bitcoin LongTerm.....How would a Bear market arrive ?
BUY BITCOIN
HOLD BITCOIN
But, as ever, we just have to wait and see,

Bitcoin - The Silent Ascent of Under Institutional Custody.⊢
⟁ BTC/USD – BINANCE – (CHART: 1W) – (Date: July 01, 2025).
◇ Analysis Price: $106,464.00.
⊢
⨀ I. Temporal Axis – Strategic Interval – (1W):
▦ EMA21 – ($98,213.17):
∴ The EMA21 has provided dynamic mid-term support since early Q4 2024;
∴ Recent pullbacks respected the line precisely, confirming its role as tactical trend anchor.
✴ Conclusion: Tactical bullish posture maintained. Rejection above EMA21 signals controlled bullish continuation.
⊢
▦ Week Moving Average 200WMA – ($60,425.78):
∴ The 200WMA continues its upward ascent, now surpassing the symbolic $60k level;
∴ Price remains structurally elevated, approximately 76% above the WMA baseline, marking a strong long-term cycle support.
✴ Conclusion: Structurally bullish. The 200WMA acts as a deep support; no signs of cyclical exhaustion.
⊢
▦ Volume + MA21:
∴ Volume remains within normal bounds, with no explosive or capitulative behavior;
∴ The 21-week average volume shows steadiness, confirming institutional absorption rather than speculative frenzy.
✴ Conclusion: Price action is supported by consistent volume. There is conviction, not hype.
⊢
▦ RSI + EMA21 – (RSI: 61.01 | EMA: 60.00):
∴ RSI remains stable above the 60-threshold, traditionally a bull-control zone;
∴ The EMA21 on RSI sits just beneath it, reflecting sustainable momentum without overheating.
✴ Conclusion: Momentum is alive and consistent. Pressure is not euphoric, but persistently positive.
⊢
▦ Mayer Multiple – (1.11):
∴ The current Mayer Multiple (Price ÷ 200WMA) is at 1.11, far below critical cyclical warning zones;
∴ Historical peaks formed above 2.4–3.2×, placing current readings in neutral-to-accumulative territory.
✴ Conclusion: No signs of macro-top formation. Room for expansion remains open within cycle structure.
⊢
🜎 Strategic Insight – Technical Oracle:
∴ Bitcoin maintains an elevated stance above all major structural supports;
∴ No indicators suggest euphoric excess or terminal cycle behavior;
∴ Momentum, structure, and volume all reflect the essence of a mature but breathing bull cycle, silently advancing.
⊢
∫ II. On-Chain Intelligence – (Source: CryptoQuant):
▦ MVRV Ratio – (2.22):
∴ The current MVRV remains below the historical danger zone of >2.5;
∴ Price is elevated, but not euphoric - reflective of controlled structural ascent.
✴ Conclusion: BTC sits in the upper-middle band of valuation. No top formation indicated, but vigilance required.
⊢
▦ Exchange Reserve – (All Exchanges – 2.4M BTC (new low):
∴ Continuous decline in BTC held on exchanges since Q4 2022;
∴ Signals that coins are being withdrawn to self-custody – typical of conviction-based accumulation.
✴ Conclusion: Supply is drying from trading venues. This is fundamentally bullish and reduces short-term dump risk.
⊢
▦ Realized Cap – ($958B):
∴ The realized capitalization is climbing in tandem with price - without flattening or divergence;
∴ Indicates strong inflow of high-conviction capital setting new cost-bases.
✴ Conclusion: Market is absorbing price increases via real buyer interest. Structural support is being rebuilt at higher levels.
⊢
▦ Short-Term Holder Realized Price & Profit/Loss Margin:
∴ Profit margins are rising but remain beneath the historical 70% “euphoria line;”
∴ No extreme deviation between spot price and realized price.
✴ Conclusion: Profit-taking is occurring in equilibrium. No signs of unsustainable speculation.
⊢
▦ Spent Output Profit Ratio – (SOPR - 1.036):
∴ Values above 1 indicate net selling at a profit;
∴ However, the ratio is stable and modest – no spike.
✴ Conclusion: Profitable selling is active, but not excessive. Market is cycling profits without panic or climax.
⊢
▦ Stablecoin Supply Ratio - (SSR – 17.6):
∴ A high SSR means fewer stablecoins relative to BTC -> lower immediate buy-side liquidity;
∴ This aligns with observed euro-stablecoin inflows and USD retreat.
✴ Conclusion: Bitcoin price is rising without massive stablecoin inflow. Potential for future upside if SSR compresses.
⊢
🜎 Strategic Insight – On-Chain Oracle:
∴ All six indicators converge on a structurally bullish;
∴ Tactically stable market;
∴ There is no evidence of blow-off top, exhaustion, or manic distribution;
∴ Supply is retreating, valuation rising moderately, and profit cycles remain rational.
⊢
⧉ III. Contextvs Macro–Geopoliticvs – Interflux Economicvs:
▦ Macro-Structural Narrative:
∴ Bitcoin closed Q2 2025 with a +29.9% quarterly gain - (source: CryptoRank);
∴ The rally is attributed to growing institutional adoption, bolstered by pro-Bitcoin policies of the Trump administration, including treasury-on-chain initiatives;
∴ Macroeconomic tension around trade wars has eased, fueling upward movement in both BTC and the S&P 500, signaling synchronized risk-on appetite - (source: Coindesk).
✴ Conclusion: The quarterly momentum reflects fundamental confidence, not speculative heat, Bitcoin is tracking macro cycles and policy favorability - not detaching from economic logic.
⊢
▦ Liquidity Rotation Signal:
∴ While BTC saw a record monthly close above $106K in June, attention turned to the Euro, which surged ~4%, outperforming Bitcoin ~2.5% monthly gain - (source: Coindesk);
∴ This signals capital movement out of the USD and into alternative monetary zones, including euro-pegged stablecoins, highlighting a shift in liquidity strategy.
✴ Conclusion: Bitcoin performance remains strong, but stablecoin flows suggest hedging against USD, and potential cross-currency dynamics now influence crypto markets more than in past cycles.
⊢
▦ Institutional Absorption:
∴ Q2 2025 marked multiple treasury-scale Bitcoin purchases, the most notable was Strategy Inc.’s addition of $531 million in Bitcoin;
∴ Coindesk reports increasing movement of aged coins, suggesting long-term holders are realizing profit selectively, not exiting fully;
∴ Realized on-chain gains estimated around $2.4 billion, but SOPR and STH-P/L data show no speculative frenzy.
✴ Conclusion: Institutional reaccumulation is active - distribution is rational, not euphoric, the market is cycling profits, not dissolving conviction.
⊢
▦ Sentiment & Policy Alignment:
∴ Trump’s active endorsement of Bitcoin as a "strategic reserve instrument" has galvanized corporate treasuries and conservative capital;
∴ Policy signals from the U.S. now mirror early El Salvador-like rhetoric but on a scaled geopolitical stage;
∴ Meanwhile, legislative friction in the EU is softening, with euro-stablecoin flows confirming multi-jurisdictional bullish alignment.
✴ Conclusion: Bitcoin is evolving from speculative asset into a political-economic monetary instrument. Its adoption curve is now influenced by state-level policy vectors, not just market actors.
⊢
⧈ Synthesis – Silent Codex Verdict:
∴ Bitcoin’s Q2 expansion is rooted in structural convergence: (policy + macro easing + institutional inflows + on-chain discipline);
∴ The asset is not overheated, and continues to mature within a globalized, politically aware framework;
∴ The cycle breathes silently, with strength.
⊢
⌘ Codicillus Silentii – Strategic Note:
∴ Resistance remains near $110K–112K, region of monthly closure highs;
∴ EMA21 at $98K defines tactical floor - breach would signify shift in short-term conviction;
∴ SSR at 17.6 suggests temporary stablecoin dryness, delaying momentum ignition.
✴ Conclusion: Tactical posture is consolidative, awaiting macro or capital inflow catalyst.
Upside remains open, but not yet inevitable.
⊢
𓂀 Stoic-Structural Interpretation:
∴ Structurally Bullish – (Tactically Controlled);
∴ Bitcoin maintains long-term structural dominance, anchored above the 200WMA and supported by rising Realized Cap and exchange outflows;
∴ The RSI + EMA21 structure confirms active but non-euphoric momentum;
∴ MVRV at 2.22 and SOPR at 1.03 reflect profitable cycling, not late-stage irrationality;
∴ No blow-off volume or destabilizing divergence across timeframes.
✴ Conclusion: Bitcoin is in mid-cycle ascension, exhibiting maturity, discipline, and policy-aligned backing. The structural bullish thesis is intact.
⊢
⧉
⚜️ Magister Arcanvm – Vox Primordialis!
𓂀 Wisdom begins in silence. Precision unfolds in strategy.
⧉
⊢

BCH | Long-Term Bullish StructureBitcoin Cash presents an attractive long-term bullish structure with multiple technical confluences suggesting higher prices ahead. The patient approach of waiting for the VWAP retest provides optimal entry conditions for this long-term bullish thesis, rather than chasing current elevated prices.
Technical Analysis:
Strong support zone holding at $303.62 with multiple successful tests
365-day VWAP trending upward around $400-420, acting as dynamic support
Descending resistance from previous highs being challenged
Entry Strategy:
Traders should wait for a pullback to the 365-day VWAP ($400-420 zone) before entering long
positions.
This approach offers:
Better risk/reward ratio
Clear stop placement below major support at $300
Entry at a proven dynamic support level
Key Levels:
Entry: $400-420 (VWAP pullback)
Stop: Below $300 support
Target: Above descending trendline toward $600+

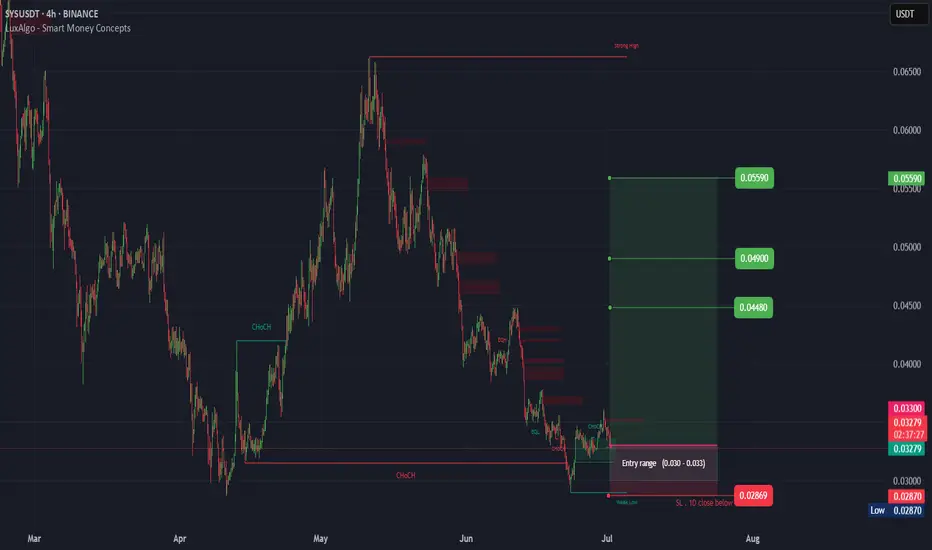
SYS (SPOT)BINANCE:SYSUSDT
#SYS/ USDT
Entry( 0.030- 0.033)
SL 1D close below 0.02869
T1 0.04480
T2 0.04900
T3 0.05900
_______________________________________________________
Golden Advices.
********************
* collect the coin slowly in the entry range.
* Please calculate your losses before the entry.
* Do not enter any trade you find it not suitable for you.
* No FOMO - No Rush , it is a long journey.
ETHUSD coiling pattern breakout support at 2170.Trend Overview:
ETHUSD remains in a bullish trend, characterised by higher highs and higher lows. The recent intraday price action is forming a continuation consolidation pattern, suggesting a potential pause before a renewed move higher.
Key Technical Levels:
Support: 2,170 (primary pivot), followed by 2,080 and 1,980
Resistance: 2,610 (initial), then 2,800 and 2.920
Technical Outlook:
A pullback to the 2,170 level, which aligns with the previous consolidation zone, could act as a platform for renewed buying interest. A confirmed bounce from this support may trigger a continuation toward the next resistance levels at 2,610, 2,800, and ultimately 2,920.
Conversely, a daily close below 2,170 would suggest weakening bullish momentum. This scenario would shift the bias to bearish in the short term, potentially targeting 2.080 and 1,980 as downside levels.
Conclusion:
ETHUSD maintains a bullish structure while trading above the 2,170 support. A bounce from this level would validate the consolidation as a continuation pattern, with upside potential toward the 2,610 area. A breakdown below 2,170, however, would invalidate this view and suggest deeper corrective risk.
This communication is for informational purposes only and should not be viewed as any form of recommendation as to a particular course of action or as investment advice. It is not intended as an offer or solicitation for the purchase or sale of any financial instrument or as an official confirmation of any transaction. Opinions, estimates and assumptions expressed herein are made as of the date of this communication and are subject to change without notice. This communication has been prepared based upon information, including market prices, data and other information, believed to be reliable; however, Trade Nation does not warrant its completeness or accuracy. All market prices and market data contained in or attached to this communication are indicative and subject to change without notice.

Master the Trio => to Level Up Your Trading🧠Most traders obsess over chart patterns and price action—but lasting success comes from mastering three pillars together:
Technical Analysis. Risk Management. Trading Psychology.
Miss one, and the structure collapses.
Let’s dive into each one, and see how they work together like a high-performance trading engine:
📈 1. Technical Analysis – Think in Layers, Not Lines
Most traders draw lines. Great traders read behavior.
Instead of asking “Is this support holding?”, ask “Why would smart money defend this level?”
Markets aren’t driven by lines—they’re driven by liquidity, trapped traders, and imbalances. That’s why:
A fakeout isn’t failure—it’s often a feature.
A breakout isn’t a buy signal—it’s bait.
Trendlines aren’t magic—they’re just visualizations of collective bias.
🔍 Advanced tip: When analyzing a chart, map out:
Where liquidity is resting (above equal highs/lows, tight consolidations)
Who’s likely trapped (late buyers at resistance, early sellers during accumulation)
Where the market must not go if your bias is correct (invalidations)
The real edge? Seeing the chart as a battle of intentions, not just candles.
🛡️ 2. Risk Management – Your License to Play the Game
Every trade is a bet. But without proper risk, it’s a gamble.
Risk management isn’t just about stop losses—it’s about position sizing, asymmetry, and survival.
I risk no more than 1% per trade , regardless of conviction.
I aim for 2R minimum —because even with a 50% win rate, I still grow.
I define my invalidation before I enter, never after.
You can’t control the outcome, but you can control your exposure. That’s professional.
🧠 3. Trading Psychology – Where Most Traders Break
You can have the perfect setup and smart risk, but still sabotage yourself.
Why? Because emotion overrides logic —especially when money is on the line.
Ever moved your stop? Chased a candle? Closed a trade too early, only to see it hit your TP later?
That’s not lack of skill—it’s lack of emotional discipline.
What works for me:
Journaling every trade—not just the result, but how I felt
Practicing “sit tight” discipline after entries
Reminding myself that no single trade matters—only the process does
You don’t trade the chart—you trade your beliefs about the chart. Master yourself first.
🔄 Final Thoughts
Trading isn’t just about entries.
It’s a mental game played on financial charts, where edge lies in understanding market mechanics, protecting capital, and staying emotionally grounded.
TA shows you the “what”
Risk shows you the “how much”
Psychology decides the “how well”
Master all three—and you’ll separate yourself from 95% of traders.
💬 Which of the three is your strongest? And which one needs more work?
Let’s grow together—drop your thoughts in the comments 👇
All Strategies Are Good; If Managed Properly!
~Richard Nasr

AERO | Waiting for a Higher LowThe setup favors patient entry on any pullback that forms a higher low, confirming the bullish momentum while minimizing downside risk.
Entry Strategy:
• Wait for higher low confirmation
• Validates uptrend continuation
• Better risk/reward positioning
Bullish Signals:
• RSI reset from oversold levels
• Clear accumulation base formed
• Breaking out of consolidation range
Risk Management:
• Stop below $0.493 support
• Invalidation if price fails to hold current levels
• Breakout above $0.80 accelerates move
• Target Zone: $1.50 resistance area

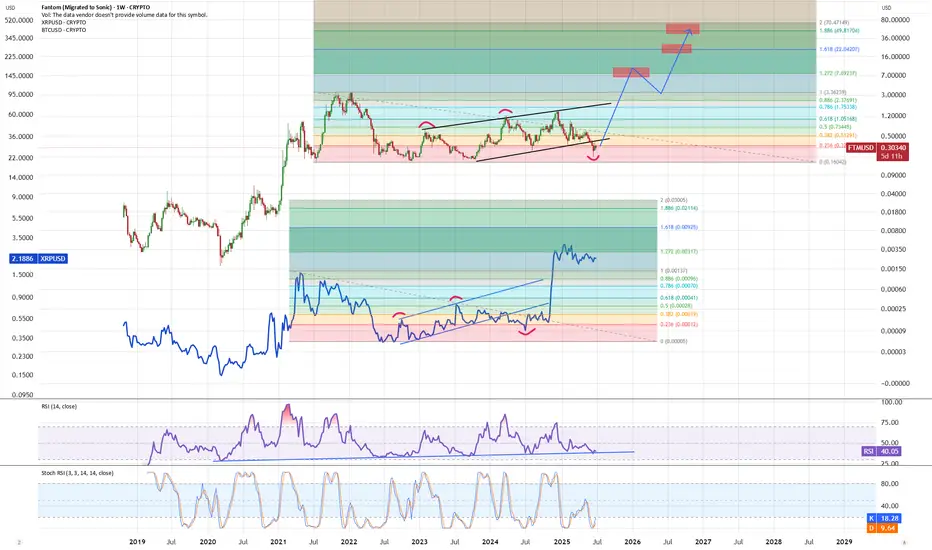
FTM - time to fly...FTM is sitting at major RSI support line and has done same pattern as XRP before it pumped up. It also did last capitulation dip, from here on no new lows allowed! Expecting push back up into the channel and then blast toward new ATH - fibb 1.272 being likely 1st target before bigger correction which should flip current ATH level into support. After that one last push higher for blowoff top to complete this cycyle....
BTCUSD Bullish sideways consolidation supported at 101.780Trend Overview:
BTCUSD remains in a bullish trend, characterised by higher highs and higher lows. The recent intraday price action is forming a continuation consolidation pattern, suggesting a potential pause before a renewed move higher.
Key Technical Levels:
Support: 101,780 (primary pivot), followed by 100,380 and 98,184
Resistance: 109,170 (initial), then 111,600 and 114.140
Technical Outlook:
A pullback to the 101,780 level, which aligns with the previous consolidation zone, could act as a platform for renewed buying interest. A confirmed bounce from this support may trigger a continuation toward the next resistance levels at 109,170, 111,600, and ultimately 114,140.
Conversely, a daily close below 101,780 would suggest weakening bullish momentum. This scenario would shift the bias to bearish in the short term, potentially targeting 100.390 and 98,180 as downside levels.
Conclusion:
BTCUSD maintains a bullish structure while trading above the 101,780 support. A bounce from this level would validate the consolidation as a continuation pattern, with upside potential toward the 109,170 area. A breakdown below 101,780, however, would invalidate this view and suggest deeper corrective risk.
This communication is for informational purposes only and should not be viewed as any form of recommendation as to a particular course of action or as investment advice. It is not intended as an offer or solicitation for the purchase or sale of any financial instrument or as an official confirmation of any transaction. Opinions, estimates and assumptions expressed herein are made as of the date of this communication and are subject to change without notice. This communication has been prepared based upon information, including market prices, data and other information, believed to be reliable; however, Trade Nation does not warrant its completeness or accuracy. All market prices and market data contained in or attached to this communication are indicative and subject to change without notice.
