OBOL $0.15 as soon as possibleHello,
I think Obol pump as soon as possible and very fast price go to the $0.15 and more.
The total tokens in circulation are less than 100 million, but volumes above 200 million on a particular exchange are unusual and indicate a price manipulation that is caused by lowering the price and collecting tokens on other exchanges.
You can buy on other exchanges and transfer to your wallet and expect a pump and profit of over 300%.
What do you think?
Thank you
Crypto market

BTC Live: Resistance 111592/ Breakout soon or 109440 first?In this short video breakdown, we reviewed some key structural levels. We've identified a resistance at 111.592, which is critical for near-term price action. However, zooming out to the bigger picture, the major resistance to watch sits at 114.921 — this is a level we’ve respected many times before and could act as the next big test if momentum continues upward.
On the support side, we've previously leaned on 109.079, and we're now observing strong confluence zones thanks to our Fibonacci pull — notably around 110.505, lining up with the 0.61 and 0.5 retracement levels.
What we’re seeing is an ascending channel in play. If we break and hold above 111.592, that opens the door to challenge the 114.900 level. Until then, price might need to consolidate or retest some of these key supports.
Always worth checking past ideas to see how significant some of these zones have been historically. This wasn’t a fakeout — just part of the bigger structure.
Are you watching the same levels? Let me know your setups — it's always great to see different perspectives in the community.
One Love,
The FXPROFESSOR 💙
Disclosure: I am happy to be part of the Trade Nation's Influencer program and receive a monthly fee for using their TradingView charts in my analysis. Awesome broker, where the trader really comes first! 🌟🤝📈

LINK/USDT (Chainlink to Tether) from the 4H interval⚡️ Technical situation – quick overview
✅ Breakout from the descending channel (purple lines)
✅ Resistance zone 14.42 – currently being tested
✅ Target within the breakout range – around 17.73 USDT
⚠️ Stochastic RSI in the overbought zone – local correction possible
🟪 Descending channel – broken!
The descending channel that has been in place since mid-May has been broken upwards.
Such breakouts often signal a change in the local trend.
Theoretical range of movement = channel height (~3.30 USDT) added to the breakout point (around 14.42) = ~17.73 USDT – perfectly aligned with your resistance level.
🟢 Key Resistance Levels (green):
Level Meaning
14.42 USDT Current tested resistance – psychologically significant
15.65 USDT Local high + June price gap
17.73 USDT Potential target after a breakout – range from the formation
🔴 Support Levels (red):
Level Meaning
12.73 USDT Support from the pre-breakout consolidation
11.91 USDT Key defensive level of the uptrend
11.07 / 10.12 USDT Historical support with strong demand reactions
📉 Stochastic RSI (oscillator):
Currently deep in the overbought zone (above 80).
This may indicate local exhaustion of momentum and a short correction before further upward movement.
However: in strong trends, the RSI may remain high for an extended period – it does not automatically provide a sell signal.
📈 Bullish scenario:
Retest of the 14.42 level as support → confirmation of the breakout
Then a move towards:
15.65 – local stop
17.73 – final target from the channel breakout
🟩 Stop-loss: e.g., below 12.73 USDT (loss of key support)
📉 Bearish scenario:
False breakout and decline below 14.42
Loss of the 12.73 level → possible quick decline to 11.91–11.07
🔴 In this case, a new swing low could open the way to 10.12 USDT.
📌 Summary:
Element Rating
Technical Pattern ✅ Breakout from a descending channel (bullish signal)
Current Level ❗ Test of Key Resistance – Decision Point
RSI (Momentum) ⚠️ Overbought – Correction Possible
Upside Potential (Target) 📈 17.73 USDT
Threat ❌ False breakout and return to below 12.73 USDT
🧠 My suggestion (not investment advice):
Observe the price reaction at 14.42 – if it holds above and consolidation forms → a signal to continue.
If the 4H/1D candle closes below, consider caution, as this could be a bull trap.

AVAX Possible scenarioAVAX is currently in a downtrend and has approached a key support zone. Price action has formed a bearish flag pattern, suggesting a continuation of the prevailing trend. The market is currently in a correction phase within this flag.
If the support fails and the pattern breaks to the downside, AVAX may slide toward the next bearish target around $14.
However, if the resistance of the flag is broken to the upside, it would invalidate the bearish setup and could shift momentum toward a recovery, with a potential move toward $22.5 as the first bullish target.
Let’s monitor how the price reacts near the edges of this pattern to assess whether continuation or reversal plays out.

EGLDMultiversX
Egld usdt Daily analysis
Risk rewards ratio >2.2 👈👌
Pattern = two bottoms
First target =21.3$

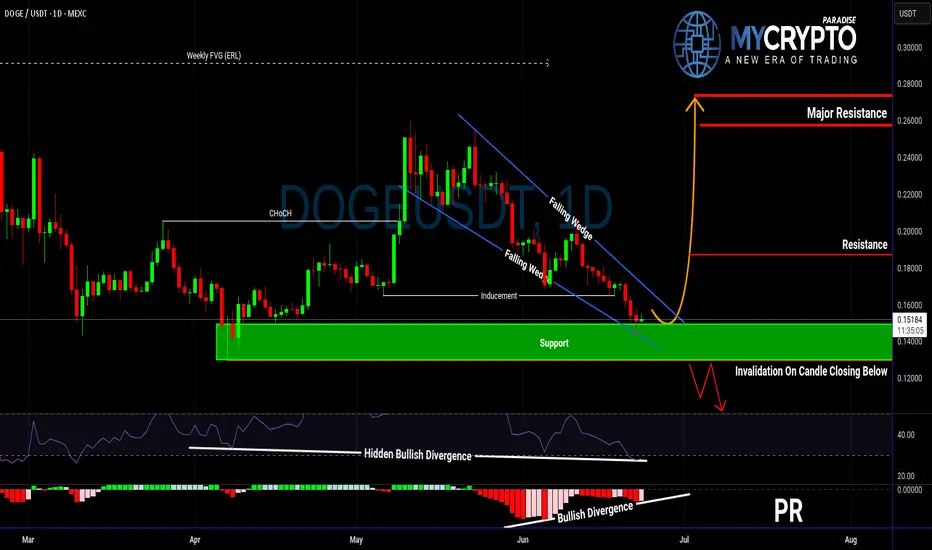
Is DOGE About to Explode or Collapse?Yello Paradisers! Are you ready for what could be DOGE’s most explosive move in weeks? DOGEUSDT is currently developing a very interesting bullish setup that deserves attention.
💎The pair has formed a falling wedge — a pattern that often precedes a breakout to the upside. This comes right after a confirmed bullish Change of Character (CHoCH), indicating that buyers are quietly stepping back in.
💎Even more important, we’ve seen a classic inducement grab, meaning early liquidity has been taken out, clearing the way for a potential real move. On top of that, there’s hidden bullish divergence on the RSI and clear bullish divergence on the MACD. This combination of signals significantly increases the probability of a bullish reversal from the current support zone.
💎If DOGE prints a convincing bullish candlestick pattern at these levels, it could offer a high-probability long opportunity with a strong risk-to-reward ratio. But be careful — if the price breaksdown and closes candle below this key support, the bullish scenario becomes invalid, and it’s better to wait for a more favorable structure to develop.
Strive for consistency, not quick profits. Treat the market as a businessman, not as a gambler. This is the only way you will make it far in your crypto trading journey. Be a PRO.
MyCryptoParadise
iFeel the success🌴
Ethereum / U.S. Dollar 4-Hour Chart (BINANCE)4-hour candlestick chart displays the price movement of Ethereum (ETH) against the U.S. Dollar (USD) on the BINANCE exchange. The current price is $2,740.99, reflecting a +$124.74 increase (+4.77%) in the last period. The chart includes a buy/sell indicator with no current activity (0.00), a resistance zone highlighted in pink, and a support zone in light green. The price has recently surged, breaking through the $2,740.99 level, with additional price points ranging from $2,400.00 to $2,949.06 shown on the right axis. The time frame spans from late June to July 10, 2025.
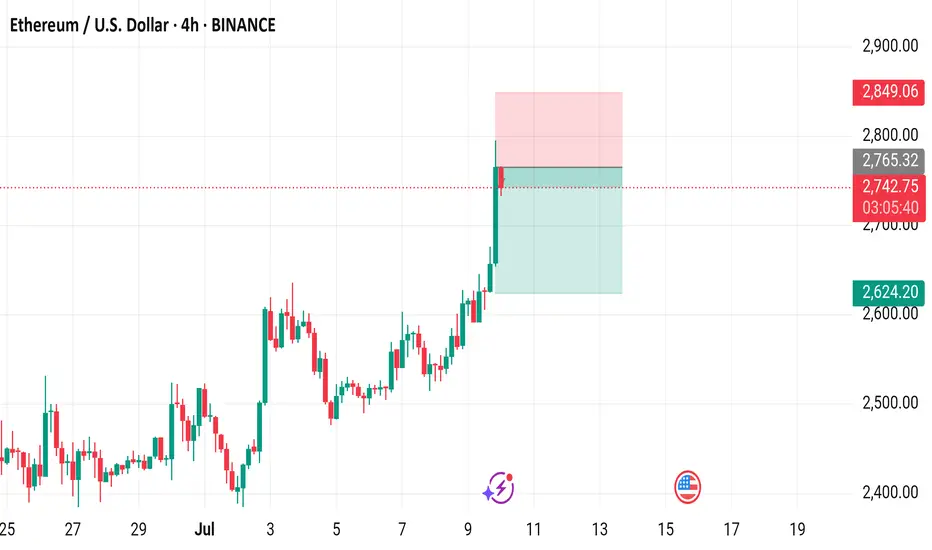
Congratulations to those of us that took this trade we just hit Congratulations to those of us that took this trade we just hit take profit now

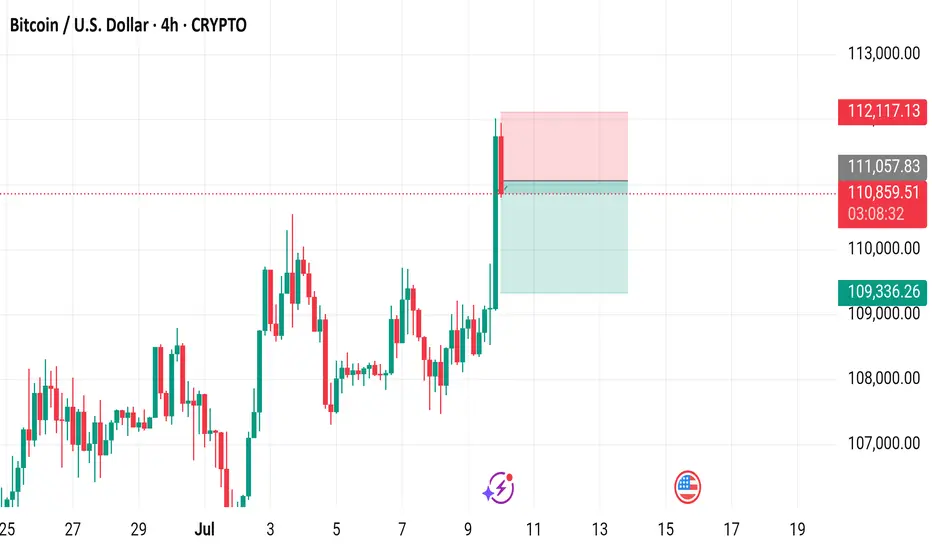
Bitcoin / U.S. Dollar 4-Hour Chart - CRYPTO4-hour candlestick chart displays the price movement of Bitcoin (BTC) against the U.S. Dollar (USD) from late June to mid-July 2025. The current price is $110,838.12, reflecting a 1.75% increase (+$1,908.56). The chart highlights a recent significant upward movement, with a notable green candlestick indicating a strong buying trend. Key price levels include a support zone around $109,336.26 and resistance near $112,117.13. The chart also shows buy and sell options at the current price level of $110,838.11.
Buy Trade Strategy for PEPE: Riding Meme Culture and Market HypeDescription:
This trading idea focuses on PEPE, a meme-based cryptocurrency that has quickly captured the attention of the crypto community. Inspired by internet culture and designed to harness the viral power of memes, PEPE has benefited from massive online engagement, rapid trading volume growth, and strong community-driven momentum. While it may not offer traditional utility like other tokens, its success lies in speculation, visibility, and the strength of its digital identity — characteristics that have driven short-term rallies in similar tokens like DOGE and SHIBA.
Nonetheless, it's important to understand that meme coins like PEPE are highly speculative and volatile. Their prices are heavily influenced by social media trends, influencer activity, and general market sentiment, rather than long-term fundamentals or real-world utility. Therefore, while potential gains can be attractive, the risks are equally significant and require careful consideration.
Disclaimer:
This trading idea is for educational purposes only and should not be taken as financial advice. Cryptocurrencies — particularly meme coins like PEPE — involve a high level of risk, including the possible loss of your entire investment. Always conduct your own research, evaluate your financial situation, and speak to a licensed financial advisor before making any trading decisions. Past performance is not a guarantee of future results.

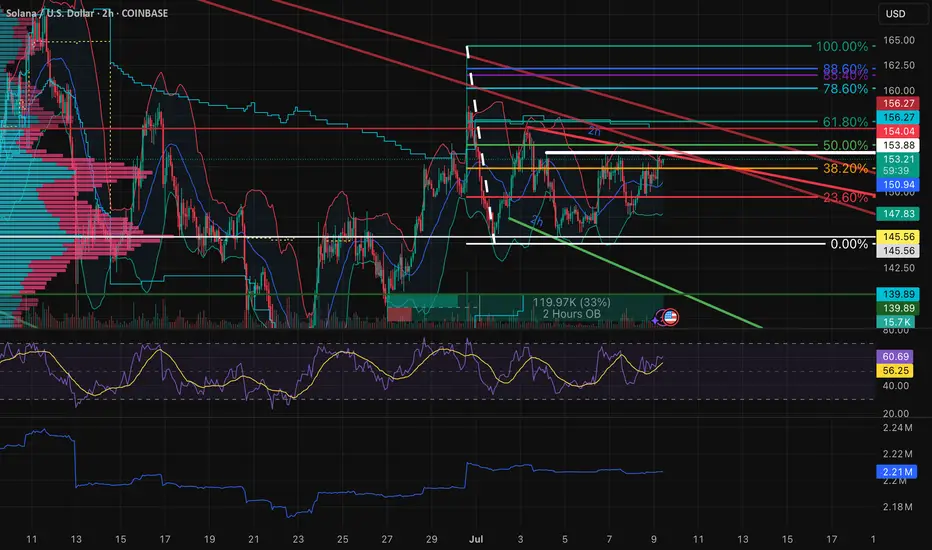
$SOL | Triple Top or Launchpad?Macro to Micro Context:
SOL is now testing a third rejection in the upper 153s, forming a textbook triple top just under a multi-month descending trendline and major Fib resistance. This ceiling has held firm since late June, despite higher lows grinding up from below. Price is now squeezed tightly between compressing demand and stacked supply, with volatility contraction apparent across the board.
The structure is coiling hard but momentum and volume must confirm resolution before positioning aggressively.
Structural & Momentum Breakdown:
Resistance Layering (Reinforced):
Triple Top: Price has repeatedly failed to break above the upper 153s.
Fib Overlap: 50%–61.8% retracement range aligns with both trendline resistance and OB stack.
Order Block Stack: Resistance from mid-153s to low-154s is now reinforced across timeframes (30M → Daily).
Momentum Shifts:
RSI Divergence: Lower highs on RSI across 2H/1H, despite flat or slightly higher price.
PVT Flattening: No fresh accumulation during recent tests.
Volume Decline: Progressive volume deterioration on each retest distributional tone building.
Demand Shelf:
Key demand and support range from low-150s to mid-151s has held through three separate dips.
This is the immediate pivot zone — lose it and vacuum effect likely down into the upper 140s.
Updated Trade Plan:
Rejection Short Setup:
Entry: Breakdown through mid-151s with confirming sell volume.
Stop: Above low-154s to account for potential deviation wicks.
TP1: Upper 148s (first OB cluster).
TP2: Mid-146s (Fib + minor support).
TP3: Low 140s (macro demand + wedge base).
Bear Confirmation: RSI breakdown + volume expansion + OB flips into resistance.
Breakout Setup (Only on Clear Validation):
Entry: Strong candle close above low-154s with breakout volume.
Stop: Below low-151s — invalidation of reclaim.
TP1: Upper 157s (Fib zone).
TP2: Low 160s (swing high area).
TP3: Upper 160s (macro breakout expansion).
Bull Confirmation: RSI > 62 on 2H, strong PVT rise, and flip of local OB into demand.
Risk Warning:
Triple tops near macro resistance are high-risk unless clearly broken. This zone is overloaded with historical rejection. Don't front-run the breakout — volume will show you who's in control.
Closing Thoughts:
With a confirmed triple top now visible, SOL is facing its most important rejection zone in weeks. Bulls must reclaim with strength or this becomes a clean setup for rotation into the mid to low 140s. Patience and confirmation are key here. Keep risk asymmetric.
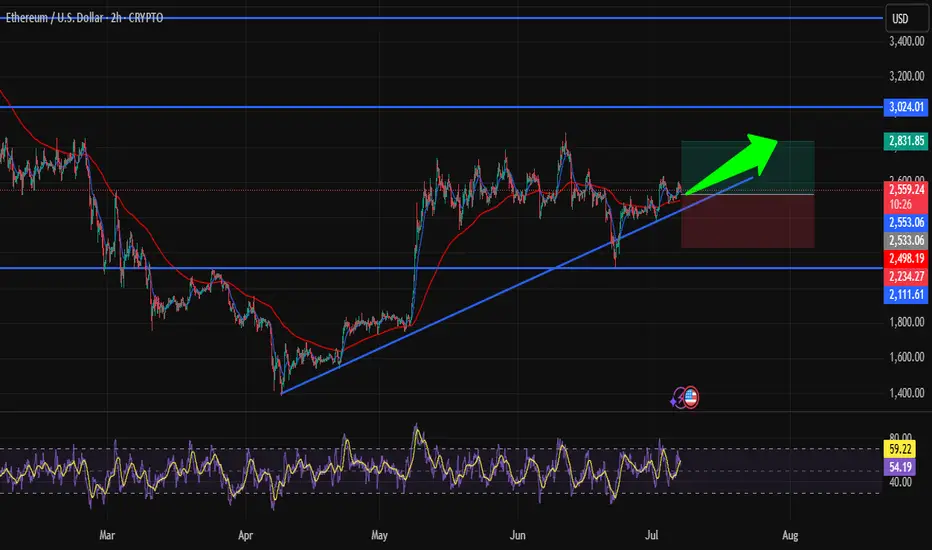
Is ETH Heading to $2800? Strategic Entry in Bullish TrendHi traders! , Analyzing ETH/USD on the 2H timeframe, price is respecting an ascending trendline and showing signs of continuation within the bullish structure:
🔹 Entry: 2555
🔹 Take Profit : 2831
🔹 Stop Loss : 2234
After consolidating above key support and retesting the ascending trendline, ETH is showing potential for a bullish continuation. The recent bounce is forming higher lows, and price remains above the 50 EMA, suggesting buyers are maintaining control.
RSI is currently turning upward from the mid-zone, signaling growing bullish momentum while still avoiding overbought conditions. The trendline has been respected several times, adding confluence to the setup.
If momentum holds, the TP around 2831 lines up with a significant resistance area from previous structure — a logical zone for price to reach in the short term.
⚠️ DISCLAIMER: This is not financial advice. Every trader is responsible for managing their own risk and strategy.
Bitcoin on Fire: Targeting $110K in Relentless Uptrend!Hi traders! , Analyzing BTC/USD on the 30 minute timeframe, price is currently respecting an upward channel and showing consistent higher highs and higher lows. The recent bounce from dynamic support suggests bullish continuation.
🔹 Entry: 109,545
🔹 Take Profit (TP): 110,612
🔹 Stop Loss (SL): 108,438
Price is trading above both the 50 and 200 EMA, confirming bullish momentum. The RSI remains above the midline, indicating buyers are still in control. This long setup offers a favorable risk-reward ratio within the context of the broader uptrend.
A confirmed breakout from the short-term resistance, combined with trendline support and channel structure, adds confluence to this idea. Watch for potential resistance near the 110,612 zone.
⚠️ DISCLAIMER: This is not financial advice. Every trader is responsible for their own decisions and risk management.

BTC/USDT Technical Analysis, 2025-07-07 11:30 UTC📊 BTC/USDT Technical Analysis, 2025-07-07 11:30 UTC
🕒 Binance Spot
📆 July 7, 2025 | 11:30 GMT Candle Observations
───────────────
💡 Price: 108712.97 USDT
📉 EMA200 (Dynamic): 108938.31
🟩 Support Watch: 107512.97
🟦 Resistance Target: 109782.97
───────────────
🔍 We're observing price action developing below EMA200, with a recent Piercing Line formation at a noted dip zone. This setup may suggest buyers are attempting to reclaim short-term control.
⚠️ Key tactical support remains near 107512.97, where historical reaction zones and liquidity zones intersect.
📈 A move toward 109782.97 is being monitored as a potential resistance test, in line with local OBV divergence and recovering bid pressure.
📌 Market Microstructure Notes:
• Order Book Imbalance leaning toward bids (+0.45)
• OBV Trend: +10.17% vs 5-period MA
• Thunder Engine Volume Acceleration: ⚡ Observed
• Whale Ask Cluster: ~640k USDT near top of range
📉 No guarantees of breakout or reversal watching how price reacts around key levels. Maintain cautious positioning near support/resistance pivots.

RAYUSDT 1D#RAY is breaking out above the descending resistance and the SMA100 on the daily chart.
If the daily candle closes above the descending resistance, the short-term targets are:
🎯 $2.993
🎯 $3.954
Mid-term targets:
🎯 $4.747
🎯 $5.539
🎯 $6.668
🎯 $8.105
⚠️ As always, use a tight stop-loss and apply proper risk management.

Potential 30% move in QIUSDAs can be seen, there is a double bottom that has formed in QIUSD. Also, Data Distribution has shown that the crypto coin is too overextended to the downside which means that it is primed for a reversal. Zero-Lag USI has shown the change of background to green which shows that it is time to enter.

BTC MTF AccumulationThis is the current accumulation model i am watching to bring BTC back to ATH's and form the second deviation of the HTF distribution model. I would prefer if we could go lower and form a range from there, but at the moment thats all i got.

SPX Swing SetupSPX will rise, Some understand many will #CULT, Since the FDV for 2025 is uprising and the agenda is to invest in communities not in any financial institute, Strong communities are running behind to make the algorithm into real manifestation. #SPX6900

Lingrid | BTCUSDT Short-Term Bullish Momentum The price perfectly fulfilled my last idea . BINANCE:BTCUSDT continues to trade within a strong upward channel, supported by consecutive higher highs and an ascending trendline. After breaking above the range near $108,200, price briefly peaked above $110,000 before pulling back to retest the mid-support zone. Current action shows a rebound from the upward trendline, suggesting buyers are preparing for another leg up toward $110,500 and possibly the $112,000 resistance zone.
📈 Key Levels
Buy zone: around 108,000 or below
Sell trigger: break below 107,000 with close under channel
Target: 110,500 – midpoint resistance, followed by 112,000
Buy trigger: bounce from trendline and reclaim of 109,000
💡 Risks
Weak rebound could signal range re-entry and stall upside
Break below the trendline may shift bias to 105,000
Multiple rejections near 110,000 could indicate topping pressure
If this idea resonates with you or you have your own opinion, traders, hit the comments. I’m excited to read your thoughts!

MeghaHorn or BowTie Pattern !!!Key Observations:
Pattern Formation:
A broadening wedge or megaphone pattern (also likened to a bow tie) is forming.
Price is oscillating between expanding trend lines.
Labeled waves: 1, 2, 3, 4, 5 within the pattern.
Critical Zones:
Buy Above: $2,815.98 (upper boundary of the wedge).
Sell Below: $2,258.03 (lower boundary of the wedge).
No Trading Zone: Between $2,258 – $2,815 (uncertainty/consolidation area).
Price Target:
If price breaks below, Target 1 is indicated around $1,800 or below (implied from structure).
Current Price:
Trading at $2,748.56, up +5.05%, within the “No Trading Zone”.
Summary:
The chart suggests waiting for a breakout or breakdown from the wedge pattern to determine the next move. A breakout above $2,815 could signal a buy opportunity, while a breakdown below $2,258 could trigger a sell with a potential target near $1,800.
Ask ChatGPT

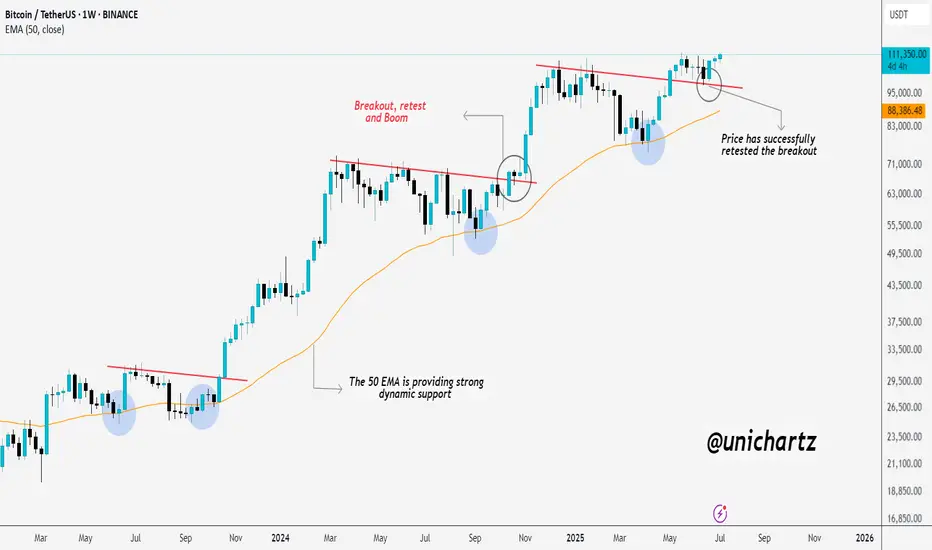
50 EMA Magic: Bitcoin Explodes After Perfect Retest!CRYPTOCAP:BTC just made a new All-Time High (ATH) — exactly as mentioned!
It broke out, retested perfectly, and blasted off.
The 50 EMA is acting like a rocket launchpad, giving price solid support every time.
SPXBank of America expects SPX to close 2025 near 6,300, with a 12‑month projection of 6,600. They note ongoing stagflation risks and do not expect rate cuts this year .
