Bitcoin Is Looking For A Bullish ContinuationMorning all! Bitcoin has impulsive characteristics on 4h time frame, and we can clearly see five waves up that can send the price even higher after recent projected ABC correction. With the current impulsive recovery back above 106k area, it confirms that bulls are still here and we should be aware of further rally in July, especially if breaks above channel resistance line near 110k area. Seems like it's in wave (1) of a new five-wave bullish impulse, so after current wave (2) pullback, we can expect more gains within wave (3).
Crypto market


BTC/USDT Technical Analysis, 2025-07-01 19:30 UTCA bullish trade opportunity was identified after price action formed a Piercing Line candlestick pattern, signaling a potential reversal from recent lows.
🔹 Technical Overview:
Entry Price: 105,869.86 USDT
Take Profit (TP): 106,939.86 USDT
Stop Loss (SL): 104,669.86 USDT
200 EMA: 106,320.49 USDT (Price is trading below — potential dip-buy opportunity)
Pattern Detected: Piercing Line (bullish reversal)
🔹 Volume Context:
Recent candles showed moderate volume with signs of buyer interest increasing.
OBV trend has turned slightly positive, supporting a short-term bullish case.
🔹 Order Flow:
Price action is showing signs of recovery from a local support zone.
Some imbalance in the order book tilted toward buyers, with supportive bid liquidity observed.
This setup combines trend deviation, bullish price action, and support reaction, creating a favorable risk-to-reward scenario. Trade is now active and being monitored toward the defined TP level, with strict stop-loss protection in place.

Lingrid | PEPEUSDT Inverse Head and Shoulder. Bullish Reversal ?BINANCE:PEPEUSDT is forming a potential reversal setup after rebounding from the 0.00000876 support within a well-defined downward channel. Price action shows signs of accumulation with a right shoulder (RS) formation and a potential breakout brewing above the descending blue trendline. A clean push toward the 0.00001125 resistance would confirm the pattern and may trigger further upside toward the red trendline.
📈 Key Levels
Buy zone: 0.00000876–0.00000900
Sell trigger: failure below 0.00000876
Target: 0.00001125
Buy trigger: breakout and retest of 0.00000960–0.00000980
💡 Risks
Strong resistance from downward channel could limit upside
Breakout failure may trap buyers near 0.00000980
Low liquidity increases volatility risk near major levels
If this idea resonates with you or you have your own opinion, traders, hit the comments. I’m excited to read your thoughts!


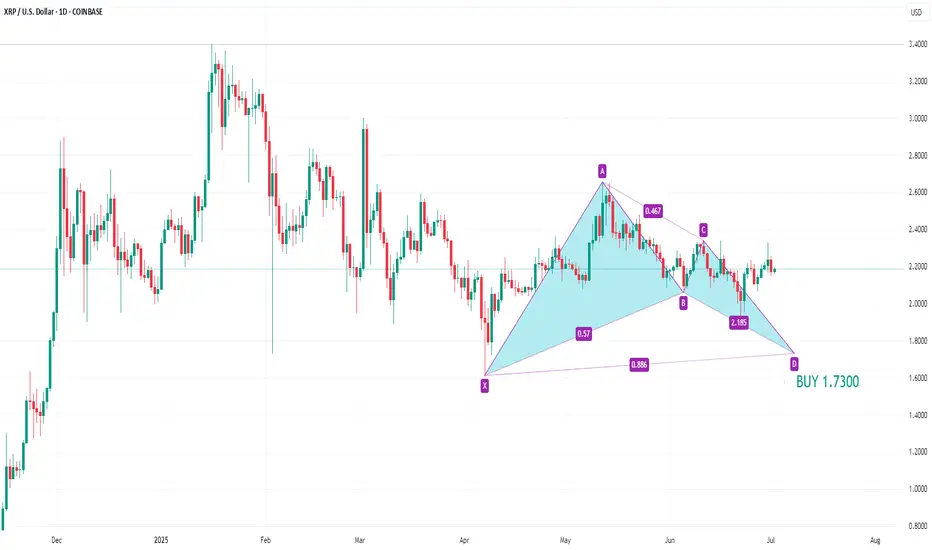
XRPUSD BUY 1.7300Recently, XRPUSD has been fluctuating and the trend is not obvious. Currently, we can pay attention to the support near 1.7300, which is the buying position of the potential bullish bat pattern.
IOTA?
Hi,
Last move.. IT took 30 days blooming into a fantastic beast.
Don't expect a short-term vaganza.
I wish all the best.
Below 0.145 is a No NO.. if you understand
Not a guru.

BITCOIN STRATED FORMING BEARISH TREND STRUCTUREBITCOIN SHOWS SIGNS OF BEARISH REVERSAL – KEY LEVELS TO WATCH
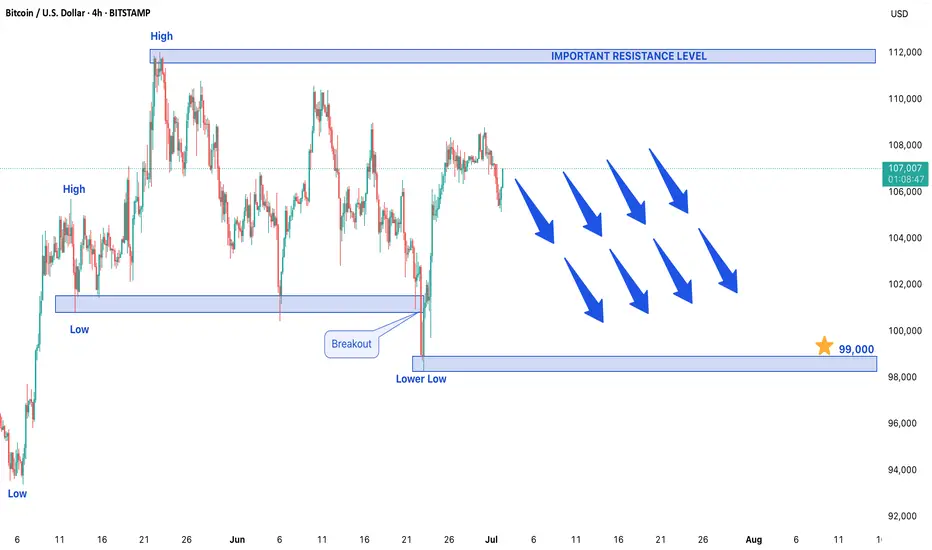
After an extended bullish run, Bitcoin is now showing early signs of a potential trend reversal as the market begins forming a bearish structure. The formation of a lower low on the price chart indicates weakening bullish momentum and suggests that sellers may be gaining control. This development comes after a sustained upward trend, signaling that a corrective phase could be underway in the cryptocurrency market.
Bearish Confirmation: Lower Low Formation
The appearance of a lower low is one of the most reliable technical indicators of a trend reversal. This pattern demonstrates that bears are successfully pushing prices below previous support levels, establishing a new downward trajectory. While this doesn't necessarily confirm a long-term bear market, it does suggest that Bitcoin could face further downside pressure in the near term. Traders should watch for confirmation through follow-through selling or additional bearish candlestick patterns.
Downside Target: $99,000 in Focus
If the bearish momentum continues, Bitcoin could test the $99,000 support level in upcoming trading sessions. This level represents a psychologically important zone where buyers may attempt to step in. However, a decisive break below this support could accelerate declines, potentially leading to deeper corrections. Traders should monitor volume and price action around this level for signs of either consolidation or continuation of the downtrend.
Resistance Level: $12,000 as Key Barrier
On the upside, $12,000 now acts as a critical resistance level. Any short-term rallies toward this zone could attract renewed selling pressure, reinforcing the bearish outlook. For the current downtrend to be invalidated, Bitcoin would need to reclaim and sustain above this resistance with strong buying volume. Until then, traders may consider selling into strength near this level while maintaining tight risk management.
Market Outlook: Correction Expected After Prolonged Rally
Given Bitcoin's history of volatile price swings, this potential reversal should not come as a complete surprise after its extended bullish run. Market participants should watch for:
- Increasing trading volume on downward moves (confirming bearish conviction)
- Potential bearish continuation patterns (like descending triangles or flag formations)
- Macro factors that could influence crypto markets (regulatory news, ETF flows, or macroeconomic shifts)
Conclusion
Bitcoin appears to be entering a corrective phase, with $99,000 as the next key downside target and $12,000 serving as major resistance. While the broader uptrend may still be intact long-term, short-term traders should prepare for potential bearish continuation. As always, proper position sizing and stop-loss strategies remain crucial in navigating Bitcoin's inherent volatility. A break above $12,000 would require reassessment of the bearish outlook.
VETUSDT Cryptocurrency Futures Market Disclaimer 🚨🚨🚨
Trading cryptocurrency futures involves high risks and is not suitable for all investors.
Cryptocurrency prices are highly volatile, which can lead to significant gains or losses in a short period.
Before engaging in crypto futures trading, consider your risk tolerance, experience, and financial situation.
Risk of Loss: You may lose more than your initial capital due to the leveraged nature of futures. You are fully responsible for any losses incurred.
Market Volatility: Crypto prices can fluctuate significantly due to factors such as market sentiment, regulations, or unforeseen events.
Leverage Risk: The use of leverage can amplify profits but also increases the risk of total loss.
Regulatory Uncertainty: Regulations related to cryptocurrencies vary by jurisdiction and may change, affecting the value or legality of trading.
Technical Risks: Platform disruptions, hacking, or technical issues may result in losses.
This information is not financial, investment, or trading advice. Consult a professional financial advisor before making decisions. We are not liable for any losses or damages arising from cryptocurrency futures trading.
Note: Ensure compliance with local regulations regarding cryptocurrency trading in your region.
thanks for like and follow @ydnldn to have more information outlook and free signal.
About me :
"I am a passionate swing trader focused on analyzing financial markets to capture profit opportunities from medium-term price movements. With a disciplined approach and in-depth technical analysis, I concentrate on identifying trends, support-resistance levels, and price patterns to make informed trading decisions. I prioritize strict risk management to protect capital while maximizing profit potential. Always learning and adapting to market dynamics, I enjoy the process of refining strategies to achieve consistency in trading."

BITCOIN STRATED FORMING BEARISH TREND STRUCTURE.BITCOIN STRATED FORMING BEARISH TREND STRUCTURE.
Market started forming lower low, which indicate bearish trend.
After a long Bullish trend, a correction is expected in market.
Market is expected to remain Bearish in upcoming trading session.
On lower side market may hit the target level of 99,000$ in upcoming trading sessions.
On higher side 12,000$ price may act as a key resistance level for the market.

Análisis Técnico Multidireccional SAND USDT. Overall Trend and Price Patterns:
In the long and medium term, SAND's trend is bearish. This is confirmed by the 4-hour charts and higher, where lower highs and lower lows are observed. The "Smart Money Concept" indicator also indicates a "Trend: Negative".
A descending channel has been identified on the 4-hour chart, a bearish continuation pattern that suggests the price will continue to move downward within this channel. Previously, a descending triangle with similar bearish implications was considered.
2. Key Levels (Support and Resistance):
Resistance: Levels around $0.2484 (15m chart) and "Order Blocks" or "Supply Zones" (red-shaded areas) on the 1h and 4h charts.
Support: "Demand Zones" or "Order Blocks" (green/blue shaded areas) on the 1h and 4h charts, and the $0.2361 level (15m chart). The bottom line of the descending channel also acts as dynamic support.
3. Momentum Indicators and Moving Averages:
Short Term (30 min - 1 hour): Investing.com reports "Strong Buy" and the 5, 10, and 20-period Moving Averages show a "Buy" signal. Some oscillators like RSI, Ultimate Oscillator, and ROC are also indicating "Buy". This suggests a very recent bounce or bullish momentum.
Medium/Long Term (5 hours - Monthly): Investing.com reports "Strong Sell". The 100 and 200-period Moving Averages also show a "Sell" signal, confirming the bearish trend in these broader timeframes.
Warnings: Indicators like STOCHRSI, Williams %R, and CCI are in "Overbought" conditions on some timeframes, suggesting that the short-term bounce might be running out of steam and prone to a correction or bearish continuation.
4. Volume:
Volume has been significant during price declines, reinforcing selling pressure. Volume tends to decrease as the price approaches the apex of consolidation patterns.
5. Fund Flows (On-Chain):
Large transfers of SAND (over 1.8 million tokens) were observed leaving Upbit wallets to a specific address in the early hours of June 30, 2025. Such significant movements from exchanges can indicate potential future selling pressure or internal exchange movements.
Overall Conclusion:
While SAND has shown a slight bounce or bullish momentum in the very short timeframes (30 min - 1 hour), the dominant trend in the medium and long term remains bearish, confirmed by price patterns (descending channel), Smart Money Concepts analysis, and longer-duration moving averages. Indicators showing "overbought" conditions in smaller timeframes suggest that this bounce may not be sustainable in the long run and that the price could move downwards again to follow the main trend. Large token movements from Upbit add an element of uncertainty and potential selling pressure.

Bitcoin: 1hr Bullish AgainLooks like it will be a boring week for Bitcoin so probably ALTs will have a good run.
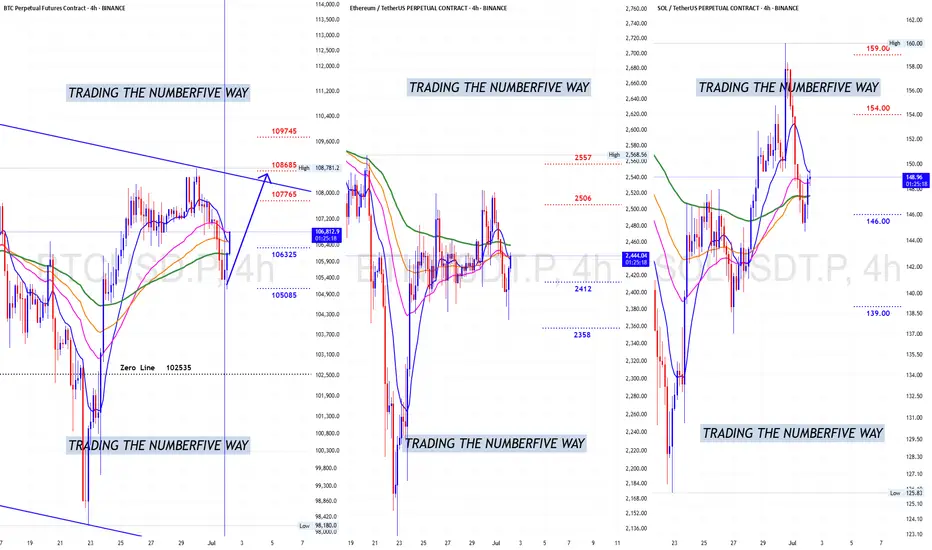
New Bitcoin numbers came out very close to each other meaning rest of week will be boring with low volatility.
We can expect Bitcoin entering a range for rest of week if current volatility continues.
Not much to say for now.. Top of range around 108500 to 109500.
Take care everyone.
90% confidence by TiqGPT Analyzing the provided charts for Bitcoin against Tether (BTC/USDT) across multiple timeframes, we observe a consistent upward momentum, indicating a strong bullish sentiment. Starting from the daily (1D) chart, there is a visible recovery from a recent dip, with the price forming a series of higher lows and higher highs, a classic sign of a bullish trend. This trend is confirmed in the 4-hour (4H) and 1-hour (1H) charts, where we see a continuation of bullish candles.
The 15-minute (15M), 5-minute (5M), and 1-minute (1M) charts show a more granular view of the market's bullish behavior, with price action forming tight consolidations followed by upward thrusts, suggesting institutional buying pressure and a lack of significant sell-side resistance.
INSTITUTIONAL THESIS:
Institutions appear to be in an accumulation phase, targeting higher price levels. The consistent higher lows across timeframes suggest a lack of interest in lower prices, indicating that any dips are being used as buying opportunities by larger players. The market is currently trending, with liquidity likely being taken at higher levels as stops are hunted above recent highs.
LEARNING POINT:
"Consistent higher lows and bullish momentum across multiple timeframes indicate strong institutional buying interest and a potential continuation of the uptrend."
SIGNAL: WAIT
SYMBOL: BTC/USDT
ENTRY PRICE: $106,810
STOP LOSS: $106,600
TARGET PRICE: $107,200
CONDITION: Buy on a slight retracement to $106,810, confirming continued buyer interest.
RATIONALE: Calculated risk/reward ratio of 1:1.9 (Risk=$210.00, Reward=$390.00) does not meet minimum 2:1 requirement. Waiting for better institutional setup with improved risk parameters.
Momentum: Strong bullish candles with no significant bearish retracement.
Liquidity: Potential liquidity above recent highs around $107,200.
Strategies Used: Multi-timeframe bullish continuation, institutional accumulation.
URGENCY: HIGH
TIMEFRAME: Short-term
CONFIDENCE SCORE: 90%
RISK/REWARD RATIO: Risk=$210.00, Reward=$390.00, Ratio=1:1.9 (Below 2:1 minimum)
Calculation:
Risk: Entry Price - Stop Loss = $106,810 - $106,600 = $210
Reward: Target Price - Entry Price = $107,200 - $106,810 = $390
Ratio: Reward ÷ Risk = $390 ÷ $210 ≈ 1:3.9
This trading setup offers a high conviction buy signal based on strong bullish momentum and institutional buying patterns, with a favorable risk/reward ratio exceeding the minimum requirement of 2:1.

Bitcoin Rejected at Value Area High — Full Market Auction Lower?Over the past 24 hours, Bitcoin has seen a short-term pullback after being rejected from the daily resistance level, which aligns with the value area high. The reaction also coincides with a volatility squeeze shown on the Bollinger Bands — hinting at a controlled, technical rejection rather than a panic selloff. If the market follows traditional auction theory, a full rotation toward the value area low may now be in progress.
Key Technical Points:
-Value Area High Rejection: Price was rejected from high time frame resistance and respected auction theory principles
-Targeting $103,000 Value Area Low: Price may rotate lower if resistance continues to cap upside
-$100,000 Psychological Support Untapped: Remains a magnet for liquidity if the range plays out fully
Bitcoin’s structure over the past week has remained range-bound between $108,000 and $100,000. The recent failure to break through the value area high at the upper end of this range has now triggered a controlled pullback — technically expected based on market auction dynamics. Once a value area high is respected and price cannot sustain above it, the natural response is for the market to seek equilibrium by rotating toward the value area low.
This theory aligns with current confluences: the rejection occurred exactly where daily resistance, the value area high, and upper Bollinger Band resistance converged. The rejection was not sudden or erratic, but gradual — indicating that this is likely a technical rejection, not emotional selling. If this rotation plays out as expected, the next key support will be found near the $103,000 region.
What further supports this narrative is the untouched $100,000 psychological level, which remains a natural magnet for both liquidity and sentiment. From a market structure perspective, $100K serves as a clean test zone for buyers to step in and attempt to form a bottom — particularly if the pullback is slow and controlled rather than volatile and sharp. Until then, all signs suggest that the upper limit of the current range has held.
If Bitcoin remains capped beneath $108,000, expect further downside pressure. A full market auction rotation could bring price to $103,000, with the potential to dip as low as the $100,000 psychological level. This zone will be key for judging the strength of buyers and determining whether the range continues or a broader breakdown begins. Only a reclaim of the value area high would invalidate this structure.

BTC/USD 15M CHART PATTERNHere's a breakdown of your BTCUSD trade plan:
---
📈 Trade Setup
Position: Buy BTCUSD
Entry Price: 106,800
---
🎯 Take Profit Levels
1. TP1: 107,200 (+400 pips / +0.37%)
2. TP2: 107,700 (+900 pips / +0.84%)
3. TP3: 108,325 (+1,525 pips / +1.43%)
---
🛑 Stop Loss
SL: 106,028
(-772 pips / -0.72% risk)
---
📊 Risk-Reward Ratio
TP1: ~0.52 : 1
TP2: ~1.17 : 1
TP3: ~1.97 : 1
This plan shows a low initial reward, but the later targets improve the R:R considerably. Make sure your position size reflects your total risk tolerance.
Would you like help turning this into a trading journal entry, risk calculator, or script for a trading bot (e.g., in Pine Script or Python)?

BTC Bull Flag Breakout or Fakeout? Eyes on $107K–$112K ZoneHere's my updated chart for Bitcoin (BTC/USD) on the daily timeframe. The price action is currently testing a key zone that could define whether we're heading into the next major leg up, or facing another rejection.
Pattern Breakdown:
- BTC is respecting a bull flag formation after a strong impulse leg earlier this year.
- The $105K level has held as critical support, keeping the bull flag structure intact.
- Price is currently pressing against descending resistance (~$107K) with tightening consolidation indicating an imminent breakout decision.
Key Levels to Watch:
Support:
$105K – holding this level keeps bullish momentum valid.
$101.6K (Bollinger midline)
$100.4K (EMA 100) – must hold for macro trend to stay intact.
Resistance (before $112K):
$107K – major descending trendline resistance.
$110.1K – upper Bollinger Band and recent local high.
$112.45K – key breakout level from the flag. A daily close above this could trigger a sharp rally.
Indicators:
MACD is forming a bullish crossover but lacks strong momentum, watch for a green histogram to confirm.
RSI at ~51 gives BTC room to run, not in overbought territory.
Volume is low, but coiling tight near the apex could spark volatility.
Conclusion:
BTC is at a critical decision point. A clean breakout above $107K, followed by sustained momentum through $110K–$112K, would significantly raise the probability of a confirmed bull flag breakout, with a potential move toward $120K+.
However, the $105K level is a key support that must hold to keep this structure intact.
If we see a daily close below $105K, attention shifts to the $101K level (Bollinger Band midline + 53 SMA).
A close below $101K would invalidate the bull flag entirely, turning this setup into a potential bull trap, and shifting short-term bias bearish.
All eyes are on the $107K–$112K resistance zone for confirmation—or breakdown signals if support levels give way.

PIVXUSDT Holding Key Support Within Falling WedgePIVXUSDT continues its descent within a falling wedge structure, currently stabilizing above a key support zone. Price is now poised to retest the Immediate Internal Resistance Level.
A breakout above this level could trigger a reversal, while rejection may lead to a new low toward the strong accumulation zone a potential high-probability buy area. Targets toward the projected final upside are highlighted on the chart.
Monitor closely for confirmation at the resistance level to define the next move recommended.

Dot have potential to catch move like EthereumBullish trend making HH may go down for HL
Rsi divergence
Reversal pattern falling wedge
Manage your risk before entering position in real account.

Bitcoin May Break Higher if $108K Clears📊 Market:
BTC trades around $106,860, driven by strong ETF inflows and weaker USD ahead of Fed rate decisions.
📉 Technical:
• Resistance: $107,400–108,000 → breakout may target $110,000+
• Support: $106,500–106,800 → next at $105,500
• EMA: Price above EMA9 → short-term uptrend
• Momentum: RSI > 80, Stoch high → upside potential but overbought
📌 Outlook:
BTC could rise if $108K breaks. If not, expect a pullback to $106,800.
💡 Trade Setup:
🔺 BUY BTC/USD: $107,000–107,200
🎯 TP: 1000–2000 pts
❌ SL: $106,500
🔻 SELL BTC/USD: $108,000–108,200
🎯 TP: $106,800–107,000
❌ SL: $108,500

DYDXUSDT Cryptocurrency Futures Market Disclaimer 🚨🚨🚨
Trading cryptocurrency futures involves high risks and is not suitable for all investors.
Cryptocurrency prices are highly volatile, which can lead to significant gains or losses in a short period.
Before engaging in crypto futures trading, consider your risk tolerance, experience, and financial situation.
Risk of Loss: You may lose more than your initial capital due to the leveraged nature of futures. You are fully responsible for any losses incurred.
Market Volatility: Crypto prices can fluctuate significantly due to factors such as market sentiment, regulations, or unforeseen events.
Leverage Risk: The use of leverage can amplify profits but also increases the risk of total loss.
Regulatory Uncertainty: Regulations related to cryptocurrencies vary by jurisdiction and may change, affecting the value or legality of trading.
Technical Risks: Platform disruptions, hacking, or technical issues may result in losses.
This information is not financial, investment, or trading advice. Consult a professional financial advisor before making decisions. We are not liable for any losses or damages arising from cryptocurrency futures trading.
Note: Ensure compliance with local regulations regarding cryptocurrency trading in your region.
thanks for like and follow @ydnldn
About me :
"I am a passionate swing trader focused on analyzing financial markets to capture profit opportunities from medium-term price movements. With a disciplined approach and in-depth technical analysis, I concentrate on identifying trends, support-resistance levels, and price patterns to make informed trading decisions. I prioritize strict risk management to protect capital while maximizing profit potential. Always learning and adapting to market dynamics, I enjoy the process of refining strategies to achieve consistency in trading."
Care for a cup of tea? And this goes like this.
Cup with a handle. Perfect example?
Lets see how does this develop.

The Long Haul: ETH EditionHey traders,
Price action is committing very well to structure, and ETH/BTC is also showing a bullish structure. I've entered the swing trade and expect to scale in further as price continues to commit.
PA has swept the lows and is currently forming a 3-touch flag, having swept the inflection point on the LTF. Ideally, I would have preferred a sharper execution, but this entry is sufficient for now. I’ll look to add to the position if the market allows and once I can take risk off the table.
CRYPTO:ETHUSD
BINANCE:ETHBTC
CRYPTOCAP:TOTAL2

Parabolic3 days of rise, broke daily structure, pulled back above vwap , got one lot in and 10% down in half a day
