TradeCityPro | VET Battles Key Resistance Amid Buyer Momentum👋 Welcome to TradeCity Pro!
In this analysis, I’m going to review the VET coin for you. VET is a Layer1 and RWA project with a market cap of 1.84 billion dollars, currently ranked 44 on CoinMarketCap.
⏳ 4-Hour Timeframe
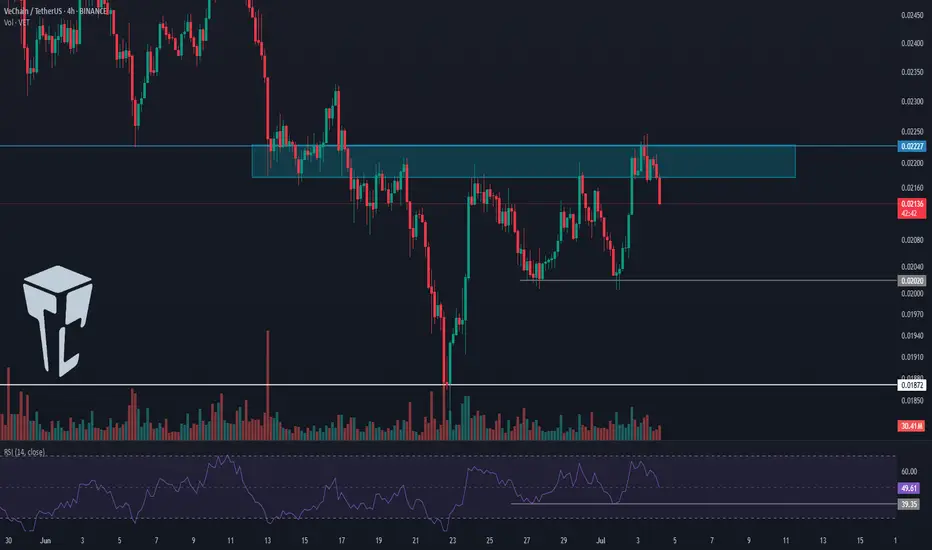
On the 4-hour timeframe, as you can see, this coin experienced a downtrend and eventually reached the 0.01872 bottom. It then received support from that level and began a bullish move.
✨ Right now, a significant resistance is located at 0.02227, which I’ve marked on the chart as a supply zone. So far, it seems the price has been rejected from this area.
🔍 Price has attempted to break this zone three times already. Each time, although it managed to penetrate further, it still failed to break through and got rejected.
💥 With each rejection, the RSI oscillator has also been rejected from near the 70 level and moved downward. If, in future attempts, the RSI enters the Overbuy area, the probability of breaking 0.02227 will significantly increase.
📊 Currently, market volume favors buyers. The buying volume on green candles has increased noticeably. Meanwhile, during the rejection from the resistance zone, the selling volume was very low, which signals strong buyer control.
⚡️ If the downtrend continues and price fails to form a higher low above 0.02020, we can enter a short position upon the break of 0.02020. A break of 39.35 on the RSI would be a solid momentum confirmation for this setup.
📉 The main short position can be opened upon the break of 0.01872. This would confirm the continuation of the downtrend and could lead to a sharp downward move.
📝 Final Thoughts
This analysis reflects our opinions and is not financial advice.
Share your thoughts in the comments, and don’t forget to share this analysis with your friends! ❤️
Crypto market
NEAR Breakout Confirmed—But Is This Just a Bull Trap?Yello Paradisers! Did you see that breakout on #NEARUSDT? After weeks of consistent lower highs and a clearly defined descending resistance, price action has finally snapped that bearish structure and completed a textbook inverse Head and Shoulders formation on the 12H chart. This kind of pattern doesn’t appear often at key cycle points, and when it does—especially with confirmation—it becomes a high-probability signal of a trend reversal.
💎#NEARUSDT ,The neckline of the inverse H&S, sitting around the $2.17–$2.23 zone, has now been broken and crucially retested as support. This means the former resistance is now acting as a probable base for bulls, and if price remains above this area, the market is likely preparing for a strong probable impulsive move to the upside.
💎The structure shows clear bullish intent, and from a technical perspective, the first resistance comes in at $2.72. A clean break above that could open the door toward the major resistance zone between $2.97 and $3.05, which would complete the projected breakout target of the H&S pattern.
💎If bulls manage to maintain control above the $2.17–$2.23 support zone, we expect price to slowly build momentum toward $2.72, with increased volatility likely once that level is tested. Should that break occur with volume, the next leg may extend rapidly into the major resistance zone. However, if price fails to hold above this flipped support zone, we will be closely watching the $2.02–$1.89 area as the last major support before invalidation.
💎A daily candle closing below $1.798 would invalidate this entire bullish thesis and put the market back into a neutral-to-bearish range.
💎Adding more probability to this setup, NEAR is now trading above multi-timeframe EMA on higher time frame. This multi-timeframe EMA alignment supports bullish continuation, as momentum begins to shift in favor of buyers. However, continuation depends heavily on how price reacts at each resistance level—especially as we enter the mid-$2.70s.
💎The probable move from here is bullish, with the expectation that NEAR pushes toward the $2.72 level in the short term, followed by a potential rally to $2.97–$3.05 if momentum sustains. This scenario remains valid as long as price holds above $2.17, and especially above $2.02. Below that, the structure weakens. Below $1.798, the bullish bias becomes fully invalidated.
This is the only way you will make it far in your crypto trading journey. Stay sharp and patient, Paradisers. It’s not about chasing pumps—it’s about positioning smartly before the crowd.
MyCryptoParadise
iFeel the success🌴

BTCUSDT: building up for a bigger pullback.As it stands, BTC is at a very important area. There's a first sign that the trend will change for the coming days and I expect the price to drop towards the 103k area.

Time for a short? As you can see, after the price dropped, it made a retracement close to the 0.78 Fibonacci level, and then the market reacted with another downward move.
At the same time, a triangle pattern—or whatever you’d call it—has also formed, which is often considered a continuation pattern, especially in a downtrend. So, there’s a chance the price could drop further.
Personally, I entered a short position at 0.121$, with my take-profit set at 0.8$.

Arbitrum scalp long to $0.3331Just now opened up a scalp long on arb.
2.5RR
Aiming for $0.3331 . The market have fallen relatively low and is a daily demand / support. I think there's a good probability we'll correct back up a bit before end of day.


BTC - Zoomed Out ScenarioAs predicted DXY has broken down a major monthly bearish trendline - currently finishing a bearish retest before further free fall.
If this plays out we have 2-3 years of a weakening / correcting dollar, and a strengthening investment in assets such as Bitcoin.
This means an extended bull market spanning 2-4 years on Bitcoin and equities.
However - there is a mass amount of liquidity to the uber lows towards 10,000 on BTC.
Market is showing manipulated intention to hit these lows by keeping the price below this bearish cross section - and that’s why bitcoin hasn’t been moving up yet.
This tells me this is more likely than we all think to play out.
I’m trading the following:
Short - 108,200 to 35,000
Long - 35,000 to 80,000
Short - 80,000 to 10,000
Will update accordingly if the plan changes.
Happy trading.

LITECOIN (LTC) - On The Verge Of Exploding - ETF Catalyst?Litecoin: A Decentralized Network with a Differentiated Risk Profile
Litecoin (LTC), launched in 2011 by former Google engineer Charlie Lee, is one of the oldest and most active Layer-1 blockchain networks in the cryptocurrency space. Often referred to as the “digital silver” to Bitcoin’s “digital gold,” Litecoin was designed to offer faster transactions, lower fees, and broader accessibility while maintaining a similar monetary policy and codebase.
This post aims to provide an overview of Litecoin’s technical structure, usage, risk profile, and current developments—without speculative bias—so readers can form their own assessments.
1. Transparent Origins and Founder Dynamics
One key difference between Litecoin and Bitcoin lies in the identity of their respective creators. Bitcoin was developed by Satoshi Nakamoto, a pseudonymous and still-unknown individual or group, who is estimated to hold 750,000 to 1.1 million BTC—a significant portion of the total supply that has never moved. The dormant status of these holdings has occasionally raised concerns about future market impact if they were ever activated.
In contrast, Litecoin was founded by Charlie Lee, a known and public figure who was active in the community before, during, and after the launch. In 2017, Lee announced he had sold or donated nearly all his LTC holdings to avoid any potential conflict of interest. Today, no founder or insider is known to hold a disproportionate share of the Litecoin supply. This level of transparency and decentralization has been interpreted by some as a factor that lowers long-term governance and concentration risk.
2. Structural Simplicity and Leverage Exposure
Another distinction between Litecoin and Bitcoin lies in market structure and exposure to leverage.
Bitcoin is widely used as collateral in crypto lending markets and institutional derivatives, including perpetual futures and structured products. This has introduced significant systemic risk during periods of market stress, as high leverage has historically led to cascading liquidations across centralized and decentralized platforms.
Litecoin, in contrast, has relatively limited exposure to leveraged products and collateralized lending. It is not commonly used as collateral in CeFi or DeFi protocols, and institutional futures markets for LTC are smaller and less active. As a result:
Litecoin is less likely to trigger or be affected by mass liquidations
It has reduced systemic risk due to lower market entanglement
Its price tends to reflect more organic supply/demand dynamics
It is less involved in cross-collateralized or rehypothecated loan systems
This simpler structure may appeal to risk-aware investors looking for cleaner exposure without the reflexivity effects common in heavily leveraged markets.
3. Scarcity and Monetary Policy
Litecoin shares a similar deflationary model with Bitcoin, with a hard cap of 84 million LTC and scheduled halving events every four years. The most recent halving occurred in August 2023, reducing the block reward from 12.5 to 6.25 LTC per block.
With over 75 million LTC already mined, fewer than 9 million remain in future issuance. The protocol’s monetary policy is deterministic and cannot be altered unilaterally, which may appeal to those who prioritize predictable supply and inflation resistance.
While Litecoin’s cap is four times higher than Bitcoin’s, the relative issuance schedule and halving dynamics mirror Bitcoin’s design. Some investors view this as a hedge against fiat currency debasement, although the asset's volatility and adoption context should be taken into account.
4. Network Fundamentals and Real-World Use
Litecoin has maintained near 100% uptime since inception, and its transaction throughput and fee structure are generally favorable compared to many competing networks.
In 2024, Litecoin became the most used crypto for payments via BitPay, surpassing Bitcoin in transaction volume, driven by its fast 2.5-minute block times and low transaction fees. It is supported by major platforms including PayPal, and accepted by thousands of online and retail merchants.
From a security perspective, Litecoin’s hashrate reached all-time highs in 2025, partly due to merge-mining with Dogecoin, which has helped strengthen its proof-of-work infrastructure. Network upgrades like MWEB (MimbleWimble Extension Blocks) have added optional privacy layers to Litecoin’s UTXO model, while Lightning Network integration supports instant payments.
These developments suggest that Litecoin continues to evolve, with emphasis on efficiency, user privacy, and practical usability.
5. Institutional Presence and ETF Outlook
Litecoin has seen modest but growing institutional involvement. Products such as the Grayscale Litecoin Trust (LTCN) have existed for several years, and Coinbase introduced Litecoin futures trading in 2024. Fidelity also offers LTC trading and custody to institutional clients.
More notably, a Spot Litecoin ETF application is currently under review by the U.S. Securities and Exchange Commission (SEC), with analysts from Bloomberg estimating a 95% probability of approval before the end of 2025. If approved, this would make Litecoin one of the first proof-of-work assets outside of Bitcoin to gain direct exposure through a regulated ETF vehicle.
Should that happen, it may increase access, liquidity, and legitimacy among traditional investors. However, as always, regulatory decisions remain uncertain and subject to broader political and market conditions.
6. Technical Structure and Long-Term Price Action
From a macro-technical perspective, Litecoin has historically followed a pattern of higher lows and higher highs across each market cycle. This structure remains intact as of 2025, with a strong support at 81 USD on a 6 months timeframe.
Summary
Litecoin presents a combination of characteristics that differentiate it from other crypto assets, including:
✅ A public, transparent founder and no major insider dominance
✅ Limited exposure to leveraged lending, reducing systemic risk
✅ Deterministic monetary policy with a fixed supply and halving schedule
✅ Real-world usage in payments and retail adoption
✅ Strong network security and development activity
✅ Potential ETF approval that may broaden accessibility
These features do not necessarily imply outperformance, but they form the basis for an asset with a relatively clean structure, historical resilience, and a distinct position in the crypto ecosystem.
🔎 Disclaimer:
The information presented here is for educational and informational purposes only and should not be interpreted as financial advice.
Always conduct your own research, assess your individual risk profile, and make investment decisions based on your own analysis and objectives.

Btcusd techinical analysis.Btcusd techinical analysis next move psibale at h1 time frame.not finchinal advice.


PENGU SHORT UPDATE Added more Shorts from $0.017000 (Dump time PENGU SHORT UPDATE
Added more shorts from $0.017000
Expecting huge drop soon
Dumping time soon
Target $0.012600 0r Down
Not a Financial advice

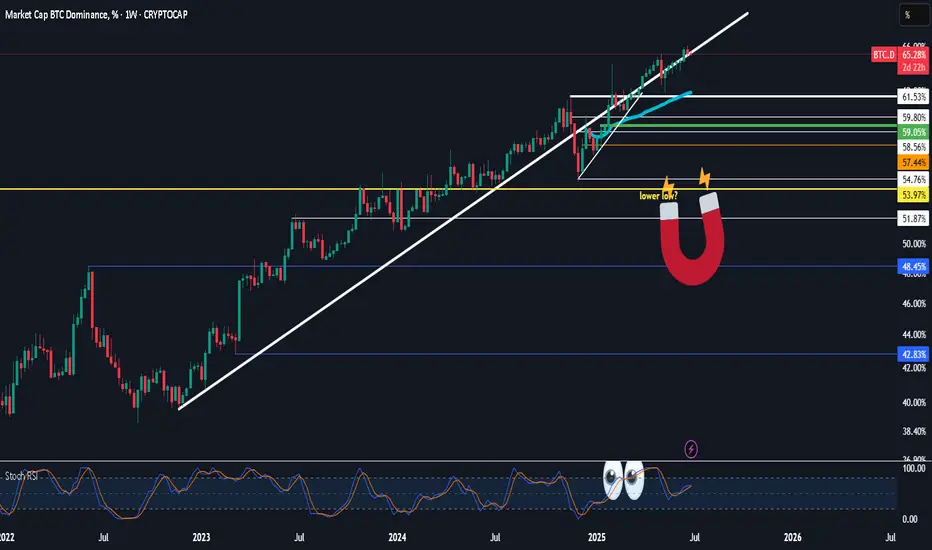
$Btc.dnever thought we would get so high ... heheh no pun intended
so following up on my wif trade thoughts this is where the fun begins for alts with volatility along the way and time to swap to bitty at the magnet .. hwoever long it takes
rsi just needs to roll over and we wait and see the weekly close for confirmation really doubt we push higher but if bitty decides to leg up then we just wait some more
Trending Tokens Are Traps they Destroy your Portfolios🚨 Why Everyone Falls for Trending Projects That End in Disaster
Have you ever bought a token just because everyone was talking about it?
And the moment you jumped in, it started crashing?
This isn’t a rare story; it’s a repeating trap. But why does our brain love buying at the worst possible moment?
Hello✌
Spend 3 minutes ⏰ reading this educational material.
🎯 Analytical Insight on Dogecoin:
BINANCE:DOGEUSDT is currently forming a tight price structure, resembling a compressed spring just below a key daily resistance and trendline. A clean breakout above this area, supported by volume, could trigger a strong bullish continuation, with a projected upside of approximately 30 percent toward the 0.21 level. Traders should monitor this setup closely for confirmation before entering any positions. 📈🐶
Now , let's dive into the educational section,
💸 Trend Equals Triggering Your Greed
Trending coins don’t just pump prices; they pump emotions. One word: FOMO. Fear of missing out makes us ditch logic, ignore risk, and buy because it feels like everyone else is making money. That’s when the trap is set.
🧠 The Market Forgets, But You Shouldn’t
The crypto space is littered with the graves of hyped-up tokens. The cycle is always the same: quick pump, viral noise, massive retail entry, then a violent crash. The names may change, but the pattern doesn’t.
📊 Practical TradingView Tools to Spot Sketchy Trends
Before you click that “Buy” button just because something is trending, take a breath and open your charting tools. Here's a shortlist of powerful features you can use on TradingView that’ll help you filter out dangerous pump tokens:
Volume Profile: Shows where real smart money sits. If most volume spikes near the top, chances are whales are exiting.
RSI (14) : If RSI is above 70 and climbing with no pullback, odds are you're catching it too late.
Anchored VWAP: Anchor it at the start of the trend and see how far price has stretched from rational levels.
Stochastic RSI: Sharp crosses in overbought zones equal major risk signals.
Make it a habit to cross-check multiple timeframes with these tools. Blindly following trends without analysis? That’s how portfolios get burned.
🧪 Pre-Entry Checklist That Could Save You
If something feels “too hot to miss,” ask yourself:
Is the chart readable, or just a straight line up?
Are there healthy pullbacks or just blind momentum?
Is volume spiking only at the top?
Does the project show signs of organic market interest?
Do your TradingView tools confirm a smart entry?
Stick to this list, and you’ll avoid being just another exit-liquidity victim.
🕵️ Spotting Fake Pumps Before It’s Too Late
Here are the red flags no one talks about but every rug has them:
Massive vertical candles in low timeframes
Chaotic candlestick structures with no rhythm
Sharp volatility without any legit updates
Sudden spikes in follower hype and buzz
Real analysts don’t get excited when everyone else is; they start questioning why.
💥 Even Pro Traders Get Caught
Yes, even experienced traders can fall for a perfectly staged hype cycle. Why? Because human brains are wired to chase the crowd. That’s why having a pre-built system is critical. If you rely on gut feelings in a FOMO storm, you’re gambling.
✨ Need a little love!
We put so much love and time into bringing you useful content & your support truly keeps us going. don’t be shy—drop a comment below. We’d love to hear from you! 💛
Big thanks , Mad Whale 🐋
📜Please remember to do your own research before making any investment decisions. Also, don’t forget to check the disclaimer at the bottom of each post for more details.

BTC AnalysisSince the red arrow was placed on the chart, Bitcoin's bullish phase has ended and it has entered a corrective phase. This correction appears to be forming a Diametric pattern, and we are currently in the middle of wave E.
After interacting with the demand zone, the price may move toward the specified targets.
A daily candle closing below the invalidation level will invalidate this analysis.

Penguusdt Buy opportunityPENGUUSDT is exhibiting a potential bullish pennant formation, with price making a strong breakout from the consolidation zone.
It recently found resistance near the top of the pennant pole around the $0.0176 level, which aligns with the Immediate Internal Resistance Level (IIRL).
The current plan is to watch for a pullback into the designated buy-back zone, offering a possible re-accumulation opportunity. If the structure holds, the projected pennant target sits around the $0.043 zone, as illustrated on the chart.

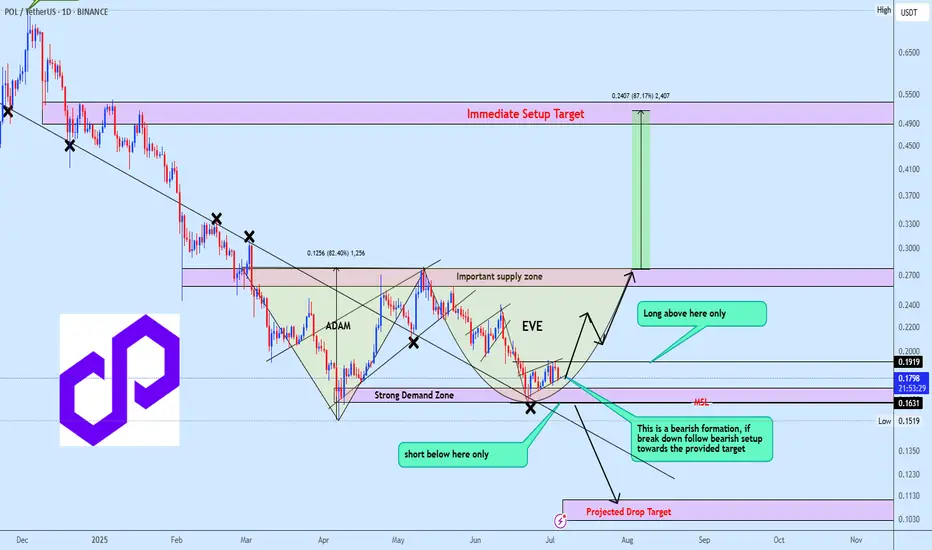
POLUSDT reversal time or bearish ContinuationPOLUSDT is currently shaping a potential Adam and Eve formation, with price consolidating inside a mini bearish flag. A breakdown from the flag would invalidate the bullish setup and likely trigger a continuation toward the projected downside target.
However, if the strong demand zone holds, we could see a bullish reversal unfold, confirming the Adam and Eve structure and opening the path toward the upside projection highlighted on the chart.
At this stage, the focus is on confirmation, not speculation. Waiting for price to validate direction will be key to positioning correctly in this setup.
Bitcoin Purchase Plan!If the price breaks resistance #1, another bullish wave will be more likely in the medium term
Trading Setup:
Traders can open their Buy Trades NOW
BTCUSDT Bitcoin (Daily)
Buy now or Buy on 101500.0
SL @ 93200.0 (-8%)
TP1 @ 121900.0 (+19%)
TP2 @ 136000.0 (+33%)
TP3 @ 150000.0 (+47%)
What are these signals based on?
Classical Technical Analysis
Price Action Candlesticks Fibonacci
RSI, Moving Average , Ichimoku , Bollinger Bands

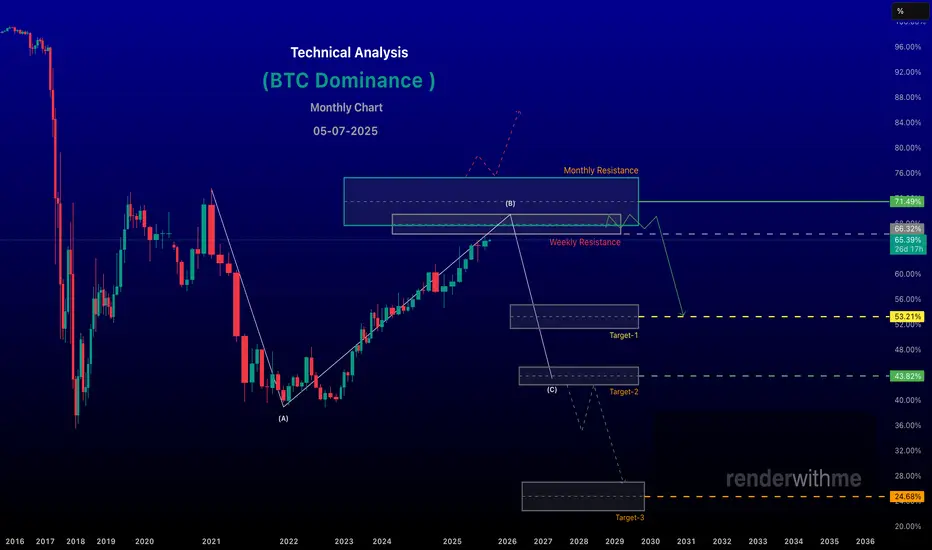
renderwithme | BTC - Dominance about to hit resistanceBitcoin dominance (BTC.D), which measures Bitcoin’s market capitalization as a percentage of the total cryptocurrency market cap, is a key indicator of market sentiment and capital flow between Bitcoin and alt coins . As of July 5, 2025, recent data and technical analysis suggest Bitcoin dominance is at a critical juncture, with potential shifts in market dynamics for the upcoming week. Below is an analysis based on current trends, historical patterns, and technical indicators.Current State of Bitcoin DominanceCurrent Level: Bitcoin dominance is approximately 64.36% to 65.68%, based on recent data .
Recent Trends: Dominance has been testing a multi-year resistance zone between 66.5% and 69.5%
Historical highs in this range (e.g., 64.34% in early 2025) have often preceded pullbacks or altcoin rallies.
Chart indicate bearish signals, such as weekly bearish divergences and potential reversal candles, suggesting a possible decline.
Technical Analysis for Next WeekResistance and Support Levels:Resistance: The 66.8%–67.2% zone is a critical resistance level, aligning with Fibonacci extensions and a long-term descending trend line. A failure to break above this could signal a reversal.
Support: Key support levels are at 61.90%–62.20%, with a potential drop to 58% if bearish momentum accelerates.
Chart for your reference
Disclaimer --
This analysis is based on recent technical data and market sentiment from web sources. It is for informational purposes only and not financial advice. Trading involves high risks, and past performance does not guarantee future results. Always conduct your own research or consult a SEBI-registered advisor before trading.
#Boost and comment will be highly appreciated
Bitcoin shortBitcoin has lost the daily level, has been rejected by weekly level
Not only, but also Bitcoin has lost weekly open, previous week's high and Monday high
I am currently short

RUNEBTC Grew 51,782% in 2021 — Is 6,000% Possible in 2025?Would you like to know something crazy? Just say yes....
THORChain grew 51,782% vs Bitcoin in 665 days. RUNEBTC. Between July 2019 and May 2021.
Now, let me ask you another question. Do you still think that 1,000%, 2,000%, 3,000% is something crazy or out of this world? Looking at how Crypto behaved in the past, we know this is not only possible no, such numbers are not even normal, they might be too low. We might be underestimating the market when we saw 834% potential for growth for example.
Of course it will be go higher... All the top project are getting their own ETFs. The world is evolving towards Crypto.
Listen to me, pay attention. It is not that people are buying Crypto and will trade Crypto to make some money, etc. It is the entire financial system that is called 'Cryptocurrencies'. It is the end of the world basically. It is a new technology.
Just as WiFi took over landline and all that stuff;
Just as email took over mail;
Just as the Internet took over... Telepathy? I don't know.
What I am trying to say is that whatever system we had in the past, everything continues to evolve. It is not something incredible or extraordinary, we were due a monetary upgrade. It is here now. We are all Crypto because we know that paper money is just too old.
Let them close all of my bank accounts... Go ahead!
We have Cryptocurrency now. You can't block us anymore.
Money is free now. Money is freedom.
THORChain has huge potential for growth.
Thanks a lot for your support.
Namaste.

Give me 3 reasons not to be bullish on SolanaSolana’s Total Value Locked (TVL) expanded from $396M on Dec 26, 2022 to $8.69B by July 4, 2025, a 2,094% increase (~22x growth) across 80 weeks . This translates to a weekly geometric growth multiplier of ~1.089, or an 8.9% compound weekly rate .
This rapid TVL expansion reflects capital inflows, increased DeFi participation, and regained trust in Solana’s infrastructure following the FTX collapse.
————————————————
LST Ecosystem Expansion :
Liquid staking derivatives (JitoSOL, mSOL) accounted for a significant share of inflows, as yield-seeking capital returned with Ethereum-style primitives on Solana.
MEV Monetization & Compression Tech :
Validator-side MEV solutions and data compression (via Firedancer and ZK-state) improved scalability and trust in Solana’s low-latency environment.
Resurgence of DeFi-NFT Hybrids :
Protocols like Tensor and HadeSwap blurred lines between DeFi and NFTs, generating sticky liquidity and reinforcing Solana’s unique narrative.
Restored Institutional Confidence :
Post-FTX reforms and a more diversified validator ecosystem helped re-attract institutional capital, supported by enhanced wallet infra (e.g., Backpack, Phantom) and custodianship.
This pattern, paired with the geometric growth trend, suggests Solana’s DeFi ecosystem is entering a new structural bull phase, underpinned by both technical confirmation and fundamental evolution.
Anyways, let me know in the comments 3 reasons not to be bullish on Solana as we speak.
(PS: QC-resistant issues don’t apply only for Solana but for all major crypto assets!)

DOGE Ready for PUMP or what ?The price is within a descending triangle, which is discouraging, but this market often behaves contrary to these patterns, and it could be the start of a new price increase. I won’t fall for these patterns anymore.
Best regards CobraVanguard.💚

BTCUSDBTCUSD | Quiet Market Play – Conditional | Trade Based On Bearish Candle Closure
After a sharp upward move, price is now losing momentum and consolidating.
Currently entering a short position after breaking the resistance
Trade includes full risk management, marked on chart. 🔴📉
