ADA/USDT – Mid-Term Technical Analysis
Cardano has just bounced from a key FIBO support zone (0.618–0.786), suggesting that the correction may have bottomed out and a bullish reversal is in play.
📍 Current Price: $0.6235
🎯 Target 1: $0.9989
🎯 Target 2: $1.2164
🎯 Target 3: $1.3795
Crypto market

$SUI/USDT Technical Analysis
Major Bounce from FIBO ZONE 📈
SUI has just bounced off the golden Fibonacci retracement zone (0.618–0.786), confirming it as strong dynamic support. This move comes after a healthy correction from previous highs.
📍 Current Price: $3.0816
🎯 Target 1: $4.8865
🎯 Target 2: $7.4445
🛡 Invalidation Level: Weekly close below $2.40 may signal weakness

Bull Market Action Exposed—Bitcoin Cash Growing 91 Days Non-StopWhat we are seeing now is very different compared to the past. If you look at early 2024 the rise was composed of strong big candles, always fast as if in a hurry. Very strong growth. If we go further and consider late 2024, we got a lower high but still very big candles. Fast forward to present day 2025, and we have a perfect uptrend, prices rising week after week after week with relatively small candles, some medium-sized but not as big as before. This is bull market action.
In the past, the candles were really big because the bullish action was soon to end, it wasn't expected to last a long time and thus everything needs to be accomplished fast. Things are different now. The fact that we have slow and steady growth is good news. Since the market is going to be growing for a prolonged period of time, the candles are smaller.
Don't be fooled by current price action, it all ends up in a major bull-run. While the candles are small now you can take it as bullish consolidation. Prices are growing but this is still a sort of accumulation/build-up phase. Everything is building up to a very strong climax with new all-time highs all-across and then some more.
Bitcoin Cash has been growing straight up for 91 days. In June 2023, Bitcoin Cash produced only two weeks green. Back in late 2024 all the growth happened in 28 days. Early 2024 56 days was all that was needed and then the market turned red. This is the longest stretch of continued growth since 2021... Yes, the previous bull market. You are witnessing bull market action.
Thanks a lot for your continued support.
Namaste.

Scalp long MagicJust wanna scalp long here for w5 formation. taarget recent high or a conservative of 0.2117

BTCUSDT – Calm Before the BreakoutBitcoin is holding firmly above the ascending trendline, consolidating within the accumulation range of $98,000 to $117,000. The current structure suggests that buyers remain in control, especially after a strong rebound from the $98,450 support zone.
In terms of news, BTC has been slightly affected by market concerns over new U.S. tariffs. However, on-chain data still shows strong accumulation around the $108,000 level. If this base holds, BTCUSDT could break out toward the $117,424 target in the near term. Conversely, if the trendline fails, the $98,000 level will be the final stronghold for the bulls.

COW/USDTKey Level Zone: 0.3060 - 0.3120
LMT v2.0 detected.
The setup looks promising—price previously trended upward with rising volume and momentum, then retested this zone cleanly. This presents an excellent reward-to-risk opportunity if momentum continues to align.
Introducing LMT (Levels & Momentum Trading)
- Over the past 3 years, I’ve refined my approach to focus more sharply on the single most important element in any trade: the KEY LEVEL.
- While HMT (High Momentum Trading) served me well—combining trend, momentum, volume, and structure across multiple timeframes—I realized that consistently identifying and respecting these critical price zones is what truly separates good trades from great ones.
- That insight led to the evolution of HMT into LMT – Levels & Momentum Trading.
Why the Change? (From HMT to LMT)
Switching from High Momentum Trading (HMT) to Levels & Momentum Trading (LMT) improves precision, risk control, and confidence by:
- Clearer Entries & Stops: Defined key levels make it easier to plan entries, stop-losses, and position sizing—no more guesswork.
- Better Signal Quality: Momentum is now always checked against a support or resistance zone—if it aligns, it's a stronger setup.
- Improved Reward-to-Risk: All trades are anchored to key levels, making it easier to calculate and manage risk effectively.
- Stronger Confidence: With clear invalidation points beyond key levels, it's easier to trust the plan and stay disciplined—even in tough markets.
Whenever I share a signal, it’s because:
- A high‐probability key level has been identified on a higher timeframe.
- Lower‐timeframe momentum, market structure and volume suggest continuation or reversal is imminent.
- The reward‐to‐risk (based on that key level) meets my criteria for a disciplined entry.
***Please note that conducting a comprehensive analysis on a single timeframe chart can be quite challenging and sometimes confusing. I appreciate your understanding of the effort involved.
Important Note: The Role of Key Levels
- Holding a key level zone: If price respects the key level zone, momentum often carries the trend in the expected direction. That’s when we look to enter, with stop-loss placed just beyond the zone with some buffer.
- Breaking a key level zone: A definitive break signals a potential stop‐out for trend traders. For reversal traders, it’s a cue to consider switching direction—price often retests broken zones as new support or resistance.
My Trading Rules (Unchanged)
Risk Management
- Maximum risk per trade: 2.5%
- Leverage: 5x
Exit Strategy / Profit Taking
- Sell at least 70% on the 3rd wave up (LTF Wave 5).
- Typically sell 50% during a high‐volume spike.
- Move stop‐loss to breakeven once the trade achieves a 1.5:1 R:R.
- Exit at breakeven if momentum fades or divergence appears.
The market is highly dynamic and constantly changing. LMT signals and target profit (TP) levels are based on the current price and movement, but market conditions can shift instantly, so it is crucial to remain adaptable and follow the market's movement.
If you find this signal/analysis meaningful, kindly like and share it.
Thank you for your support~
Sharing this with love!
From HMT to LMT: A Brief Version History
HM Signal :
Date: 17/08/2023
- Early concept identifying high momentum pullbacks within strong uptrends
- Triggered after a prior wave up with rising volume and momentum
- Focused on healthy retracements into support for optimal reward-to-risk setups
HMT v1.0:
Date: 18/10/2024
- Initial release of the High Momentum Trading framework
- Combined multi-timeframe trend, volume, and momentum analysis.
- Focused on identifying strong trending moves high momentum
HMT v2.0:
Date: 17/12/2024
- Major update to the Momentum indicator
- Reduced false signals from inaccurate momentum detection
- New screener with improved accuracy and fewer signals
HMT v3.0:
Date: 23/12/2024
- Added liquidity factor to enhance trend continuation
- Improved potential for momentum-based plays
- Increased winning probability by reducing entries during peaks
HMT v3.1:
Date: 31/12/2024
- Enhanced entry confirmation for improved reward-to-risk ratios
HMT v4.0:
Date: 05/01/2025
- Incorporated buying and selling pressure in lower timeframes to enhance the probability of trending moves while optimizing entry timing and scaling
HMT v4.1:
Date: 06/01/2025
- Enhanced take-profit (TP) target by incorporating market structure analysis
HMT v5 :
Date: 23/01/2025
- Refined wave analysis for trending conditions
- Incorporated lower timeframe (LTF) momentum to strengthen trend reliability
- Re-aligned and re-balanced entry conditions for improved accuracy
HMT v6 :
Date : 15/02/2025
- Integrated strong accumulation activity into in-depth wave analysis
HMT v7 :
Date : 20/03/2025
- Refined wave analysis along with accumulation and market sentiment
HMT v8 :
Date : 16/04/2025
- Fully restructured strategy logic
HMT v8.1 :
Date : 18/04/2025
- Refined Take Profit (TP) logic to be more conservative for improved win consistency
LMT v1.0 :
Date : 06/06/2025
- Rebranded to emphasize key levels + momentum as the core framework
LMT v2.0
Date: 11/06/2025

BTCUSD · 3D — Bearish Divergence + Volume Drop Suggest Pullback
🧠 Setup Overview
Bitcoin is showing signs of exhaustion after a parabolic rally:
Bearish divergence is visible on the 3D RSI — price made higher highs while RSI made lower highs.
Volume is shrinking with each push up, suggesting buyer momentum is fading.
Price is pressing into all-time highs without conviction, signaling potential for a pullback.
🔻 Downside Targets
Target 🎯 Level Why It Matters
Target 1 $92,300 (50% Fib) Midpoint of last impulse + first strong demand area.
Target 2 $82,500 (61.8% Fib) Volume-profile support + key confluence zone.
🔎 What Confirms the Setup?
Breakdown below $108K structure
Daily close below $105K with increasing volume
RSI losing midline support = momentum shift confirmed
❌ Invalidation
Daily close > $112K with strong volume = idea invalid
Would suggest continuation toward blue-sky breakout
✅ Summary
Bearish divergence + volume drop = classic topping signals
Risk is well-defined, with Fib-backed targets offering clean R:R
Trade cautiously — momentum is fading, not gone yet
📛 Disclaimer: This is not financial advice. Do your own research and manage risk according to your plan.
#Bitcoin #BTC #CryptoAnalysis #BearishDivergence #RSI #VolumeProfile #Fibonacci #TradingView

SOL Triangle Breakout + Fib Confluence – Aiming for $190+Solana (SOLUSD) just broke out of a multi-month triangle on the 8H chart, signaling a potential reversal and continuation toward previous highs.
Key Highlights:
🔹 Break of Structure (BOS): Price broke through descending resistance, flipping momentum in the bulls’ favor.
🔹 Fibonacci Confluence: Bounce came cleanly from the 0.5–0.618 zone ($129–$140), adding high-probability support.
🔹 Triangle Apex Break: Consolidation is over — the arrow is launched.
🔹 Targeting Previous Highs: $185–$190 range is in sight, with historical resistance marked.
🔹 Risk Defined: Stop idea near the previous low and triangle base (~$115).
⚠️ Watch for confirmation candle closes and volume follow-through — the move is just beginning.

BTCUSD · 3D — Bearish Divergence + Volume Drop Suggest Pullback
🧠 Setup Overview
Bitcoin is showing signs of exhaustion after a parabolic rally:
Bearish divergence is visible on the 3D RSI — price made higher highs while RSI made lower highs.
Volume is shrinking with each push up, suggesting buyer momentum is fading.
Price is pressing into all-time highs without conviction, signaling potential for a pullback.
🔻 Downside Targets
Target 🎯 Level Why It Matters
Target 1 $93,300 (50% Fib) Midpoint of last impulse + first strong demand area.
Target 2 $82,500 (61.8% Fib) Volume-profile support + key confluence zone.
🔎 What Confirms the Setup?
Breakdown below $108K structure
Daily close below $105K with increasing volume
RSI losing midline support = momentum shift confirmed
❌ Invalidation
Daily close > $112K with strong volume = idea invalid
Would suggest continuation toward blue-sky breakout
✅ Summary
Bearish divergence + volume drop = classic topping signals
Risk is well-defined, with Fib-backed targets offering clean R:R
Trade cautiously — momentum is fading, not gone yet
📛 Disclaimer: This is not financial advice. Do your own research and manage risk according to your plan.
#Bitcoin #BTC #CryptoAnalysis #BearishDivergence #RSI #VolumeProfile #Fibonacci #TradingView

Ethereum Breakout Brewing: Higher Lows Point to $4,100Ethereum is showing signs of a major breakout setup on the 8H chart. The historical price action reveals a well-defined horizontal range, with ETH respecting the $2,200–$2,950 demand zone multiple times.
Key highlights:
🔹 Strong Reclaim: Price reclaimed the key range low around $2,300 with momentum.
🔹 Higher Lows Forming: Each bounce from support has built more bullish structure.
🔹 Targeting Range High Breakout: ETH has launched toward ~$4,100 after each reclaim.
🔹 Current Resistance: $2,950 remains the final barrier before blue sky.
If ETH can break and hold above that zone, historical structure suggests a move toward $4,100+ is well within reach.

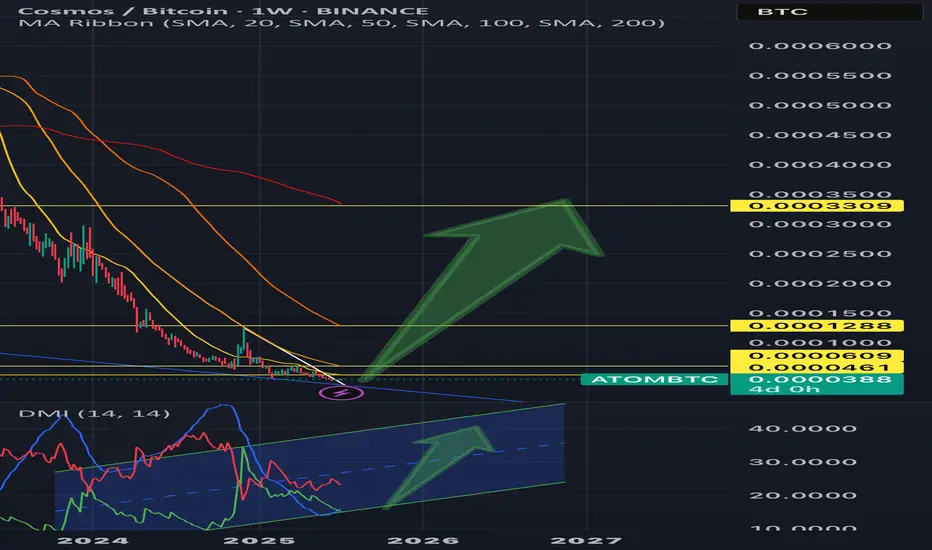
ATOM | COSMOS - REVERSAL SIGNALS & KEY LEVELS💫Here’s a detailed weekly ATOM/BTC analysis—focusing heavily on the Directional Movement Index (DMI) combo—and a forward-looking forecast.
💫 While ATOM/BTC is currently in a strong downtrend, the presence of bullish RSI divergence on a weekly scale suggests that the strength of this trend may be fading, opening the door for a possible upside shift.
💫 Trend Shift Scenarios:
👎 Bearish continuation if:
• –DI remains above +DI, AND
• ADX sustains above 30, reinforcing downtrend strength.
👍Bullish reversal begins when:
• +DI crosses above –DI on the weekly chart, and its starting to curve;)
• ADX remains elevated or climbs, confirming the new uptrend.
📉 Bear scenario:
If +DI continues to lag and ADX remains strong—price may retest recent support levels in BTC terms (around 0.000037–0.000038 levels.)
📈 Bull scenario:
Look for +DI to crossover above –DI while ADX sustains high values. Weekly RSI divergence (already visible!!!!) supports this &suggests potential 30–50% upside if ATOM breaks out against BTC resistance.
💫 Price Target:
In such a breakout, expect ATOM to outperform BTC by ~30–40% short-term, with room for up to 100% upside if momentum builds more!
💫 Summary
Weekly ATOM/BTC shows a strong downtrend (–DI > +DI, ADX ~33), but bullish RSI divergence hints at a possible reversal.
💢Catalyst: +DI crossing above –DI with ADX sustaining signal strength.
💢Potential: 30–50% upside short-term, 100% mid-term if breakout holds.
💢Plan: watch weekly DMI/ADX and price action in 0.000037–0.000038 BTC range, manage risk with stop-loss under support.
*Noteable: Also Watch RSI confirmation: upward breakout off of divergence is a strong signal.
Bittensor Goes Bullish · $1,107 Price Target Within 6 MonthsHere is a very interesting piece of information. The same 22-June low worked as support back in September 2024. Needless to say, the test of this level propelled a major bullish phase. Conditions are similar now, not the same but similar. Bittensor is stronger now compared to late 2024, so we can expect the bullish wave that follows also to be stronger and thus a $1,107 price target mid- to long-term. Within 3 to 6 months.
Today we have a bullish breakout from the current structure with confirmation of long-term support and the higher low. TAOUSDT is now entering a new wave of growth. This is a long-term event, this wave should last all through 2025 and possibly beyond.
You can find additional details on the chart.
Leave a comment if you have any questions. Follow if you enjoy the content and would like to see more.
Namaste.

$BTC Tapping ATH - Is this REAL!?YUUUGE Daily Close today for CRYPTOCAP:BTC
Bullish cross on the 20/50MA.
Appears to have broken out of a bull flag.
Need PA to stay within this POI in order to confirm another leg up.

Kaspa Bullish · The Wait is Over · Ready to GrowWe have a very interesting situation here with the Kaspa chart, KASUSDT. There is no going back. Once the bottom is in, you know the next logical step is a change of trend. It can take some time before the low settles; the low is process not a one-day event. But here it settled already and this is all we need to know that the bullish bias is fully confirmed. You can now enter KASUSDT with lev while resting easy.
Good evening my fellow Cryptocurrency trader, I hope you are having a wonderful day.
The first low happened 10-March and then a lower and final low 7-April, also a technical double-bottom. Here Kaspa produces a small reaction and grows 150%. Notice that growing 150% in 30 days is small in the Crypto-world. If you were trading conventional markets, you would have to wait 10 years to get 70% growth.
Anyway, the initial bullish reaction to confirm the end of the correction goes into retrace and 16-June (the week), 22-June specifically, the market produces a higher low. This is the final retrace before maximum growth. I mean, there will be retraces and corrections in the future but the wave that is about to start now will not be 150%, it can be much bigger and last a lot longer, this is the 2025 bull market bullish phase. It will be a major wave.
This is just a friendly reminder to let you know, you can go all-in.
Thanks a lot for your continued support.
You will be happy with the results.
Namaste.

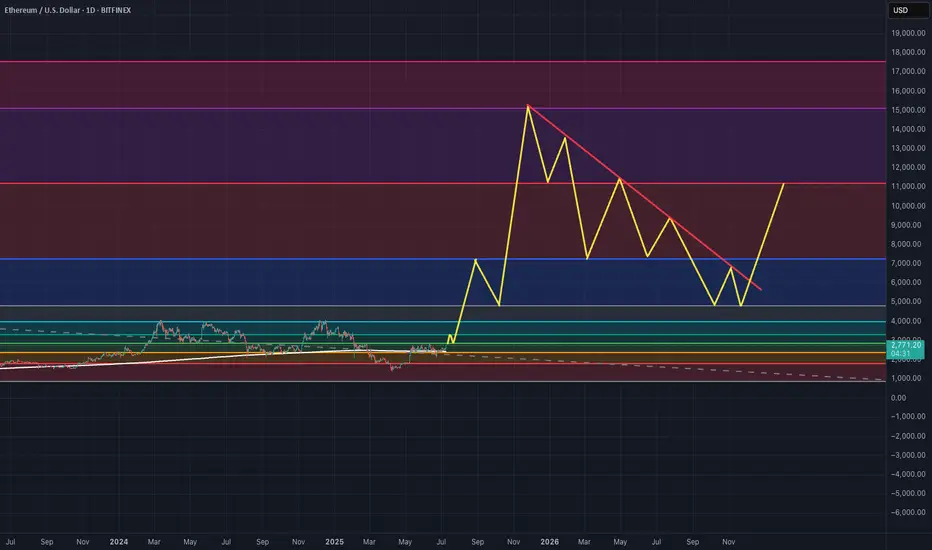
ETH ($11k - $15k) Overextend to $20k This is my idea for ETH H2 2025 - H2 2026. The pattern is still being conservative because i can see it going to almost $20k.
BTC Flag Pattern's Target @ 145,XXX $ [10/07/2025]🚀 BTC Breakout from Flag Pattern: Aiming for $145,000!
Bitcoin has just broken out of a textbook Flag Pattern, a bullish continuation signal that suggests the rally is far from over. Traders jumped in as price pierced through resistance with rising volume—classic breakout behavior. Stop-loss placed below the flag, profit target measured from the flagpole... all signs point to upward momentum.
🎯 Target? $145,000.
🔥 The rocket has launched, and it's not looking back. Fasten your seatbelt and cheer it on—let’s go, BTC! Make that flag fly high and beyond! 🤑🚀

SOPH/USDTKey Level Zone: 0.032600 - 0.033200
LMT v2.0 detected.
The setup looks promising—price previously trended upward with rising volume and momentum, then retested this zone cleanly. This presents an excellent reward-to-risk opportunity if momentum continues to align.
Introducing LMT (Levels & Momentum Trading)
- Over the past 3 years, I’ve refined my approach to focus more sharply on the single most important element in any trade: the KEY LEVEL.
- While HMT (High Momentum Trading) served me well—combining trend, momentum, volume, and structure across multiple timeframes—I realized that consistently identifying and respecting these critical price zones is what truly separates good trades from great ones.
- That insight led to the evolution of HMT into LMT – Levels & Momentum Trading.
Why the Change? (From HMT to LMT)
Switching from High Momentum Trading (HMT) to Levels & Momentum Trading (LMT) improves precision, risk control, and confidence by:
- Clearer Entries & Stops: Defined key levels make it easier to plan entries, stop-losses, and position sizing—no more guesswork.
- Better Signal Quality: Momentum is now always checked against a support or resistance zone—if it aligns, it's a stronger setup.
- Improved Reward-to-Risk: All trades are anchored to key levels, making it easier to calculate and manage risk effectively.
- Stronger Confidence: With clear invalidation points beyond key levels, it's easier to trust the plan and stay disciplined—even in tough markets.
Whenever I share a signal, it’s because:
- A high‐probability key level has been identified on a higher timeframe.
- Lower‐timeframe momentum, market structure and volume suggest continuation or reversal is imminent.
- The reward‐to‐risk (based on that key level) meets my criteria for a disciplined entry.
***Please note that conducting a comprehensive analysis on a single timeframe chart can be quite challenging and sometimes confusing. I appreciate your understanding of the effort involved.
Important Note: The Role of Key Levels
- Holding a key level zone: If price respects the key level zone, momentum often carries the trend in the expected direction. That’s when we look to enter, with stop-loss placed just beyond the zone with some buffer.
- Breaking a key level zone: A definitive break signals a potential stop‐out for trend traders. For reversal traders, it’s a cue to consider switching direction—price often retests broken zones as new support or resistance.
My Trading Rules (Unchanged)
Risk Management
- Maximum risk per trade: 2.5%
- Leverage: 5x
Exit Strategy / Profit Taking
- Sell at least 70% on the 3rd wave up (LTF Wave 5).
- Typically sell 50% during a high‐volume spike.
- Move stop‐loss to breakeven once the trade achieves a 1.5:1 R:R.
- Exit at breakeven if momentum fades or divergence appears.
The market is highly dynamic and constantly changing. LMT signals and target profit (TP) levels are based on the current price and movement, but market conditions can shift instantly, so it is crucial to remain adaptable and follow the market's movement.
If you find this signal/analysis meaningful, kindly like and share it.
Thank you for your support~
Sharing this with love!
From HMT to LMT: A Brief Version History
HM Signal :
Date: 17/08/2023
- Early concept identifying high momentum pullbacks within strong uptrends
- Triggered after a prior wave up with rising volume and momentum
- Focused on healthy retracements into support for optimal reward-to-risk setups
HMT v1.0:
Date: 18/10/2024
- Initial release of the High Momentum Trading framework
- Combined multi-timeframe trend, volume, and momentum analysis.
- Focused on identifying strong trending moves high momentum
HMT v2.0:
Date: 17/12/2024
- Major update to the Momentum indicator
- Reduced false signals from inaccurate momentum detection
- New screener with improved accuracy and fewer signals
HMT v3.0:
Date: 23/12/2024
- Added liquidity factor to enhance trend continuation
- Improved potential for momentum-based plays
- Increased winning probability by reducing entries during peaks
HMT v3.1:
Date: 31/12/2024
- Enhanced entry confirmation for improved reward-to-risk ratios
HMT v4.0:
Date: 05/01/2025
- Incorporated buying and selling pressure in lower timeframes to enhance the probability of trending moves while optimizing entry timing and scaling
HMT v4.1:
Date: 06/01/2025
- Enhanced take-profit (TP) target by incorporating market structure analysis
HMT v5 :
Date: 23/01/2025
- Refined wave analysis for trending conditions
- Incorporated lower timeframe (LTF) momentum to strengthen trend reliability
- Re-aligned and re-balanced entry conditions for improved accuracy
HMT v6 :
Date : 15/02/2025
- Integrated strong accumulation activity into in-depth wave analysis
HMT v7 :
Date : 20/03/2025
- Refined wave analysis along with accumulation and market sentiment
HMT v8 :
Date : 16/04/2025
- Fully restructured strategy logic
HMT v8.1 :
Date : 18/04/2025
- Refined Take Profit (TP) logic to be more conservative for improved win consistency
LMT v1.0 :
Date : 06/06/2025
- Rebranded to emphasize key levels + momentum as the core framework
LMT v2.0
Date: 11/06/2025


₿itcoin: ATHBitcoin recently marked a new all time high. Our primary expectation is for an even bigger breakout to the upside, allowing green wave B to reach its peak within the upper blue Target Zone between $117,553 and $130,891. After this corrective high, we anticipate a sharp sell-off during green wave C, which should drive Bitcoin down into the lower blue Target Zone between $62,395 and $51,323—where we also expect the low of the larger orange wave a. This move should, for now, signal the start of another corrective rally along orange wave b, with a retest of the freshly marked all-time high well within reach. Once this countertrend move concludes, another significant decline should follow as orange wave c develops, targeting the low of the higher-level blue wave (ii). Alternatively, there remains a 30% chance that the preceding wave alt.(i) is still in progress, which could result in a direct breakout above resistance at $130,891.
📈 Over 190 precise analyses, clear entry points, and defined Target Zones - that's what we do.

ARB/USDT Analysis – Potential Breakout Ahead?📅 Timeframe: 1D
💰 Current Price: $0.3559 (+5.33%)
📊 Volume Spike: 389.18M
ARB is currently testing a descending trendline resistance that's been respected since mid-May. Price action has formed a base around the $0.35 level and is now showing signs of strength with a recent bullish candle.
📈 Key Levels:
Resistance to Watch: $0.37 - $0.38 (trendline + horizontal level)
Breakout Target: $0.45 - $0.55 zone if the breakout is confirmed
Support: $0.33 - $0.34 range
🧠 Bullish Scenario:
If ARB can break and close above the trendline with volume, a potential retest and continuation move could take price towards the $0.45-$0.55 area.
🛑 Invalidation:
A daily close below $0.33 may signal weakness and delay the bullish breakout.
📌 Watch for:
Break and retest confirmation
Volume confirmation on breakout
RSI and momentum support
📉 Not financial advice. Always do your own research. #ARB #Crypto #Breakout #TechnicalAnalysis #Altcoins #TradingView


Resistance zone: 3265.0-3321.30
Hello, traders.
If you "Follow", you can always get the latest information quickly.
Have a nice day today.
-------------------------------------
(ETHUSDT 1D chart)
It is showing an upward breakout of the important zone of 2419.83-2706.15.
We need to see if the price can be maintained by rising above the Fibonacci ratio of 0.5 (2788.93).
If so, it is expected to rise to the resistance zone of 3265.0-3321.30.
The important zone of 2419.83-2706.15 is the support and resistance zone that can lead to a full-fledged uptrend.
Therefore, if it falls below this zone, we should stop trading and watch the situation.
-
Thank you for reading to the end.
I hope you have a successful trade.
--------------------------------------------------
- This is an explanation of the big picture.
(3-year bull market, 1-year bear market pattern)
I will explain more details when the bear market starts.
------------------------------------------------------

$BTC - Much Higher or Much Lower. EoY '26I'm not gonna lie, I drew these lines with my balls. I use them to move my cursor on my computer monitor.
This is not financial advice. This is just how my deep gut instinct likes to draw brushstrokes.
I gave 4 optional trajectories.
These will likely not happen, nor is it likely that the Price Action and Valuation will stay within these lines.
Enjoy and Happy Trading!
Mr. Storm
