$aave/usdt short zonesth:
intraday short zone: htf + ltf liq + htf 78.6 fib + sh
swing short zone: htf + ltf liq + ote zone + bat & butterfly bearish harmonic
Crypto market

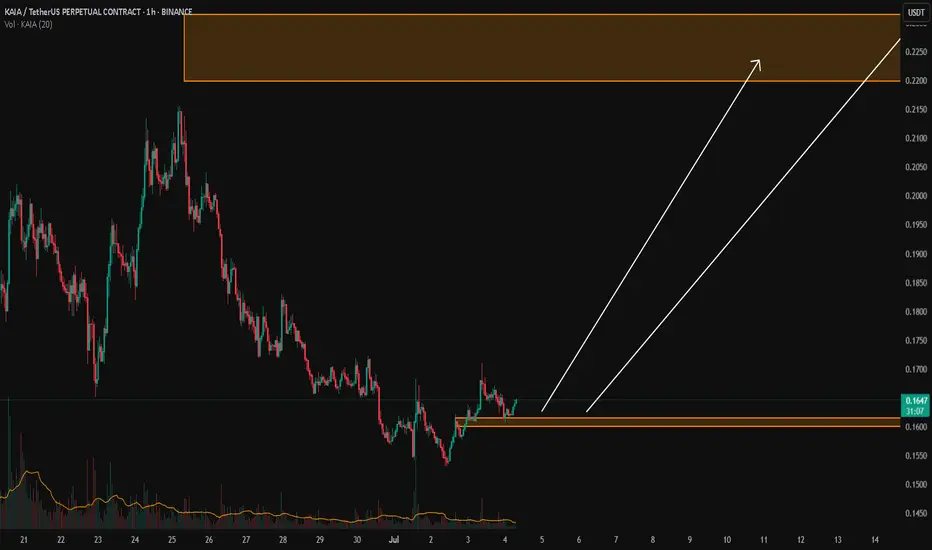
KAIA/USDTKey Level Zone: 0.1600 - 0.1615
LMT v2.0 detected.
The setup looks promising—price previously trended upward with rising volume and momentum, then retested this zone cleanly. This presents an excellent reward-to-risk opportunity if momentum continues to align.
Introducing LMT (Levels & Momentum Trading)
- Over the past 3 years, I’ve refined my approach to focus more sharply on the single most important element in any trade: the KEY LEVEL.
- While HMT (High Momentum Trading) served me well—combining trend, momentum, volume, and structure across multiple timeframes—I realized that consistently identifying and respecting these critical price zones is what truly separates good trades from great ones.
- That insight led to the evolution of HMT into LMT – Levels & Momentum Trading.
Why the Change? (From HMT to LMT)
Switching from High Momentum Trading (HMT) to Levels & Momentum Trading (LMT) improves precision, risk control, and confidence by:
- Clearer Entries & Stops: Defined key levels make it easier to plan entries, stop-losses, and position sizing—no more guesswork.
- Better Signal Quality: Momentum is now always checked against a support or resistance zone—if it aligns, it's a stronger setup.
- Improved Reward-to-Risk: All trades are anchored to key levels, making it easier to calculate and manage risk effectively.
- Stronger Confidence: With clear invalidation points beyond key levels, it's easier to trust the plan and stay disciplined—even in tough markets.
Whenever I share a signal, it’s because:
- A high‐probability key level has been identified on a higher timeframe.
- Lower‐timeframe momentum, market structure and volume suggest continuation or reversal is imminent.
- The reward‐to‐risk (based on that key level) meets my criteria for a disciplined entry.
***Please note that conducting a comprehensive analysis on a single timeframe chart can be quite challenging and sometimes confusing. I appreciate your understanding of the effort involved.
Important Note: The Role of Key Levels
- Holding a key level zone: If price respects the key level zone, momentum often carries the trend in the expected direction. That’s when we look to enter, with stop-loss placed just beyond the zone with some buffer.
- Breaking a key level zone: A definitive break signals a potential stop‐out for trend traders. For reversal traders, it’s a cue to consider switching direction—price often retests broken zones as new support or resistance.
My Trading Rules (Unchanged)
Risk Management
- Maximum risk per trade: 2.5%
- Leverage: 5x
Exit Strategy / Profit Taking
- Sell at least 70% on the 3rd wave up (LTF Wave 5).
- Typically sell 50% during a high‐volume spike.
- Move stop‐loss to breakeven once the trade achieves a 1.5:1 R:R.
- Exit at breakeven if momentum fades or divergence appears.
The market is highly dynamic and constantly changing. LMT signals and target profit (TP) levels are based on the current price and movement, but market conditions can shift instantly, so it is crucial to remain adaptable and follow the market's movement.
If you find this signal/analysis meaningful, kindly like and share it.
Thank you for your support~
Sharing this with love!
From HMT to LMT: A Brief Version History
HM Signal :
Date: 17/08/2023
- Early concept identifying high momentum pullbacks within strong uptrends
- Triggered after a prior wave up with rising volume and momentum
- Focused on healthy retracements into support for optimal reward-to-risk setups
HMT v1.0:
Date: 18/10/2024
- Initial release of the High Momentum Trading framework
- Combined multi-timeframe trend, volume, and momentum analysis.
- Focused on identifying strong trending moves high momentum
HMT v2.0:
Date: 17/12/2024
- Major update to the Momentum indicator
- Reduced false signals from inaccurate momentum detection
- New screener with improved accuracy and fewer signals
HMT v3.0:
Date: 23/12/2024
- Added liquidity factor to enhance trend continuation
- Improved potential for momentum-based plays
- Increased winning probability by reducing entries during peaks
HMT v3.1:
Date: 31/12/2024
- Enhanced entry confirmation for improved reward-to-risk ratios
HMT v4.0:
Date: 05/01/2025
- Incorporated buying and selling pressure in lower timeframes to enhance the probability of trending moves while optimizing entry timing and scaling
HMT v4.1:
Date: 06/01/2025
- Enhanced take-profit (TP) target by incorporating market structure analysis
HMT v5 :
Date: 23/01/2025
- Refined wave analysis for trending conditions
- Incorporated lower timeframe (LTF) momentum to strengthen trend reliability
- Re-aligned and re-balanced entry conditions for improved accuracy
HMT v6 :
Date : 15/02/2025
- Integrated strong accumulation activity into in-depth wave analysis
HMT v7 :
Date : 20/03/2025
- Refined wave analysis along with accumulation and market sentiment
HMT v8 :
Date : 16/04/2025
- Fully restructured strategy logic
HMT v8.1 :
Date : 18/04/2025
- Refined Take Profit (TP) logic to be more conservative for improved win consistency
LMT v1.0 :
Date : 06/06/2025
- Rebranded to emphasize key levels + momentum as the core framework
LMT v2.0
Date: 11/06/2025
Ethereum: Eyeing New Highs?Ethereum has surged recently and continues rising in turquoise wave B. The next target is a break above the June high, with potential upside to resistance at $4,107. A direct breakout above this level (27% probability) would suggest green wave alt. ended in April. However, our main scenario expects a reversal below $4,107, with turquoise wave C likely dragging ETH into the Long Target Zone between $935.82 and $494.15 to complete wave .
📈 Over 190 precise analyses, clear entry points, and defined Target Zones - that's what we do.

AAVE Potential 1-2/1-2I´m keeping an eye on a quick pullback on AAVE for a potential 1-2/1-2.
The thesis is that black 2 finished in the 50% pullback and we´re currently finishing blue 1.
Blue 2´s pullback would be a great opportunity for long trades with a very tight stop loss.
The gray zone, with gave us a fake breakout for black 1, may be the temporary resistance for blue 1.

Cookieusdt trading opportunityCOOKIEUSDT has broken down from its rising channel and is now heading toward a potential reversal zone. If price finds support and reacts positively from this area, a move toward the important supply zone is expected. A confirmed breakout above this supply zone would open the path toward the projected final target, as outlined on the chart.

NEAR Breakout Confirmed—But Is This Just a Bull Trap?Yello Paradisers! Did you see that breakout on #NEARUSDT? After weeks of consistent lower highs and a clearly defined descending resistance, price action has finally snapped that bearish structure and completed a textbook inverse Head and Shoulders formation on the 12H chart. This kind of pattern doesn’t appear often at key cycle points, and when it does—especially with confirmation—it becomes a high-probability signal of a trend reversal.
💎#NEARUSDT ,The neckline of the inverse H&S, sitting around the $2.17–$2.23 zone, has now been broken and crucially retested as support. This means the former resistance is now acting as a probable base for bulls, and if price remains above this area, the market is likely preparing for a strong probable impulsive move to the upside.
💎The structure shows clear bullish intent, and from a technical perspective, the first resistance comes in at $2.72. A clean break above that could open the door toward the major resistance zone between $2.97 and $3.05, which would complete the projected breakout target of the H&S pattern.
💎If bulls manage to maintain control above the $2.17–$2.23 support zone, we expect price to slowly build momentum toward $2.72, with increased volatility likely once that level is tested. Should that break occur with volume, the next leg may extend rapidly into the major resistance zone. However, if price fails to hold above this flipped support zone, we will be closely watching the $2.02–$1.89 area as the last major support before invalidation.
💎A daily candle closing below $1.798 would invalidate this entire bullish thesis and put the market back into a neutral-to-bearish range.
💎Adding more probability to this setup, NEAR is now trading above multi-timeframe EMA on higher time frame. This multi-timeframe EMA alignment supports bullish continuation, as momentum begins to shift in favor of buyers. However, continuation depends heavily on how price reacts at each resistance level—especially as we enter the mid-$2.70s.
💎The probable move from here is bullish, with the expectation that NEAR pushes toward the $2.72 level in the short term, followed by a potential rally to $2.97–$3.05 if momentum sustains. This scenario remains valid as long as price holds above $2.17, and especially above $2.02. Below that, the structure weakens. Below $1.798, the bullish bias becomes fully invalidated.
This is the only way you will make it far in your crypto trading journey. Stay sharp and patient, Paradisers. It’s not about chasing pumps—it’s about positioning smartly before the crowd.
MyCryptoParadise
iFeel the success🌴

DOGE Short Term pullback prior to breaking trendI am bearish on Dogecoin for the next 10 days or so, but overall bullish to break the downward trend for months now.
Waiting for a break above the longterm downward then a retest would be the safest play. A more aggresive approach may be to put some orders in at the recent support levels with a stop loss near the recent lows.
Doge is a popular token and meme that has a large following. I think there are many long term holders than any other meme.

TP 138500 Locked Gold since bouncing from 74500 K btc in swing upwards pressure 1st target 🎯 is 138500 K to then drop or correction before continuation to 260 K get ready

BTC breakoutIf the daily candle closes above the trendline, a breakout toward a new all-time high is likely to occur very soon.


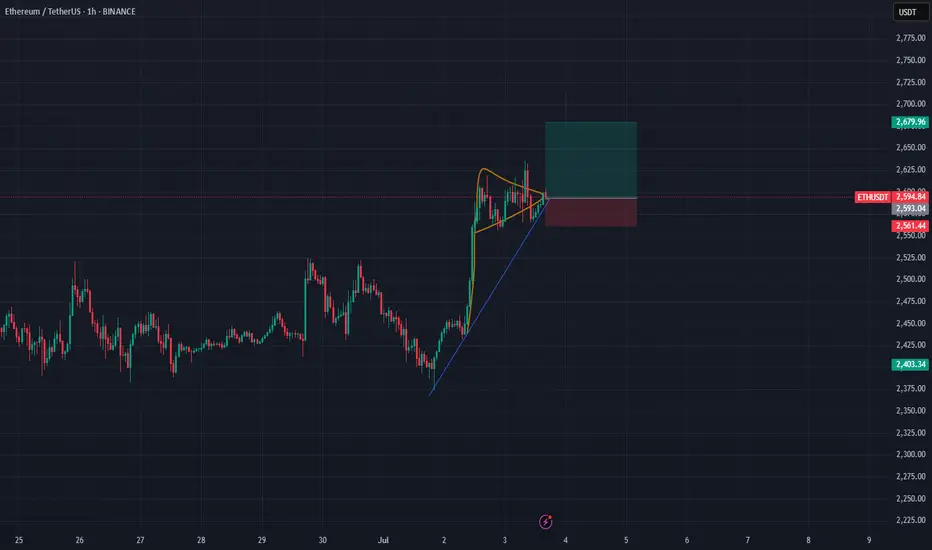
ETH/USDT – Symmetrical Triangle Breakout Setup (1H Chart)After a strong bullish impulse, ETH is consolidating in a symmetrical triangle formation — a classic continuation pattern. Price is coiling up near the apex, with higher lows forming against a horizontal resistance line.
Setup Highlights:
Pattern: Symmetrical Triangle (1H)
Trend: Bullish continuation after breakout
Entry Zone: ~2592 USDT
Target: 2679 USDT (upper green box)
Stop Loss: Below 2561 USDT (lower red box)
Risk-Reward: Favorable R:R structure
Watching closely for a decisive breakout above the triangle resistance to confirm bullish momentum continuation.
Let me know what you think — bullish continuation or fakeout risk?
#Ethereum #ETHUSDT #CryptoTrading #TechnicalAnalysis #BreakoutSetup #TradingView
CONSOLIDATIONfriends BTC will consolidate inside the channel for couple of days . if it break upside it will make all time high definitely. if it break downside there is chance of dump till 105k.

$LOT Price Showing Symmetrical Triangle Pattern & Breakout aboveASX:LOT is a League of Traders Trading Competition Platform. LOT is an Native token of this platform.
Every Trading Player Have LOT point and they convert to LOT token and get on there wallet. Who Join LOT Trading League for LOT point? The main competition is top level and get free price.
💡 TOKEN OVERVIEW ( ASX:LOT )
Market capitalization: 3.89 M USD
Fully diluted market cap : 25.90 M USD
Trading volume 24h: 2.89 M USD
All time high: 0.044869 USD
Circulating supply: 150.00 M
Max supply: 1.00 B
Total supply: 1.00 B
A new Native token Release on Binance Alpha and when it's release on Binance Coin than we will see more pumping this Native Token Price.
ASX:LOT price now at $0.026186 and this year 2025 I'm Prediction the price will be happened $0.45-$0.75 hit. If Biggest Tournament will start this year on this Platform. Than Possible to worldwide Tournament make more Pumping price. Because of the Big investor will become investment on this LOT native Token.
We have to decisions long-term investment this coin. The main thing is that some Coin will be scammed. But League of Traders Platform is the Legit of Cross Chain Trading Competition.
The Crypto Scammer will not Permission listed there token on the Top Exchange of Binance Market. #SUBROOFFICIAL
Disclaimer: This article is for informational purposes only and does not constitute financial advice. Always conduct your own research before making any investment decisions. Digital asset prices are subject to high market risk and price volatility. The value of your investment may go down or up, and you may not get back the amount invested. You are solely responsible for your investment decisions and Binance is not available for any losses you may incur. Past performance is not a reliable predictor of future performance. You should only invest in products you are familiar with and where you understand the risks. You should carefully consider your investment experience, financial situation, investment objectives and risk tolerance and consult an independent financial adviser prior to making any investment.

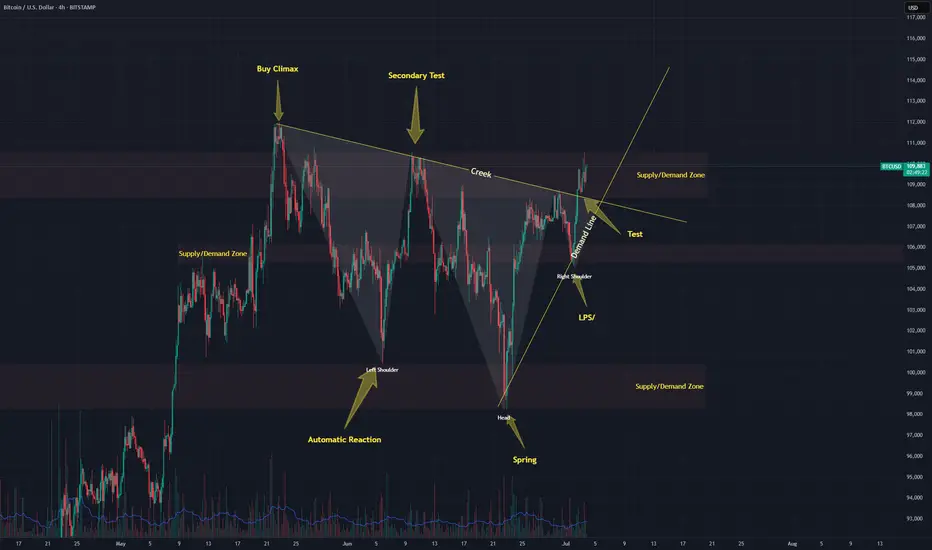
Markup coming for Bitcoin?I might have been entirely wrong about BTC. Are we finishing a re-accumulation pattern and about to markup?
Ugly inverted dandruff forming with the Wyckoff structure. Lets see what happens
#BTC #BITCOIN #WYCKOFF
IMX — Double Bottom & Weekly RSI Div1. Buy sweep of all-time low, spot weekly RSI divergence
2. Entry: Confirm double bottom or strong bounce
3. Main target: $0.81+ (super bullish if break/hold above)
4. Stop: Below all-time low — scenario invalid

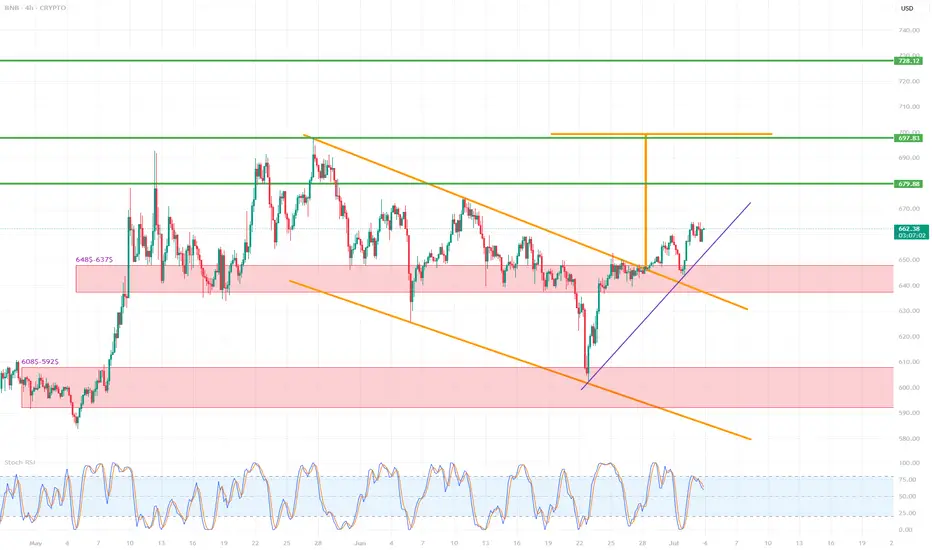
BNB/USD (4h interval)🔍 1. Chart structure
Instrument: Binance Coin / USD (BNB/USD)
Interval: 4 hours
📐 2. Technical formations
🔸 Breakout from the descending wedge formation
The descending wedge (orange lines) is a bullish formation - it suggests a potential breakout upwards.
The breakout occurred dynamically, with a large breakout candle (confirmation of the formation).
The goal of breaking out of the wedge is usually the height of the entire formation - this is marked with an orange arrow.
📈 Breakout range (target): around $697–710
🟢 Potential next targets:
697.83 (local resistance/projection result)
710.73 (main wedge height projection)
728.12 (strong resistance from history)
📊 3. Supports and resistances
🟥 Support zones (red rectangles):
$648.5–637.5 – previous resistance, now tested as support after the breakout.
$608.5–592.5 – strong support from previous lows.
🔼 Currently, the price has tested the upper support zone (648–637), reacted positively and continues to move up.
🟩 Resistance levels (green horizontal lines):
679.88 USD – local resistance, first target after breaking out of the wedge.
697.83 USD – projected range from the formation.
710.73 USD – full technical range of the breakout.
728.12 USD – strong resistance from history, may be a long-term target.
📉 4. Trends and support lines
Purple upward trend line – currently the price is above, which confirms the short-term upward trend.
Its break may lead to a retest of 648–637 USD.
Only below this zone can a larger correction be considered.
📈 5. Stochastic RSI indicator
Currently in the overbought zone (above 80).
Possible temporary cooling – signal for local correction / consolidation.
It is worth waiting for the indicator to go down to around 20 to re-enter the long.
✅ 6. Scenarios
🔼 Bullish (base) scenario:
Staying above 648–637 USD.
Maintaining the uptrend line.
Continuation to 679.88 → 697.83 → 710.73.
🔽 Bearish scenario:
Breaking the purple trend line.
Returning below 648 USD → going down to the 608–592 zone.
Negation of the breakout from the wedge.
📌 Final conclusions
Breaking out from the descending wedge is a strong pro-growth signal.
The price behaves in accordance with technical analysis, testing the previous resistance as support.
Currently, the retest and consolidation phase is underway – maintaining the trend line and the level of $648 will be key.
The medium-term target is $697–710.
C98USDT – Potential Impulse Wave 3 in Progress? | Elliott WaveHello traders! 🚀
Sharing a fresh Elliott Wave setup I'm currently monitoring on C98USDT (4H TF). The price structure is unfolding clearly and may be in the early phase of a classic 5-wave impulse.
After an impulsive move up completing Wave (1), the market corrected in a textbook ABC pattern down into a key demand zone, finishing Wave (2). We’re now seeing strong bullish momentum suggesting the beginning of Wave (3) – the longest and most aggressive wave in Elliott theory. ⚡
Trade Setup:
🟢 Entry Zone: 0.043 – 0.046
🔴 Stop Loss: 0.03913
🎯 Target Price: 0.05955
💡 Note: Always manage your risk and confirm with your own analysis before entering any trade.
Let me know your thoughts and wave count below! 👇
Happy trading! 🚀

One of My Most Profitable Crypto DOGEIt's Low BUY NOW BITFINEX:DOGEUSD
as you can tell barley anyone is talking about crypto, because it not rising, GOOD take advantage and buy the dip
Last year 2024 in January I've brought Dogecoin and by November I've gained +245% and took (200%) leaving the rest of my portfolio
Now it's another opportunity but now I'm telling you Guys & Girls BUY BUY BUY just Don't take my analyzation of the market LOOK AT IT, you can tell LONG TERM $$$ is on the way
BUy LoW SeLl High


Let's fire it up!BTC has to break $110,217.2 for good, and then I'd say we're off to the moon and beyond.

DOT - On The SpotEvening fellas,
Some say its dead, some say its asleep...
I'd stick with the second option, as to me, it's by far one of the best tech out there. Some say good tech doesn't matter, some say it does... Once again, I'll stick to the second option.
It could take a day, if they wanted... it might take years... but this is looking ahead, looking deep, looking for those big gains that change lives.
Trade thirsty...

LTCUSD - 3M CHARTYou tell me where the target of this 3M chart is. The higher the timeframe, the higher the probability to get the price targets…. Fundamentals are lined up. LFG!

BTC - Reaching to the highest resistance.Bitcoin is approaching its highest resistance zone ever. As it approaches this zone, we need to closely observe the reactions including:
- Price patterns
- Candlestick patterns
- BTC Chart.D
