Bitcoin long back to $110000Recently opened a long position on bitcoin. Aggressive entry. Soon I anticipate a push back up to 110000
4hr trend is still in tact. 1hr trend is bearish failed to make new LL.
Lets see how it goes.
2RR trade roughly.
Crypto market

XRP/USDT Trade Setup – 15minLondon session raided Asia's lows, grabbing liquidity and creating the conditions for a bullish reversal. This setup aligns with the NY session's typical continuation behavior following a London manipulation move.
Post-raid, price structure shifted bullish, indicating smart money accumulation. A clear fair value gap (FVG) formed, and entry was taken upon confirmation of bullish order flow.
Entry: 2.227
Stop Loss: 2.200
Take Profit: 2.400
Risk-Reward Ratio: 9.23R
Narrative:
London session swept Asia lows (liquidity engineered).
Break in market structure confirmed shift.
Entry aligned with FVG and order block mitigation.
Targeting inefficiency fill and liquidity above recent highs.
Note:
This trade is for journal purposes only and not financial advice.
Always perform your own analysis and manage risk accordingly.

Sonic (FTM) — RR Sweep & Accumulation Setup1. Wait for full sweep of weak lows (target $0.15)
2. Enter long only after reclaim above support zone
3. Macro target: $3.47+
4. If no strong low or reclaim, stay flat

FET/USDT Breakout Imminent? Preparing for a Major Rally!
🧠 Key Pattern: Descending Trendline Breakout
On the daily chart (1D), FET/USDT (Fetch.AI) has been consolidating under a strong descending trendline since its late 2024 highs. Currently, price action is coiling tightly just below this resistance, signaling a potential explosive breakout.
The price is trading near $0.72, right below the trendline — is this the calm before a major move?
🔍 Technical Analysis Overview
📉 Previous Downtrend Structure:
After peaking above $2, FET underwent a prolonged correction phase marked by lower highs and lower lows.
Sellers dominated for months, but the momentum is now shifting.
📈 Current Setup:
FET is forming a series of higher lows since March — an early sign of bullish reversal.
Volume is showing slight increases, which often precedes breakout attempts.
✅ Bullish Scenario (Breakout Rally)
If the price breaks and closes above the descending trendline (~$0.75–$0.78):
1. Initial Resistance: $0.818 → minor overhead supply zone.
2. Confirmation Level: $0.904 → breakout validation zone.
3. Major Upside Targets:
$1.225 → psychological resistance & previous consolidation level.
$1.599 & $1.809 → Fibonacci extension targets from prior impulse.
$2.147 – $2.195 → potential retest of the previous high.
📌 Upside Potential: Over +150%, if breakout is confirmed with strong volume and sustained momentum.
❌ Bearish Scenario (Rejection & Pullback)
If the price gets rejected from the trendline:
Possible pullback to $0.65, the recent higher low support.
Breakdown below this could extend the move toward $0.55 or even $0.47.
Major support: $0.345 → long-term demand zone.
📉 A failed breakout (fakeout) is possible if volume does not support the move.
📊 Trading Strategy Suggestions:
Breakout Entry: Above $0.78 with stop-loss below $0.70.
Retest Entry: Wait for a pullback to confirm support at the trendline after breakout.
Volume Confirmation is Critical — avoid chasing without strong bullish candles.
🧠 Narrative Bonus:
Fetch.AI remains one of the top AI-related projects in the crypto space. As the AI narrative resurfaces, a technical breakout could align with renewed fundamental attention — creating the perfect storm for a rally.
📌 Conclusion:
FET/USDT is positioned at a highly critical technical and psychological level. A confirmed breakout could initiate a large bullish wave, while rejection could drag the price lower. Manage your risk wisely and watch for volume cues.
#FETUSDT #FetchAI #BreakoutSetup #CryptoTrading #AltcoinRally #TechnicalAnalysis #DescendingTrendline #CryptoSignals #AIcoins

Btcusd techinical analysis.Btcusd.techinical analysis next move posibale at h1 time frame.not finchinical advice.

BITCOIN enroute towards $112+!If wave 4 gets rejected from the wicks of wave 1...It's likely off to the races towards new highs on a wave 5 north!
That's a good trade set up on any Instrument!

July 4 Bitcoin Bybit chart analysisHello
This is Bitcoin Guide.
If you "follow"
You can receive real-time movement paths and comment notifications on major sections.
If my analysis was helpful,
Please click the booster button at the bottom.
Here is the Bitcoin 30-minute chart.
There is no Nasdaq index announcement today.
There is a possibility that Nasdaq will fall sharply,
but even if it moves sideways, the probability of the strategy succeeding increases.
On the left, with the purple finger,
I connected the 2nd section of the long position that I entered yesterday.
*When the blue finger moves,
Bidirectional neutral
Short->Long or long waiting strategy
1. 109,638.1 dollars short position entry section / cut-off price when orange resistance line is broken
2. 108,764.4 dollars long position switching / cut-off price when green support line is broken
3. 110,273.1 dollars long position 1st target -> target price in order from Miracle
If the strategy is successful, I left a simulation with the pink finger,
so please refer to it.
Those who held long positions yesterday, please check if the purple support line is broken,
If it falls immediately from the current position or
If the pink resistance line is not broken when the 1st section at the top is touched,
It is a vertical decline section,
And if the 109,638.1 dollar short position entry section at the top is not touched,
It is a long waiting strategy at the 2nd section at the bottom.
I think it would be good to think of it as a game in the 1+4 section.
From the 2nd section breakout, I have marked the Bottom -> 3rd section at the bottom.
Up to this point, please just refer to and use my analysis,
I hope you operate safely with principle trading and stop loss prices.
Thank you for your hard work this week.

FUNUSDT price predictionif you are doing spot trading as me so i am a muslim please dont buy and away from FUNUSDT it is comming down .

Bitcoin will drop from resistance level and fall to 103500 levelHello traders, I want share with you my opinion about Bitcoin. Some days ago, price entered the pennant, where it turned around from the seller zone, which coincided with the resistance level, and dropped to the 103500 support level. Then it bounced and tried to grow, but soon failed and dropped below the 103500 support level, which coincided with the buyer zone and reached the support line of the pennant. Following this movement, BTC experienced an upward impulse, breaking the 103,500 support level and subsequently exiting the pennant pattern, before rising to the resistance level. Price broke this level and then started to decline inside another pennant pattern. In this pattern, the price dropped top 103500 support level again and then tried to bounce back, but failed and continued to decline. In a short time, it fell to the support level, broke it, and then fell to the support line of the pennant. Next, BTC turned around and repeated an impulse up to the resistance line of the pennant and exited from this pattern. Then it rose to the seller zone, where it rebounded from it and fell, but recently it rebounded and started to grow. Now, I expect that price will reach the resistance level and then drop to the 103500 support level. For this case, this level is my TP. Please share this idea with your friends and click Boost 🚀
Disclaimer: As part of ThinkMarkets’ Influencer Program, I am sponsored to share and publish their charts in my analysis.

Bitcoin is gearing up for 120K and 140KThe flip zone has been reclaimed, but no proper pullback had occurred. The recent pullback came with a sweep of the all-time high (ATH), which has caused confusion and uncertainty among market participants.
In fact, this drop can be interpreted as a pullback to the flip zone, accompanied by an ATH hunt.
We expect the price, after touching the green zone and forming a base around this level, to move toward the targets of 120K and 140K — which we currently consider as Bitcoin’s final targets for this cycle.
A weekly candle close below the invalidation level would invalidate this analysis.
For risk management, please don't forget stop loss and capital management
When we reach the first target, save some profit and then change the stop to entry
Comment if you have any questions

Bullish bounce for the Bitcoin?The price is falling towards the pivot which is a pullback support and could bounce to the 1st resistance.
Pivot: 108,797.87
1st Support: 106,083.15
1st Resistance: 112,003.20
Risk Warning:
Trading Forex and CFDs carries a high level of risk to your capital and you should only trade with money you can afford to lose. Trading Forex and CFDs may not be suitable for all investors, so please ensure that you fully understand the risks involved and seek independent advice if necessary.
Disclaimer:
The above opinions given constitute general market commentary, and do not constitute the opinion or advice of IC Markets or any form of personal or investment advice.
Any opinions, news, research, analyses, prices, other information, or links to third-party sites contained on this website are provided on an "as-is" basis, are intended only to be informative, is not an advice nor a recommendation, nor research, or a record of our trading prices, or an offer of, or solicitation for a transaction in any financial instrument and thus should not be treated as such. The information provided does not involve any specific investment objectives, financial situation and needs of any specific person who may receive it. Please be aware, that past performance is not a reliable indicator of future performance and/or results. Past Performance or Forward-looking scenarios based upon the reasonable beliefs of the third-party provider are not a guarantee of future performance. Actual results may differ materially from those anticipated in forward-looking or past performance statements. IC Markets makes no representation or warranty and assumes no liability as to the accuracy or completeness of the information provided, nor any loss arising from any investment based on a recommendation, forecast or any information supplied by any third-party.

Bitcoin Purchase Plan!If the price breaks resistance #1, another bullish wave will be more likely in the medium term
Trading Setup:
Traders can open their Buy Trades NOW
BTCUSDT Bitcoin (Daily)
Buy now or Buy on 101500.0
SL @ 93200.0 (-8%)
TP1 @ 121900.0 (+19%)
TP2 @ 136000.0 (+33%)
TP3 @ 150000.0 (+47%)
What are these signals based on?
Classical Technical Analysis
Price Action Candlesticks Fibonacci
RSI, Moving Average , Ichimoku , Bollinger Bands

head and shoulder forming on ETHETH has formed head and shoulder on 1 hr time frame if it decisively breaks 2525 and moves down the expected target of 2415 may be possible this H&S will become invalid if ETH stays above 2575-2585 then we can expect elliot wave 5 on shorter time frame to come into play which would set targets for 2710-2850 extension of wave 5 can be upto 3050....should 2410 be achived then we are looking at deeper correction which will happen on bigger time frame opening possible doors for 1900 levles

BONK longBONK bounced off the support level after the successful retest. Bullish movemen to next resistance level is expected to continue

Bitcoin is in a downward trend.Hello dear friends.
Considering the trend of Bitcoin, it is expected that this Bitcoin will fall to around $100,000.
❌Please note that this is just a prediction, so be careful with your capital.

$1.2 Billion XRP Sell-Off by Whales Could Halt Price ReboundThis week, addresses holding between 100 million and 1 billion XRP sold over 600 million XRP worth over $1.2 billion in just 24 hours. The selling activity from these major holders points to a shift in sentiment.
With such a large amount of BINANCE:XRPUSDT leaving the hands of long-term holders, the market may struggle to sustain its upward movement.
At $2.24, XRP is just under the resistance level of $2.27 . This resistance has held strong for over a month, making it the key barrier between XRP and the next significant resistance at $2.32. If XRP fails to breach this level, the altcoin may struggle to continue its recovery and could face a retracement.
Breaching $2.27 is crucial for continuing the recovery, but with the selling activity from large holders, it seems unlikely that BINANCE:XRPUSDT will reach $2.32 . Instead, a failure to break past $2.27 could send XRP back down to $2.13, testing lower support levels.
However...
Read More - XRP Whales’ $1.2 Billion Selling Creates Red Flags for Price Recovery

Will #HOOK Continue to Rise or a Trap is Being Set? Must Watch Yello Paradisers! Have you seen the recent price action of the #HookedProtocol or not? Let's see what's happening with #HOOK and its next move:
💎#HOOKUSDT has been moving in a clear falling wedge pattern, with price respecting both the descending resistance and support levels since late April. After multiple rejections from the lows, we finally saw a breakout from the wedge, which is a potential sign that bulls are preparing for a shift in structure.
💎Currently, #HOOKUSD is trading near 0.1120, and the 50EMA is now acting as support, which increases the probability of a continued move higher. The first area we are watching is 0.1242, which now acts as the moderate resistance. If the market manages to hold above this level, it opens up the path toward 0.1938, the next strong resistance, and a level where profit-taking becomes critical.
💎However, if bulls fail to hold the structure and price breaks back below 0.0779, then the entire bullish setup becomes invalid. In that case, we’ll likely revisit the 0.0600 region, and the trapdoor opens for late buyers who ignored the warning signs.
Stay sharp, Paradisers. The market is about to pick a side and we’ll be on the right one.
MyCryptoParadise
iFeel the success🌴

DOGE/USDT Preparing for a 50% Rally in July 2025If the short-term fractals are kept aside, the long-term price action displays huge potential for a continued ascending trend. After the latest rejection from a resistance zone between $0.2180 and $0.2327, the bulls are trying hard to elevate the levels back above $0.2, but the bears seem to have capitulated the range just below the resistance.
The weekly chart analysis suggests, the price has held the ascending trend line as a strong support and recently triggered a rebound. Besides, the weekly MACD, which has been within the negative range since the start of the year, displays a drop in selling volume and pressure. Meanwhile, the weekly DMI is about to turn bullish as the conversion line and base line are heading for a bullish crossover.
Key Technical Indicators Supporting the Rally
Golden Cross Formation: The 9 EMA has crossed above the 21 EMA—typically a bullish sign.
MACD Histogram: Green bars show growing positive momentum.
RSI Strength: RSI levels above 50 confirm bullish control.
Support Level: $0.155–$0.16
Resistance Target: $0.175–$0.18
A breakout above $0.18 could push DOGE toward the $0.20–$0.22 range, while a break below $0.155 might invite short-term pullbacks.

PENGU. Main trend. Trend reversal zone. 04 07 2025Logarithm. Main trend. Fresh cryptocurrency, which is being driven into hype.
Locally now. Price at the median of the bowl.
Buyer volume dominates. Most likely, there will be a large pump in case of a breakout.
The chart is somewhat reminiscent of the Bitcoin chart, the reversal zones of this secondary trend, after the first local wave of growth. The first local, significant target is shown.
There is a possibility of a helicopter, that is, to collect stops in both directions, and thereby dump passengers before a potential pump.
Such cryptocurrencies (low liquidity, monopoly over the price due to the concentration of cryptocurrency in “one hand”) at a good time "the hamster is not scared", will be pumped up conditionally, like Shiba Inu (SHIB), driving the hype (raising the price over and over again, and coming up with positive news) and 0.5 million Twitter subscribers (X). Medium-term — long-term level zones are shown on the chart.

Bitcoin takes a deeper dive on wave 4!The Daily: Dormant Bitcoin wallets wake after 14 years to move billions of dollars in BTC, House GOP declares ‘Crypto Week,’ and more!

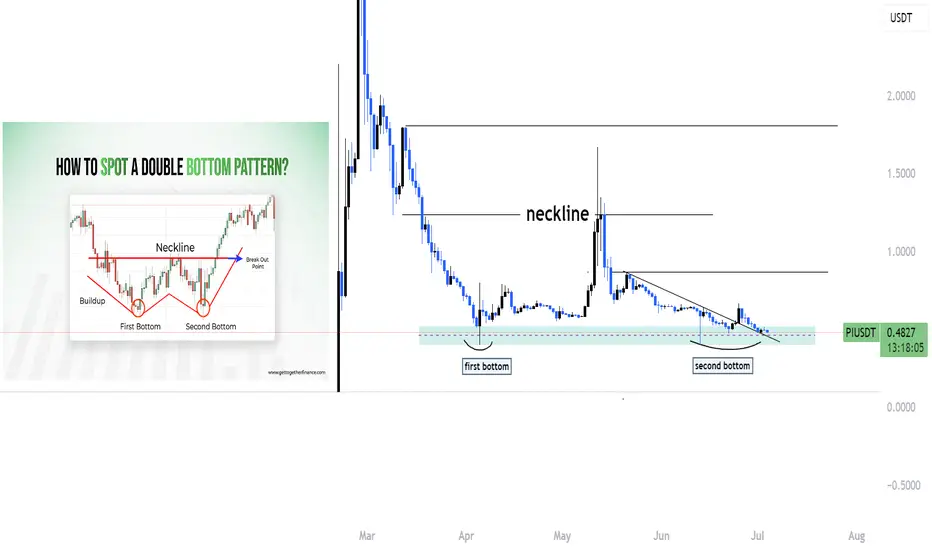
Piusdt making double bottom ??Hello traders, I hope you're all doing well!
Currently, we're seeing an interesting setup on PI that could lead to a potential bullish move. Let's break it down:
🔹 Double Bottom Formation
PI appears to be forming a double bottom on the higher time frame — a classic bullish reversal pattern. This indicates that the market has tested a key support level twice and failed to break lower, which often suggests that selling pressure is weakening.
🔹 Trendline Breakout
In addition to the double bottom, we’ve also broken out of a descending trendline that has been acting as dynamic resistance for some time. A clean breakout with volume often signals a shift in market structure from bearish to bullish.
🔹 Strong Support Zone & Liquidity
We are still holding above a strong support zone, where previous demand has stepped in. This area has likely accumulated a lot of liquidity, with stop-losses from retail traders sitting just below. If price holds this level, it may trap sellers and trigger a short squeeze, pushing the price higher.
🔹 Possible Upside Move
As long as we remain above this support and confirmation continues, there is a high probability of an upward continuation. This could be the start of a bullish leg, especially if we see a break of recent highs with strength.
📈 Conclusion
This confluence of technical signals — double bottom, trendline breakout, and liquidity resting below support — gives us a strong reason to watch this setup closely.
👉 Like and follow if you’re seeing the same structure or planning to trade this move. Let’s ride it together!
Ena to 0.4$?I like it and i like it from here.
Looks like 7th july will be gud
Looks gud and bullish.
Send it .
NFA

$HYPEUSDT Trade Setup 4HKUCOIN:HYPEUSDT Trade
Entry: CMP
Stop Loss: $38.501
Target: $45.846, $56.845
Breakout from a triangle pattern with bullish MACD. Watch for retest entry.
DYOR, NFA.
