PORTAL/USDT +150% After enduring a prolonged 500-day downtrend with a 99% correction since its listing on Binance Perpetual, PORTAL is now flashing potential early reversal signals.
Price has likely bottomed out following extreme oversold conditions
Volume starting to pick up, suggesting accumulation phase
Structure forming potential breakout setup from long-term base
Target: +150% from current price upon confirmation
Entry Zone (Green Box): Accumulate in this range for optimal R/R
🔻 Stop Loss: Below recent swing low to manage risk
Crypto market

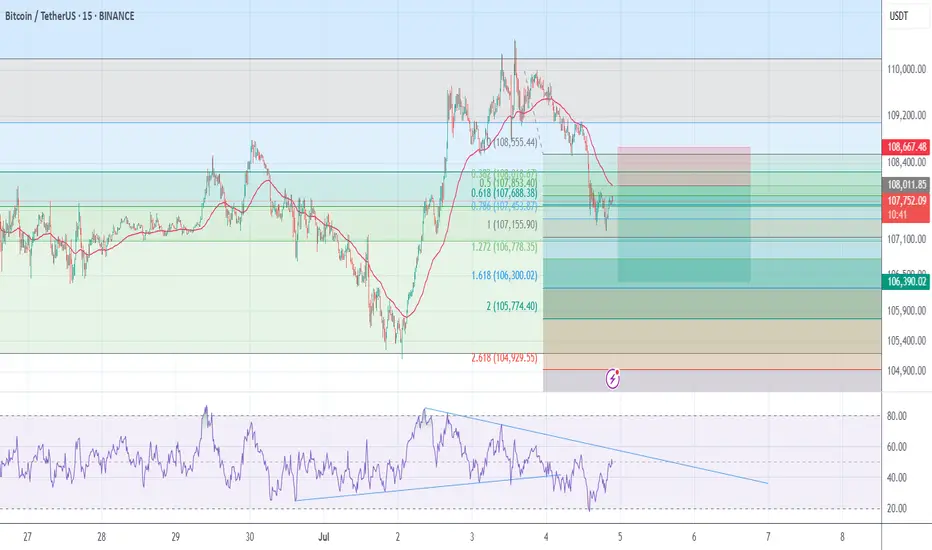
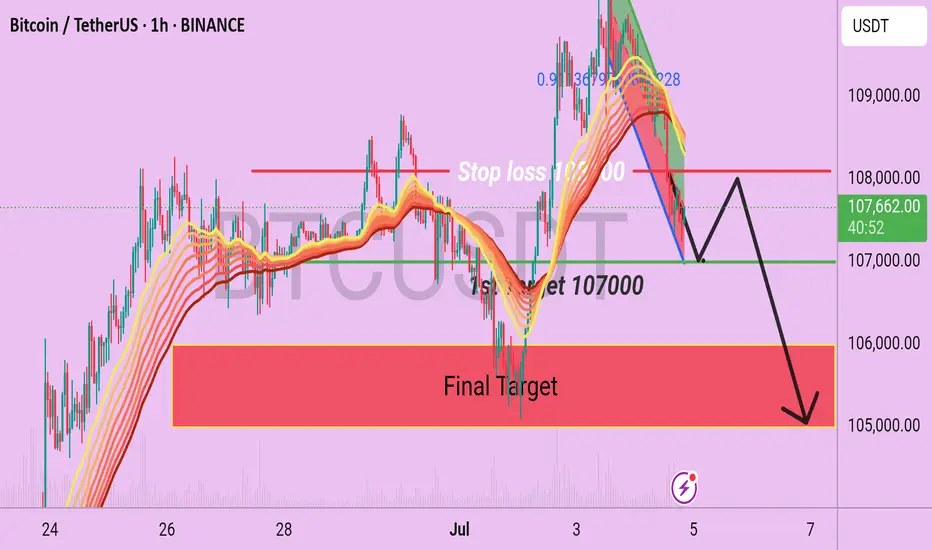
#Sell Bitcoinmy trading system is based on divergency and fibo.
#Sell Bitcoin
entry price = 108000$
T.P = 106400 $
S.l = 108700 $
RR = 2.5
Long opportunity in BTC/USDT.PSThe 107963.44 level has already been broken. So we need to wait to retest the same level.
Reasons : -
1. 30 MIN BOS Breakout.
2. it retested the fibonocci 0.611 level.
Entry : 107963.44
TP : 109065.90
SL : 107415.57
Disclaimer : I'm not recommending to take this entry. Do with your analysis too.

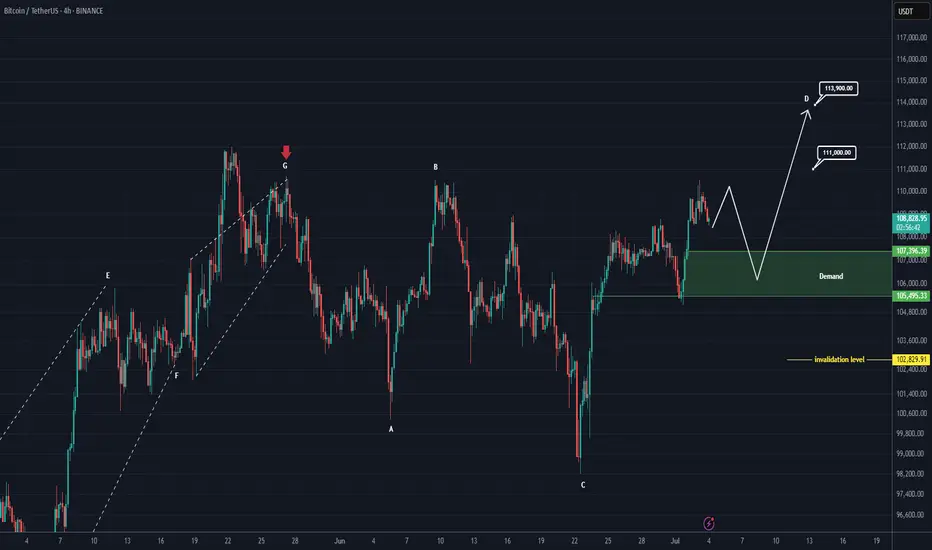
Bitcoin New Update (4H)This analysis is an update of the analysis you see in the "Related publications" section
If we were to publish an update for Bitcoin, wave D could move toward higher levels.
After hitting the green zone and gaining momentum, it could once again move upward to liquidate short positions.
In this update, we've naturally raised and revised the invalidation level.
The new targets have been marked on the chart.
A daily candle closing below the invalidation level would invalidate this analysis.
For risk management, please don't forget stop loss and capital management
Comment if you have any questions
Thank You
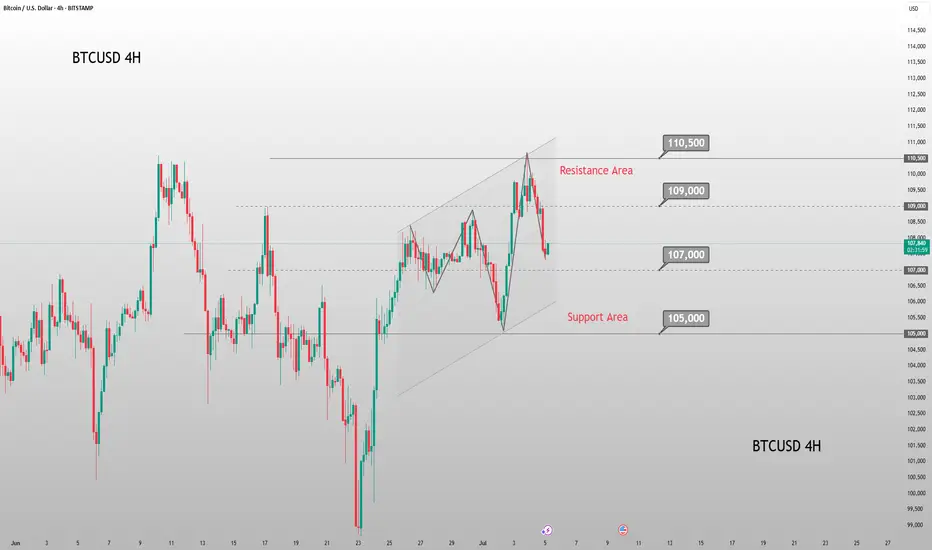
Weekend BTC Trend Analysis and Trading SuggestionsLet's review this afternoon's market performance. The BTC price, as we anticipated, rebounded to around 109,000 in the afternoon before plummeting sharply. Living up to "Black Friday", this violent drop was well within our expectations. In the afternoon's live trading, we also reminded everyone that as long as there was a rebound to the upper zone, it was a good opportunity to go short. This drop has created a space of nearly 1,500 points. Currently, the BTC price has pulled back to around 107,800.
From the current 4-hour K-line chart, after a strong upward surge, the market encountered significant resistance near the upper track of the Bollinger Bands. As bullish momentum gradually faded, the price started to come under pressure and decline, suggesting that the short-term upward trend may come to a temporary halt. At present, the market has recorded multiple consecutive candlesticks with large bearish bodies. The price has not only effectively broken below the key support level of the Bollinger Bands' middle track but also caused the Bollinger Bands channel to switch from expanding to narrowing, indicating that market volatility is decreasing. In terms of trading volume, it showed a moderate increase during the price pullback, which further confirms the authenticity of the bearish selling pressure.
BTCUSD
sell@108000-1085000
tp:107000-106000
Investment itself is not the source of risk; it is only when investment behavior escapes rational control that risks lie in wait. In the trading process, always bear in mind that restraining impulsiveness is the primary criterion for success. I share trading signals daily, and all signals have been accurate without error for a full month. Regardless of your past profits or losses, with my assistance, you have the hope to achieve a breakthrough in your investment.
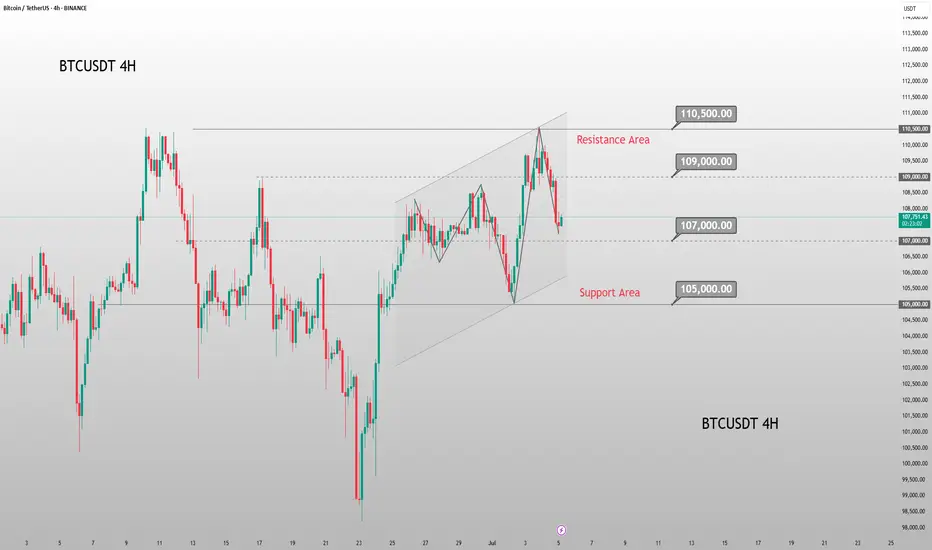
Evening BTC Trend Analysis and Trading SuggestionsLet's review this afternoon's market performance. The BTC price, as we anticipated, rebounded to around 109,000 in the afternoon before plummeting sharply. Living up to "Black Friday", this violent drop was well within our expectations. In the afternoon's live trading, we also reminded everyone that as long as there was a rebound to the upper zone, it was a good opportunity to go short. This drop has created a space of nearly 1,500 points. Currently, the BTC price has pulled back to around 107,800.
From the current 4-hour K-line chart, after a strong upward surge, the market encountered significant resistance near the upper track of the Bollinger Bands. As bullish momentum gradually faded, the price started to come under pressure and decline, suggesting that the short-term upward trend may come to a temporary halt. At present, the market has recorded multiple consecutive candlesticks with large bearish bodies. The price has not only effectively broken below the key support level of the Bollinger Bands' middle track but also caused the Bollinger Bands channel to switch from expanding to narrowing, indicating that market volatility is decreasing. In terms of trading volume, it showed a moderate increase during the price pullback, which further confirms the authenticity of the bearish selling pressure.
BTCUSD
sell@108000-1085000
tp:107000-106000
Investment itself is not the source of risk; it is only when investment behavior escapes rational control that risks lie in wait. In the trading process, always bear in mind that restraining impulsiveness is the primary criterion for success. I share trading signals daily, and all signals have been accurate without error for a full month. Regardless of your past profits or losses, with my assistance, you have the hope to achieve a breakthrough in your investment.
BITCOIN ANALYSIS - What's Next for for BTC?🎯 KEY LEVELS DECODED
🛡️ FORTRESS SUPPORT: $102,800 - $103,200
_____________________________
NEUTRAL STRATEGY:
Buy Zone: $102,800 - $102,600
Sell Zone: $110,000 - $112,000
Stop Loss: $100,500 (range breakdown)
Target: Opposite end of range
Position Size: 3-5% of portfolio
_____________________________
🎢 SCENARIO : (Probability: 35%)
If BTC consolidates between $102K-$108K :
Range-bound trading for 2-3 weeks
Accumulation phase before next major move
Key levels: Buy $102K, Sell $110K
_________________________
🛡️ RISK MANAGEMENT 🚨 DISCLAIMER 🛡️ DYOR

CVX/USDT Weekly Analysis — Strong Reversal Zone CouldTechnical Analysis:
1. Strong Demand Zone (Key Reversal Area)
CVX price has repeatedly tested a strong support zone around $1.43 – $2.20 (highlighted in yellow). This area has acted as a major accumulation zone, showing strong buyer interest and serving as a critical base support.
2. Potential Double Bottom Formation (Bullish Reversal Pattern)
A potential Double Bottom or Adam & Eve pattern is forming within this demand zone — a classic bullish reversal structure, indicating a possible trend shift to the upside.
3. Key Resistance Levels (Bullish Targets):
$2.90 – Minor resistance, likely to be tested in the short term.
$3.46 – Significant psychological and technical resistance.
$4.98 – Major resistance and neckline of the double bottom pattern.
$6.76 – Strong weekly resistance, a potential medium-term target.
$15.77 & $47.97 – Long-term targets if a macro bullish trend emerges.
Bullish Scenario:
If the price holds above the $2.20 support zone:
Gradual upward movement expected toward $2.90 → $3.46 → $4.98.
A confirmed breakout above $4.98 could trigger a rally toward $6.76.
Full bullish confirmation would occur if the price breaks and holds above $6.76, indicating a longer-term trend reversal.
Bearish Scenario:
If price breaks down below the $1.43 support level with a weekly close:
The double bottom structure would be invalidated.
Price could enter new price discovery territory, potentially heading below $1.00.
Market sentiment would turn significantly bearish.
Strategic Conclusion:
CVX/USDT is currently at a critical decision point. A strong historical support zone suggests a high potential for bullish reversal. Confirmation of the bullish structure requires a breakout above $4.98. However, caution is needed if price breaks below $1.43, as it may indicate structural failure.
#CVXUSDT #ConvexFinance #CryptoAnalysis #DoubleBottom #ReversalPattern #BullishSetup #AltcoinAnalysis #SupportResistance #CryptoBreakout #TechnicalAnalysis

AVAX Possible scenarioAVAX is currently in a downtrend and has approached a key support zone. Price action has formed a bearish flag pattern, suggesting a continuation of the prevailing trend. The market is currently in a correction phase within this flag.
If the support fails and the pattern breaks to the downside, AVAX may slide toward the next bearish target around $14.
However, if the resistance of the flag is broken to the upside, it would invalidate the bearish setup and could shift momentum toward a recovery, with a potential move toward $22.5 as the first bullish target.
Let’s monitor how the price reacts near the edges of this pattern to assess whether continuation or reversal plays out.

BTC shorting opportunity comes againBTC climbed above 108000 again, and the short-term bullish power was slightly stronger. According to the current strength, BTC still has room for growth, but it is still under pressure in the 109000-110000 area in the short term; if there is no major positive news, BTC may find it difficult to break through the resistance area in the short term under the current conditions, and may even experience stagflation and retreat again after approaching the resistance area.
Therefore, I think shorting BTC with the help of the resistance area is still the first choice for short-term trading. We can boldly short BTC in the 108500-109500 area and look towards the target area around 106000 again.

Btc looks quite bearish from the 15 minutes timeframe- sellPrice is currently forming a bearish continuation pattern and this provides us with a sell opportunity from the lower timeframe perspective. A sell opportunity is envisaged

NOT NOT - Im hereNOT looks soo tired. ultimately shall complete the patterns on the top! Huge flows tho

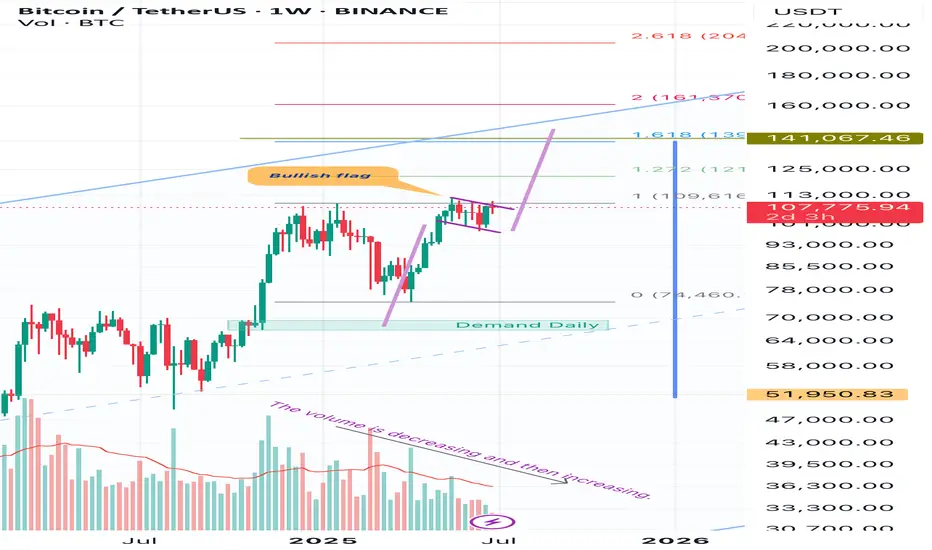
BtcusdtHello friends, in these important days of the markets, I wanted to share an analysis of Bitcoin with you. I think it is in a bullish flag and the target is 136,000 and within reach. It is 140,000. And I think that considering that the volume is decreasing, this indicates that with a sudden increase in volume, it will exit this bullish flag upwards with great intensity and speed.
BTC/USDT H1 Chart Out look Bitcoin is Now running at near the 107500 and following a short term Bearish pattern on EMA 50 and 200 by using that we can consider on sell side with the given Targets like 107000 which is near the Bitcoin is consolidating and the Final target support is 106000/105000.
Bearish Scenario
1st Target is 107000 ( from here it may make some retest)
2nd Target is 106000( main target).
3rd Target is 105000.
Use stop loss at 108100.
#SUI Ready to Grow up?#SUI
The price is moving within a descending channel on the 1-hour frame and is expected to break and continue upward.
We have a trend to stabilize above the 100 moving average once again.
We have a downtrend on the RSI indicator that supports the upward break.
We have a support area at the lower boundary of the channel at 2.83, acting as strong support from which the price can rebound.
We have a major support area in green that pushed the price higher at 2.75.
Entry price: 2.87.
First target: 2.95.
Second target: 3.04.
Third target: 3.14.
To manage risk, don't forget stop loss and capital management.
When you reach the first target, save some profits and then change your stop order to an entry order.
For inquiries, please comment.
Thank you.

XRP/USDT Trade Setup – 15minLondon session raided Asia's lows, grabbing liquidity and creating the conditions for a bullish reversal. This setup aligns with the NY session's typical continuation behavior following a London manipulation move.
Post-raid, price structure shifted bullish, indicating smart money accumulation. A clear fair value gap (FVG) formed, and entry was taken upon confirmation of bullish order flow.
Entry: 2.227
Stop Loss: 2.200
Take Profit: 2.400
Risk-Reward Ratio: 9.23R
Narrative:
London session swept Asia lows (liquidity engineered).
Break in market structure confirmed shift.
Entry aligned with FVG and order block mitigation.
Targeting inefficiency fill and liquidity above recent highs.
Note:
This trade is for journal purposes only and not financial advice.
Always perform your own analysis and manage risk accordingly.

ETH/USD Short TermA little copy paste.
Traders love their fractals... So much that they often become self-fulfilling prophecy.

BTCUSD is ranging in narrow zone alighning broad equiti marketBTCUSD is ranging in narrow zone alighning broad equiti market

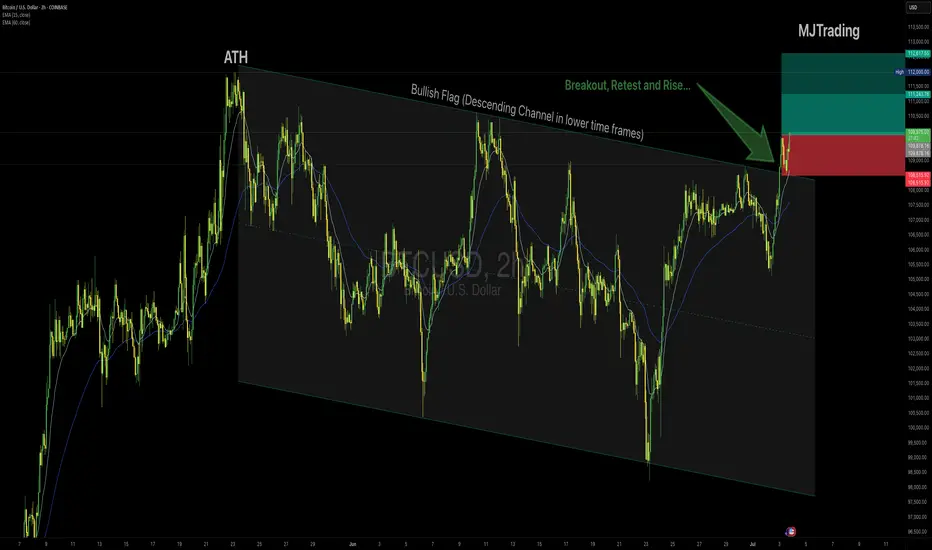
BTCUSD – Long Setup (2H Chart)👆👆🚀🚀Boost it if you like it (Thanks)🚀🚀👆👆
Idea:
Bitcoin is breaking out above the descending Flag after testing the upper boundary multiple times, showing bullish momentum confirmed by price holding above the 15 EMA and 50 EMA. The breakout aligns with strong impulse candles and sustained buying pressure.
Entry:
✅ Buy near $110,000
Stop Loss:
🔴 Below $108,500, under the breakout structure to protect against a false breakout.
Take Profit:
🟢 Tp1 $111,245
🟢 Tp2 $112,600
Rationale:
Clear breakout of the channel top resistance.
Bullish EMAs crossover with sustained slope.
Strong impulse move suggesting continuation.
Risk Management:
Position size accordingly, max risk 1–2% capital per trade.
#Bitcoin #BTCUSD #CryptoTrading #Breakout #LongSignal #TradingView #TechnicalAnalysis
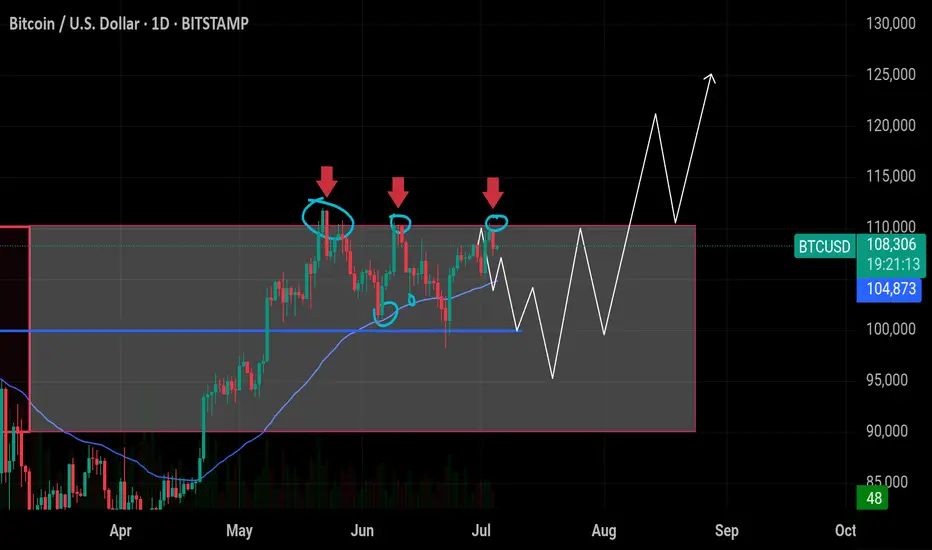
$BTC is stuck in a box – Big move coming soon! Bitcoin has hit CRYPTOCAP:BTC is stuck in a box – Big move coming soon!
Bitcoin has hit $110K resistance three times and failed. It's moving sideways inside a big box. A breakout is coming – either up or down.
🔸 Support at $104.7k–$100k:
50 EMA is around $104.7K, acting as the first support. Strong support is at $100K. If the price drops here, it’s a good place to buy.
🔸 Targets:
If BTC closes above $110K, we can see a quick move to $115K or even $120K.
🔸 Risk Level at $99k:
If price falls below $99K, the bullish setup is no longer valid. In that case, BTC might go down to $95K or even $90K.
🔸 Outlook:
✅ Watch for a close above $110K to enter a breakout trade.
✅ If price drops, look to buy near $100K–$105K.
Wait for confirmation — the next big move is near!
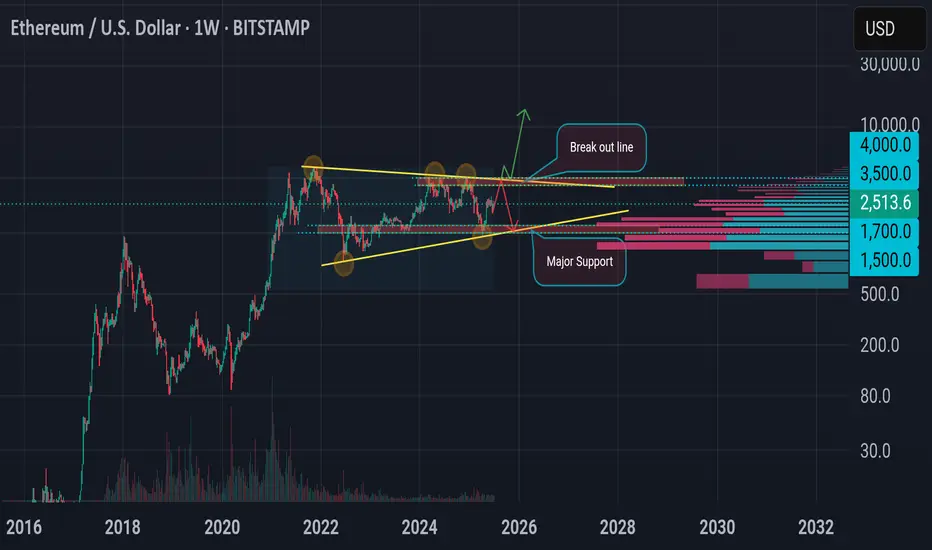
ETH Bullish pennant!?Let's look at the big timeframe (weekly). currently the price is moving in the consolidation area, forming a triangle with a narrowing trend but in a long time span. therefore there has been no eth spike for several years making it feel boring. big movement if it is able to penetrate the breakout line of 3500-4000$ or there will be a rejection if it fails. Major support is in the area of 1500-1700$ which historically is quite good at withstanding high selling pressure.
My Ideal Elliott Wave Entry ModelThe IMSETT 3/C Entry Model.
Every trader wants to catch the big moves the ones that pay quickly and decisively. In Elliott Wave, those moves often come during Wave 3. It's the strongest part of the trend, and when you're positioned early, the risk-to-reward is unmatched.
But not every opportunity hands you a clean Wave 3 on a silver platter. Sometimes you’re looking at a Wave C instead. That’s where the 3/C Entry Model comes in. It’s designed to get you aligned with high-conviction moves—whether the market is in a trend or a zig zag.
Here’s the edge: both Wave 3 and Wave C often start the same way—a strong, motive push off an AOI (area of interest), followed by a retracement. That shared structure gives us an anchor. Whether we’re labeling it a 3 or a C doesn’t change the fact that the initial impulse gives us clarity, direction, and a place to manage risk.
That’s what the IMSETT Model is built around:
Identify
Motive
Scout
Entry Plan
Track
Trade
Each step is focused, actionable, and repeatable. You're not trying to outguess the market—you’re reacting to structure, preparing for common behavior, and executing with intent.
I do have a video with a walk through.
This just the way I look for clarity in setups. As with everything in trading, nothing will work every time so do your own research this is not financial advice.
Cheers!
Trade Safe, Trade Clarity.

$ICPUSD Steady ProgressWith respect to crypto projects with real utility and valued against CRYPTOCAP:BTC , Internet Computer Protocol potentially represents huge, if less speculative, value. Watching here.
