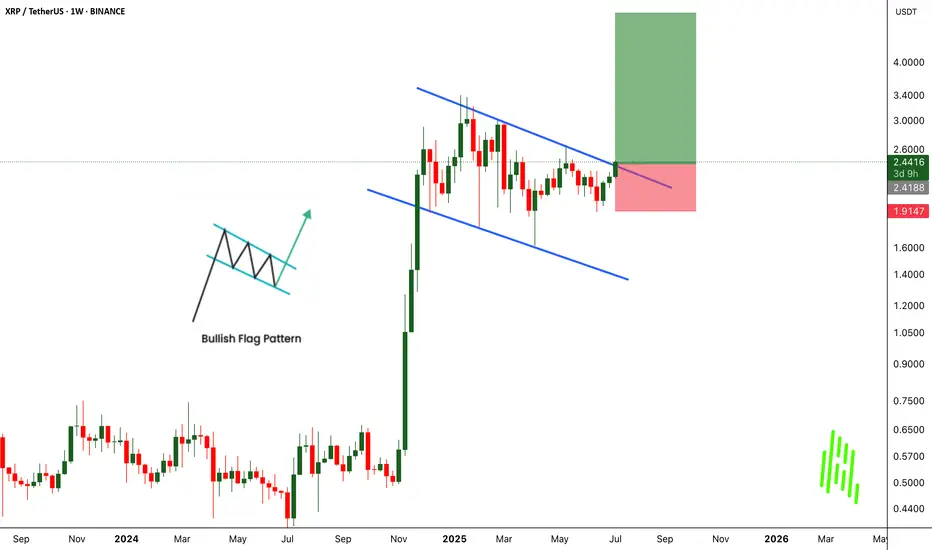
XRPUSDT Breaks Out of Bullish Flag - Big Moves Ahead!BINANCE:XRPUSDT has broken out of a classic bullish flag pattern on the weekly chart, signaling a strong continuation to the upside. This textbook setup is known for its high success rate, and the breakout suggests the potential for significant gains if momentum continues.
The CRYPTOCAP:XRP community remains strong, with long-term holders showing confidence and resilience. With the current market structure and support from loyal investors, there’s a real possibility for the price to double from this breakout zone.
The strategy is simple. Buy and hold for the long term. But as always, traders must manage risk carefully and use a proper stop loss. Let the flag fly high. CRYPTOCAP:XRP could be ready for a major pump from this level.
BINANCE:XRPUSDT Currently trading at $2.43
Buy level : Above $2.4
Stop loss : Below $1.9
Target : $5
Max leverage 3x
Always keep stop loss
Follow Our Tradingview Account for More Technical Analysis Updates, | Like, Share and Comment Your thoughts
Crypto market
Bitcoin - Liquidity grab at $111.000?This 4-hour BTCUSD chart illustrates a potential short-term bullish continuation scenario followed by a deeper retracement, highlighting key liquidity levels and an important Fair Value Gap (FVG) support zone.
Liquidity sweep
At the top of the current price action, just above the $110,612.16 level, there is a clear area of resting liquidity. This zone has likely accumulated a significant number of stop-loss orders from traders who are shorting the market or who went long earlier and are protecting profits below previous highs. The market tends to seek liquidity to fill institutional orders, making this zone a high-probability target for a sweep. As a result, price is likely to take out these resting stop orders in a quick upward move, often referred to as a "liquidity grab" or "stop hunt", before potentially reversing or consolidating.
Bullish 4H FVG
Following this liquidity sweep, the chart suggests a retracement into a bullish 4-hour Fair Value Gap (FVG) located around the $106,600 to $107,400 region. This imbalance zone was formed during an impulsive move up, leaving behind a gap between the wicks of consecutive candles. Such gaps represent areas where demand previously overwhelmed supply, and they often act as strong support on a retest. If price revisits this zone, it is expected to offer support and could serve as a base for another upward push, assuming bullish momentum remains intact.
Downside risk
However, if the bullish FVG fails to hold as support and price breaks down through this imbalance zone, it would signal a weakening of bullish structure. In that case, the breakdown would likely lead to a deeper correction or even a trend reversal, with price seeking lower levels of support further down the chart. This would invalidate the short-term bullish scenario and suggest that sellers are gaining control, possibly triggering further liquidations and more aggressive selling pressure.
Conclusion
Overall, the chart is currently leaning bullish, anticipating a liquidity sweep to the upside followed by a potential pullback into the FVG. The reaction at the FVG will be critical in determining whether the market can continue higher or if it shifts into a deeper bearish correction.
Disclosure: I am part of Trade Nation's Influencer program and receive a monthly fee for using their TradingView charts in my analysis.
Thanks for your support.
- Make sure to follow me so you don't miss out on the next analysis!
- Drop a like and leave a comment!

TRUMP BUY ???Hello friends🙌
🔊As you can see in the picture, we have brought you two Trump charts:
1_TRUMP/USDT, in which we see an upward trend.
2_TRUMP/BTC, in which we see a downward trend.
✔Now what is the conclusion? When this negative divergence occurs, it means that money flows from Bit to Tether, and we can expect good growth from it to the specified targets, given the price reaching important support and its return📈
🔥Join us for more signals🔥
Trade safely with us.

BTC makes new all time highs!Crypto has been soaring today.
Ethereum and BTC pumping liquidity!
Fed minutes came out today around 2pm, indicating rate cuts at next meeting and throughout the rest of the year and crypto absolutely loved that.
Crypto thrives in a cheap liquidity environment, rallying in potential rate cuts.
We took profits on IBIT calls - still holding longs in the BTC market expecting higher price.

$OTHERS: Decision Time for AltcoinsDecision Time for Altcoins
Unless something drastic changes — like Trump firing Powell and cutting rates to 0% — the chart suggests a potential correction.
MACD is overheated, RSI is overbought, and we're hitting major resistance. An ABCD or extended ABCDEF pattern seems likely, with a upside target around $260B amd a downside support at $230B in total altcoin market cap.
Of course, the market can always choose to ignore the signals and continue its uptrend directly to the next resistance at $260B.
Stay sharp. Let’s see how it unfolds.
DYOR.
#Altcoins #Crypto #Bitcoin #ETH #MACD #RSI #TechnicalAnalysis #CryptoMarket #DYOR #PriceAction

XRP - Time to buy again! (Update)It seems the price is forming a head and shoulders pattern, which, if correct, suggests a good price increase in the coming days. However, we should wait for the pattern to fully complete.
Best regards CobraVanguard.💚

UNI up 13% – is $10 the next stop?Hello✌
let’s dive into a full analysis of the upcoming price potential for Uniswap 📈.
BINANCE:UNIUSDT has maintained solid bullish structure within a well-formed ascending channel and is now approaching a key daily support zone. Recent volume spikes and a 13% price increase indicate growing buying interest. A breakout above the channel resistance could open the way toward the psychological target at $10, a level watched by many traders. Monitoring price action and volume confirmation here is essential for potential trend continuation. 📈🧠
✨ Need a little love!
We pour love into every post your support keeps us inspired! 💛 Don’t be shy, we’d love to hear from you on comments. Big thanks , Mad Whale 🐋

BTC Dominance (BTC.D) — Weekly Failed AuctionChart Context
• Instrument: CRYPTOCAP:BTC.D
• Time-frame: 1-Week
• *Key vLevels (dashed):
• 68 % – 2021 supply pivot
• 66-68 % zone – recorded a Weekly Failed Auction (wick above, close back below)
• 62.50 % – mid-range support / prior breakout shelf
Failed Auction at the Top
Price wicked into the 66-68 % vLevel but closed lower.
On a weekly chart that pattern often marks exhaustion; bulls couldn’t maintain control.
First Support = 62.50 %
If BTC.D trades < 62.50 % and closes a weekly bar there, odds rise that capital rotates out of BTC and into alt-coins.
Historically this breakdown triggers the early stages of alt-season (see 2021 analogue).
Invalidation
Weekly close > 68 % negates the failed auction and points to renewed BTC strength (alts lag).
How I’ll trade / allocate
Spot BTC bias – overweight BTC while dominance holds > 62 %.
Alt-coin rotation – shift 20-35 % into high-conviction alts only after a confirmed weekly close < 62 % and follow-through below 60 %.
Risk checks – trim alt exposure back to cash/BTC if dominance reclaims 62 % after a breakdown (failed alt-season).

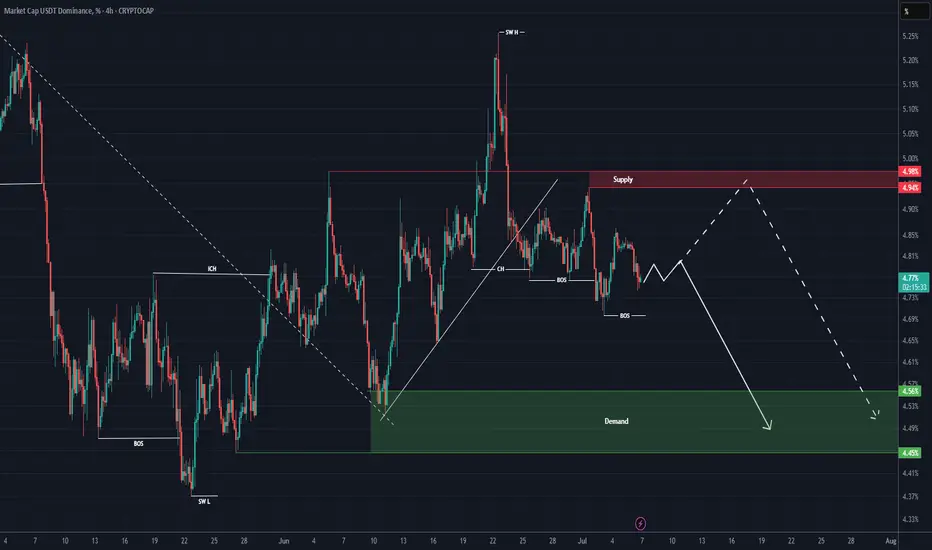
USDT DOMINANCE New Update (4H)By analyzing the chart, it becomes clear that the USDT dominance structure is bearish.
After the structural shift to a downtrend, with lower highs and lower lows forming, it is expected that the price will drop to the main support zone in order to collect major orders from lower levels.
The price could drop from the current level or from the upper supply zone, which would signal a bullish move in the overall market.
The target is the green box.
A daily candle closing above the supply zone would invalidate this analysis.
For risk management, please don't forget stop loss and capital management
Comment if you have any questions
Thank You
SHIBUSDT Bounces Strongly from Wedge SupportSHIBUSDT is forming a bullish falling wedge on the weekly chart, showing signs of reversal after bouncing from key support at 0.00001000. A breakout above the wedge resistance could trigger strong upside momentum in the coming weeks.
Entry at current price
Stop Loss: .00000890 (Below the Wedge Support)
TP1: 0.00001700
TP2: 0.00003100
TP3: 0.00007000
$1000SHIBUSDT CRYPTOCAP:SHIB

Bitcoin's New All-Time High = Altcoins Market Bull MarketThe shy new all-time high is in and it is good to be Bitcoin today. It is good to be Bitcoin, to be in Bitcoin and profit while trading Bitcoin but the bears got rekt and that's oookkkk. We accept their loss and it is their loss they earned it by being short when the market is good, bullish and strong. Who would short Bitcoin right before a new all-time high? I don't know.
A new all-time high was hit today, the price $112,000 but this is not the end. Not even close. This is the beginning of the next bullish wave.
I know what you are thinking, or might be thinking; Wait, but what about a drop? What about the correction? Will it go lower? Can I buy Bitcoin at 90K? I told you to buy when prices were low... "You would look like a genius for buying below 80K," 100K is already gone. No, no correction! Bitcoin is going up.
When resistance breaks it means higher. When prices move higher it means higher. When a new all-time high hits it means the bulls win. Now that the bulls won, the battle for the rise or the drop, we can expect higher prices. If you have any doubts, look at the altcoins. The altcoins market says we are entering a period of long-term growth.
Bitcoin will continue to hold strong. It will continue to rise surely, slowly, or fast, but long-term. It doesn't matter the speed; Bitcoin for the whales, altcoins for retail.
A small capital will grow faster with the altcoins because they have higher room for growth. The projects being smaller, more volatile makes for a good trading experience. Higher risk but also a higher opportunity to grow in the short- and mid-term. Bitcoin is good to retire now. Bitcoin is great to hold value, to support the market as it continues to grow.
For me and for you, welcome to the altcoins market bull market.
Thanks a lot for your continued support.
Namaste.

BTC – Bullish Continuation Ahead ?Bitcoin has been trading within a well-defined rising channel since mid-2023, respecting both upper and lower bounds beautifully.
After each impulsive move, we’ve seen healthy corrections followed by bullish continuations — a classic market structure in play.
🟦 Accumulation Zone: After a long accumulation phase, BTC kicked off a strong bullish cycle.
🟥 Correction Phases: Each major move was followed by a red correction zone before resuming the uptrend.
🟧 Current Phase: BTC is consolidating just below the upper channel boundary. A breakout above this zone could confirm the next bullish wave toward $140K+.
🔵 Key Observations:
Structure remains intact within the channel
Previous breakout zones now acting as support (blue arrows)
Continuation patterns are forming, signaling potential upside
🏹As long as the orange zone holds, BTC remains in a bullish structure, and a breakout would likely push us to new highs.
📍Will history repeat and BTC continue its journey toward the upper channel boundary? Let’s wait for confirmation!
💬 What’s your bias here? Are you bullish or waiting for a deeper pullback?
📚 Always follow your trading plan regarding entry, risk management, and trade management.
Good luck!
All Strategies Are Good; If Managed Properly!
~Richard Nasr

BITCOIN Bitcoin’s price is rising higher due to several key factors:
Strong Institutional Demand and ETF Inflows:
Large inflows into US spot Bitcoin ETFs, led by firms like BlackRock, have injected billions of dollars into the market, supporting price gains and driving a breakout above previous highs. ETF inflows have been consistent, with $2.6 billion added over recent weeks, signaling growing institutional adoption.
Corporate Treasury Adoption:
Nearly 260 companies now hold Bitcoin on their balance sheets, collectively owning over 850,000 BTC worth around $96 billion. This corporate demand adds a structural layer of buying pressure.
Expectations of Federal Reserve Rate Cuts:
Market participants are pricing in a high probability of Fed interest rate cuts later in 2025. Lower rates tend to reduce the opportunity cost of holding non-yielding assets like Bitcoin, making it more attractive as a store of value and speculative asset.
Technical Bullish Patterns:
Technical analysis shows bullish setups such as a bull flag breakout on daily which historically signals continuation of upward momentum.
Macro and Regulatory Environment:
Growing regulatory clarity, especially in the US, and ongoing geopolitical and inflation uncertainties reinforce Bitcoin’s appeal as “digital gold” and a hedge against traditional market risks.
Market Sentiment:
The Fear & Greed Index indicates growing investor confidence (“Greed” zone), and Bitcoin has experieced a majority of green trading days recently, reflecting positive momentum.
Summary
Factor Impact on Bitcoin Price
Institutional ETF inflows Strong buying support
Corporate treasury adoption Structural demand
Fed rate cut expectations Lower opportunity cost for BTC
Technical bullish patterns Momentum for further gains
Regulatory clarity & macro risks Increased trust and safe-haven appeal
#bitcoin #btc

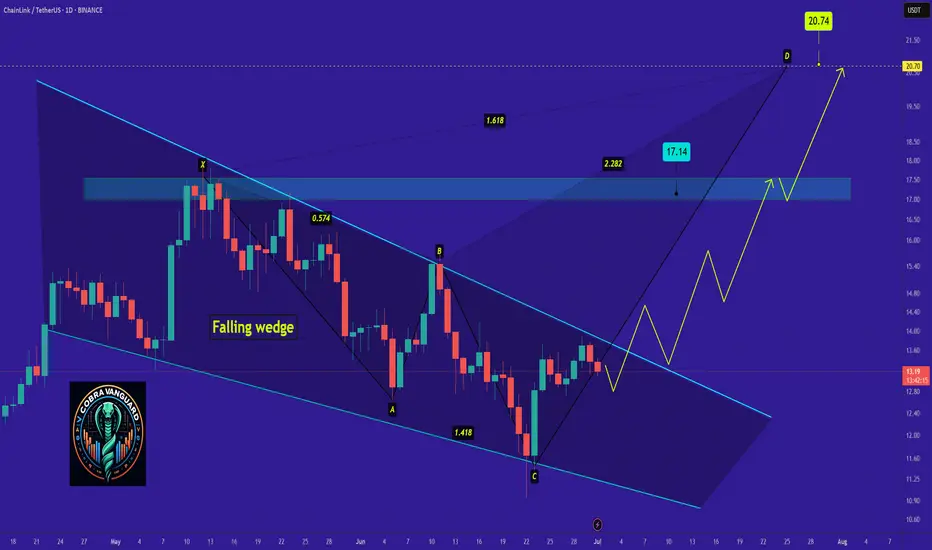
"LINK - Time to buy again!"So if you pay attention to the LINK chart you can see that the price has formed a Ascending wedge which means it is expected to price move as equal as the measured price movement.( AB=CD )
NOTE: wait for break of the WEDGE .
Best regards CobraVanguard.💚
DOGEUSD: Pumpamentals or Hopium?DOGEUSD is forming a fractal pattern within a broadening triangle. Every Peak there is a descending triangle that follows, and then there is a quick uptrend which breaks above the previous high.
Expect DOGE to hit ATH by EOY if not sooner.

SAND – Rotation in PlaySAND is showing early signs of strength off the long-term demand zone near $0.23–0.24, where it's been accumulating for several months. Price just printed a strong weekly bounce, up +16%, reclaiming the bottom of the range.
This area has acted as a key base since mid-2023 — with each touch producing a notable reaction. Now trading at $0.286, SAND is attempting to rotate toward the top of the established range.
Key Levels
Support (Range Low): $0.23–0.24 (strong demand zone)
Resistance (Mid-Range): $0.43
Range High: $0.85
A clean flip of the mid-range ($0.43) could open the door to test $0.70+.
📌 Risk management: A break and weekly close below $0.23 invalidates this setup. As long as it holds, the upside potential is attractive from a risk/reward standpoint.
This is a classic accumulation > reclaim > expansion structure. Let the chart speak if the range holds, the rotation is in play.

Bitcoin Rejected at Resistance – Sideways Trap Now Likely⚠️🚫 Bitcoin Rejected at $111,592 – Smart Money Took Profits, Not FOMO 💰📉
We called it yesterday. I urgently posted about the $111,592 level — one of the most important resistance zones in this structure. And right on schedule… Bitcoin tagged it and got rejected.
📍 This isn’t just luck. It’s structure + timing + discipline.
🔄 While many were eyeing a breakout, we were preparing for the expected rejection — and we took profits after long entries from just under $100K (as shown). This wasn’t the time to FOMO. This was the time to cash in.
🔎 Key Points from Today’s Market View:
We’re still inside the ascending channel, but testing the upper end
Multiple divergences on the 2-day chart are still active (8 counted). Many more across big timeframes.
The third macro resistance test is inbound — watch the 'where can Bitcoin go post below'
Current outlook favors a sideways chop — the classic liquidation zone where longs and shorts alike get punished
We might still get the breakout to $114,900 — but if that happens, it’ll come after more pain, not from clean momentum.
🧠 Bigger Picture:
If you missed the major chart update, watch:
👉 Where Can Bitcoin Go? Part 8
And if you want today’s broader outlook (including ETH, BTC.D, NASDAQ), catch the July 10th video:
👉 July 10th Market Outlook – Uncharted Waters
🗣️ Final Word:
What we’re seeing is not a breakout. Not yet.
This is a trap zone.
Discipline > Emotion.
Structure > Hope.
Profits > FOMO.
Welcome to day trading.
💬 Peanut butter Street Talk:
Presidents are out here launching meme coins. The insiders already made their billions — and they’re calling it “peanuts.”
But we don’t want to be their peanut butter.
That’s what happens when we become the exit liquidity.
They dump while we FOMO. They wait while we panic.
So don’t feed the trap. Keep your edge sharp, your charts tighter, and your emotions in check.
I prefer to buy over 115k, over resistance or lower at support.
Not today,
The FXPROFESSOR 💙
Disclosure: I am happy to be part of the Trade Nation's Influencer program and receive a monthly fee for using their TradingView charts in my analysis. Awesome broker, where the trader really comes first! 🌟🤝📈

Ripple (XRP): Looking For Breakout | Possible Good Buy EntryRipple has had an insane buy-side volume lately, and the price is currently testing the local resistance zone (neckline area). We are looking for a proper breakout from this area (which will happen if we keep current buyside momentum as it is). As soon as we get it, we are going to look for a buy entry, which should lead the price towards our major target of the upper resistance zone.
Swallow Academy

Litecoin to $1100 (12X) In This Coming AltseasonBased on tried and true fractals, multi-fib confluences, and historical price action, Litecoin is poised to hit prices between $900-1500 this cycle. The multi-fib confluences are pointing to $1100-1200 range as the most likely target. This is expected over the next 6-12 months if things continue to play out how I am expecting. As of today SEC approval of a LTC ETF is imminent but yet to be actualized.

GRT/USDT at a Critical Point! Reversal Structure or Breakdown?📊 Full Technical Analysis – GRT/USDT (1W Timeframe)
🔎 Overview:
GRT is currently positioned at one of the most critical technical levels in its long-term structure. After a prolonged downtrend from the $2.88 all-time high, price is once again testing the historical demand zone between $0.07 – $0.09, which has repeatedly acted as a strong support level since mid-2022. This area represents a major accumulation zone, where smart money may be silently positioning.
🧠 Structure & Pattern Formation:
✅ Historical Demand Zone (Major Support Area):
The $0.07 – $0.09 range has been tested over 5 times in the last 2 years, showing strong demand.
This zone also acts as the potential base of a double bottom pattern, indicating a possible macro reversal.
🟡 Double Bottom Potential (Reversal Pattern):
Two nearly equal lows forming around this demand area hint at a classic double bottom formation.
Confirmation comes if price breaks and holds above $0.1281 resistance.
🔻 Declining Selling Pressure:
Sellers appear to be losing momentum, as seen in the declining weekly volume.
This could signal distribution is ending and accumulation is underway.
📈 Bullish Scenario:
If GRT holds this critical support and breaks above key resistance, a strong mid-term rally may follow:
1. Breakout Confirmation:
Valid if the weekly candle closes above $0.1281.
2. Upside Targets (Fibonacci + Historical Resistance):
🎯 $0.1868 → minor resistance / past consolidation zone.
🎯 $0.2402 → previous rejection area.
🎯 $0.3233 → key Fibonacci retracement level.
🎯 $0.4352 → strong horizontal resistance.
🎯 $0.5285 → mid-term bullish target.
3. Ideal Bullish Conditions:
Bullish divergence on the weekly RSI.
Increasing volume on breakout confirmation.
📉 Bearish Scenario:
If the support fails to hold, GRT could face further downside:
1. Breakdown Below $0.07 – $0.09 Zone:
⚠️ $0.0550 → minor support.
⚠️ $0.0300 → All-Time Low and psychological support.
2. Deeper Risk:
If panic selling occurs or broader market sentiment worsens, GRT may print new lows, continuing its long-term bearish trend.
🧭 Conclusion & Strategy:
> GRT is in a highly interesting accumulation phase from a technical perspective.
The risk-to-reward from this support zone is attractive, with signs of a potential reversal building. However, traders should wait for confirmation and always use proper risk management.
Entry Strategy:
Speculative entry: inside the $0.08–$0.09 zone (tight stop-loss below $0.07).
Confirmed entry: after breakout and weekly close above $0.1281 (targeting levels mentioned above).
#GRT #TheGraph #GRTUSDT #CryptoReversal #DoubleBottom #SupportZone #AltcoinSetup #BullishCrypto #BearishRisk #TechnicalAnalysis

$SUSDT (or S , ex FANTOM): good entry for a long setupCrypto Market Outlook
The overall crypto market is in a clear uptrend.
The money printer is running, and USD dominance is dropping — all signs pointing to a potential continuation of the rally in the coming months.
Unless a black swan event hits, it's not too late to position yourself if you’re still on the sidelines.
⚠️ Always manage your risk with a proper stop loss — altcoins move fast and can reverse just as quickly.
One interesting setup: $S
✅ Relatively new
✅ Didn’t pump too hard
✅ Broke out of its downtrend
✅ Found solid support
The Fib levels offer good targets for take profit zones.
🔍 Ideal entry: within the green box or lower.
Let the pump cool off — it could offer a perfect entry opportunity. Be patient and wait for a good position.
If $S pumps from here without retrace:
→ Jump in with a tight stop loss
→ Or look elsewhere for a better risk/reward setup.
DYOR.
#Crypto #Altcoins #Bitcoin #ETH #Trading #CryptoMarket #TechnicalAnalysis #RiskManagement #DYOR

DeGRAM | BTCUSD got out from the triangle📊 Technical Analysis
● Price reclaimed the purple 2-month trend cap and has “fixed” above the 107 k former supply, turning it into support; this validates the grey ascending triangle whose base lies on the channel mid-line.
● Triangle height and prior swing grid point to 112 k first, then the 114.9 k May high just beneath the channel ceiling. Invalid if candles sink back below 107 k.
💡 Fundamental Analysis
● Spot-ETF desks added >9 800 BTC since Friday while on-chain miner reserves stabilised, suggesting dwindling sell pressure just as U.S. CPI relief is lifting real-yield headwinds.
✨ Summary
Long 107–108 k; breakout >112 k opens 114.9 k. Bull view void on 4 h close <107 k.
-------------------
Share your opinion in the comments and support the idea with a like. Thanks for your support!

Double bottom at weekly level Time for Doge to finally move up with this double bottom formation. I am Very bullish I believe we will see .47 cents really soon
Not an expert just my opinion.
