Bitcoin [BTC1!] Draw and Bias. 05.07.25, SaturdayLooking for bullish action on BTC. No stance on alts.
Crypto market

BTC/USDT 4H – High-Probability Decision Point Ahead Bitcoin is currently retesting a confluence-rich zone — a textbook decision area where structure meets sentiment.
🔻 What’s in play?
🟥 Demand Zone / Bullish Order Block / Breaker Block (visible on 1H)
📈 Third-touch test of the ascending trendline – statistically known to trigger strong moves
⚪ Price sitting just above the 200 EMA acting as dynamic support
🧱 Prior resistance flipped to support — now being validated again
Despite the correction, structure remains intact. This is a healthy retracement unless price starts closing below trendline + zone with volume.
🔀 Possible Outcomes:
Bounce: If buyers step in here, this could mark the next leg in the uptrend.
Breakdown: A strong close below the zone/trendline could shift structure and sentiment bearish.
⚠️ No trade bias here — let price show its hand.
💬 What’s your view — bounce or break? Comment below!
✍️ Chart marked with structure logic only — not financial advice.

Ethereum ready for Short.Around 9th of July wil start going down.⬇️⬇️⬇️⬇️⬇️⬇️ Daily lower high was formed
DCA 1=2370. DCA 2= 2010. DCA 3=1823.

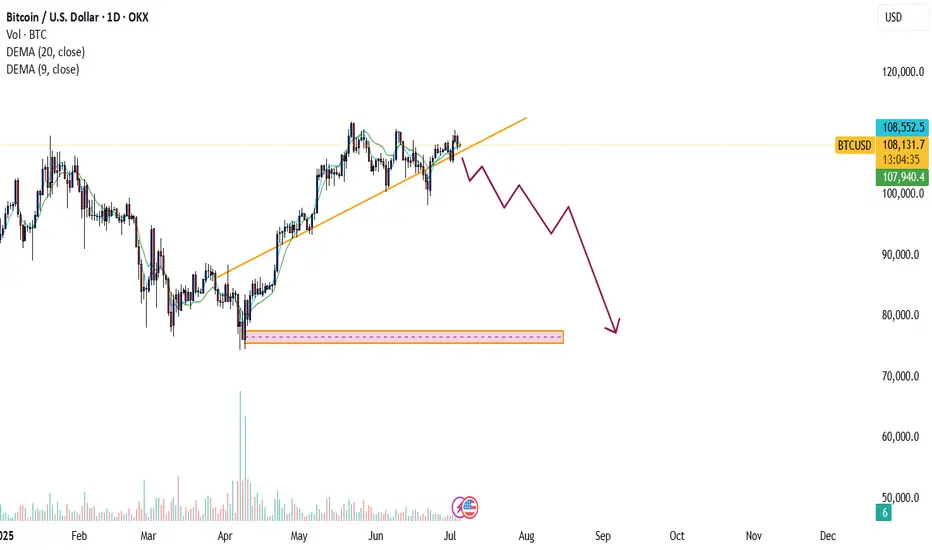
Bitcoin(BTC/USD) Daily Chart Analysis For Week of July 4, 2025Technical Analysis and Outlook:
During this week's trading session, Bitcoin rebounded from our Mean Support level of 104900 and, with significant momentum, subsequently completing the Mean Resistance level of 110300. Currently, the cryptocurrency is poised for a continuation of its downward trajectory, with a target set at the Mean Support level of 105500. This downward trend may necessitate heightened resilience to address the Key Resistance point at 111700 and the emerging historical price action of the Outer Coin Rally at 114500 and beyond. Nonetheless, it remains essential to acknowledge the possibility that current prices may experience an uptick from this juncture, bolstering the rally mentioned above.

XLM READY FOR 40% GAINS!!!Hold onto your hats. We have been trading sideways for quite some time now. As you can see, we are running out of room. We Already have a double bottom and have great support. PayPal is going to push us to the moon, but for now, 40% gains feels pretty good. If you look at my ghost feed you will see we will probably trade in this range until the 3rd week of July; however, I won't rule out a run as early as next week. They may continue to push it down to the lower part of the triangle, but don't be fooled, you can see inside my forecast box that there is greater chance for bullish activity than bearish. Have a happy fourth y'all!

ETHUSD POTENTIAL LONGETHUSD potential bullish setup ↗️
ETH still showing bullish momentum. Might bounce on the bullish trend line, for now it’s hasn’t done the third touch so expect it go lower to the trendline first. A strong bullish confirmation would be a signal to go LONG. Share your thoughts on this in comment section.

BITCOINTHE pullback into structure will be watched ,if the daily candle gets rejects on the daily trendline, then the buy holds .if they fail then the daily cross supply roof will send price tanking
the price action is playing a quick one ,technically i wasn't expecting a break of 4hr demand descending trendline line acting as support floor. patience is key, allow the daily candle to close for clear directional bias..
the uptrend future will lie on daily candle close and the weekly candle close will be the final verdict.
trading is 100% educated probability, so don't take personal, even when your analysis are wrong ,accept it and try again.
overall, resilience and consistency are what will distinguish you from other traders.
do have a happy blessed weekend.
we coming new week on money and winnings .
#btc #bitcoin #gold #silver #copper

Bitcoin will Bearish conformed Structureon Thursday Bitcoin Price briefly reclaimed at 110K this morning as macro tailwinds and institutional flows lifted crypto but analysis say clear catalyst is still needed to break all time high after the long impulsive rally earlier in the year.
BTC has been trading with in descending channel on the daily time frame looking after the Long time price will needs break and catch there Support 105K Level if the price stays below more then could next zone formed 102K
You may find more details in the chart i need support from you Guys And feel free to share your thoughts other views in the comments.

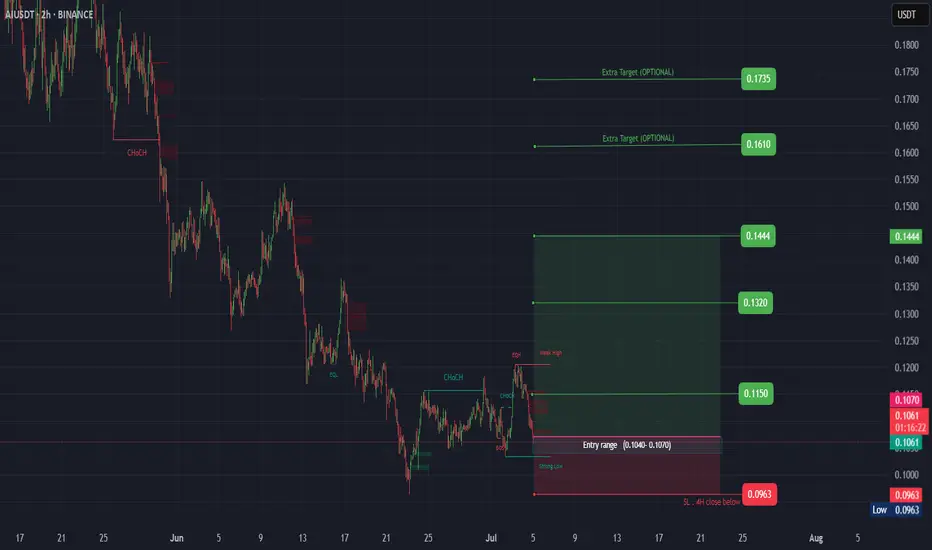
AI ( SPOT )BINANCE:AIUSDT
#AI/ USDT
Entry( 0.1040- 0.1070)
SL 4H close below 0.0963
T1 0.1150
T2 0.1320
T3 0.1444
_______________________________________________________
Golden Advices.
********************
* collect the coin slowly in the entry range.
* Please calculate your losses before the entry.
* Do not enter any trade you find it not suitable for you.
* No FOMO - No Rush , it is a long journey.
AVAX/USDT – Bullish Channel Setup with Strong Risk/RewardAVAX is currently respecting a clear bullish channel on the 1H timeframe. Price just tapped the lower trendline and key Support Zone #1, forming a potential higher low setup.
If this trendline holds, I’m expecting a bounce targeting the 19.50–20.00 resistance zone — aligning with the top of the channel.
📌 Entry Zone: Around 17.50
🎯 Target: 19.50–20.00
🛑 Stop: Below 16.90
This setup offers a clean risk-to-reward and follows the broader channel structure. Watching for a confirmation bounce or bullish engulfing candle off support before entering.
💬 Let me know what you think — bullish continuation or deeper pullback incoming?
#AVAX #CryptoTrading #PriceAction #BullishChannel #TradingView #TA #Altcoins

Bitcoin Bulls Are Losing Power - Signal To Sell NOW!!!?Bitcoin Bulls seem to be losing power. If this rising wedge aka Contracting triangle starts to break down, the descending triangle we are trading at will resume and MARKETSCOM:BITCOIN might go as low as $93k!!! Is your trading strategy ready for that?

FUN USDT PRICE PREDICTION "In my opinion, FUN USDT has strong potential for a significant upward move."

Will PEPE/USDT Reach $0.000011?PEPE coin is showing signs of technical strength amid renewed crypto market optimism. It is currently trading around $0.000009890 with a modest rise of over 1.69% in the past 24 hours but still remains within a tight consolidation range. This hints towards a potential breakout, offering a potential upside of more than 50%.
The PEPE price has been trading within a descending parallel channel but has formed a small ascending parallel channel within
Interestingly, the CMF is dropping while RSI is making every attempt to keep the price elevated, holding the ascending support
This suggests that the strength of the rally is coiling up but the money flow into the platform has decreased
This may place the PEPE price at a crucial juncture as the token is required to break out of the resistance of the main channel to sustain within the ascending trend channel. Hence, the upcoming weekend could have a huge impact on the PEPE price, as a rise above $0.00001 could invalidate the bearish thesis.

Bitcoin the exact scenariobitcoin may need some mre liquidity to fuel back up , so it's better to see this scenario as the most accurate, in order to make some new all time high
crypto total capknowing the total cap gives you a signal of direction of liquid and bitcoin is a major diver in the market cap.

BONK/USDT Forms a Bullish Pattern, Is $0.00003, the Next PitstopBonk (BONK), Solana’s breakout memecoin, is once again attracting market attention as it gains upward momentum amid fresh hype surrounding potential ETF exposure and token burn events. Trading at approximately $0.00001874, BONK has climbed steadily in recent sessions, rising over 20% from weekly lows near $0.0000158—an encouraging sign for meme-token bulls.
Despite the recent selling pressure, the BONK price remains within bullish influence as the token surges $0.00001558 and $0.00001627
The momentum is rising as the price is approaching the upper resistance of the Gaussian Channel, and a rise above the range could flip the prevailing bearish trend
On the other hand, the CMF is rising and sustaining above 0, hinting towards the rise in the money flow onto the platform
Therefore, if the BONK price manages to rise above the channel, it may reach the neckline of the double-bottom pattern at $0.00002776, slicing above the pivotal resistance between $0.00002495 and $0.00002632

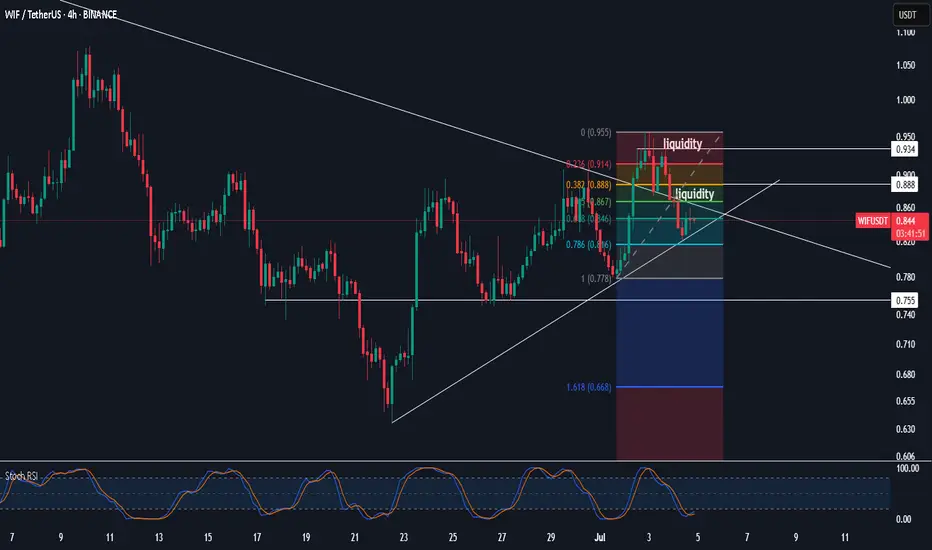
$wifadded to this meme
spot no leverage for me since enough to be made without stessing
rsi curling up expecting a recalim as dominace drops
btfd mode on alts for me
this time shall try and wait for dips when i book profits to rotate instead of rotating straight away since we will get lots of "volatilty" for now cheesed off for starting my postion above range high but meh its spot
A clear Understanding of $BTC next move As seen in this chart labeled. are the areas we are looking for interest of BULL breakout or bearish and leading into a alt season. Today JULY 4th. less market activity and small bear trap occured leading into today!
keep an eye out for rally in the near future.

ETH/USDT – 4H Chart AnalysisEthereum is currently trading within a broad consolidation range between $2,387 (support) and $2,657 (resistance) on the 4H timeframe. After a sharp pullback from range highs, price is retesting the mid-range and Fibonacci levels, offering a potential bullish setup.
Trading Plan:
Buy Stop: $2,501 (confirmation of upward momentum)
Stop Loss: $2,363 (below key support zone)
Take Profit 1 (TP1): $2,657 (range resistance)
Take Profit 2 (TP2): $2,853 (projected breakout target
) Key Levels to Watch:
Support Zone: $2,387 – $2,363
Resistance Zone: $2,657 – $2,853
Fib Retracements: 38.2% @ $2,554 & 61.8% @ $2,472
📊 Bias: Bullish above $2,501, caution if price dips below $2,363.
RSI is hovering near 44, suggesting neutral momentum with potential room for upside if buying pressure increases.

ETH BEARISH AT RESISTANCE ETH rejecting daily resistance, likely price will look to find supports at zones marked below
DYOR

Head and Shoulder on ETHETH has formed H&S pattern on 1 hr time frame with neckline at 2525 which just got breached targets for this could be 2480 final target 2415 structure would become invalid if 2575 is crossed and ETH sustains above that for now its bearish and a decisive break below 2500 will result in further long unwinding and creating a cascading downward move

LOKAUSDT Forming Falling WedgeLOKAUSDT is currently showing an interesting setup that has caught the attention of crypto traders and investors. The pair is forming a classic falling wedge pattern, which is widely known as a bullish reversal pattern in technical analysis. This pattern, combined with good trading volume, indicates that LOKA may be preparing for a strong breakout to the upside. With an expected gain of 60% to 70%+, this setup could offer a compelling opportunity for those looking to ride the next wave in altcoins.
League of Kingdoms (LOKA) is a well-known play-to-earn and blockchain gaming project that has been steadily gaining traction in the GameFi space. The project allows players to build kingdoms, engage in battles, and earn rewards, which drives community engagement and token demand. As interest in blockchain gaming and NFTs continues to grow, the underlying fundamentals for LOKAUSDT could provide additional momentum to push prices higher once the wedge breakout occurs.
On the technical side, traders will be watching for a decisive breakout above the wedge resistance line, ideally supported by a surge in volume to confirm the trend reversal. If this scenario plays out, LOKAUSDT could easily reach its expected target zone with gains of 60% to 70% or more. Investors should also stay alert to news and partnerships from the League of Kingdoms team that might act as further catalysts for price action.
✅ Show your support by hitting the like button and
✅ Leaving a comment below! (What is You opinion about this Coin)
Your feedback and engagement keep me inspired to share more insightful market analysis with you!

ETH/USDT at Critical Decision Point: Breakout or Rejection AheadETH is pressing into a major confluence zone between two key trendlines. Price is currently testing both diagonal resistance and horizontal support, making this a pivotal area to watch 👀
📍 Scenario 1 – Bullish:
If ETH can break above Resistance Zone #1 and hold, there’s clear upside toward $2,900 (Resistance Zone #2). A confirmed breakout could mark the start of a new short-term uptrend.
📍 Scenario 2 – Bearish:
Failure to hold Support Zone #1 could send price back into the lower range, with $2,300 and $2,100 in play. Watch for rejection from the descending trendline and a break of the rising channel.
This post is for educational purposes only — not financial advice. Use your own judgment and proper risk management when trading.
#ETH #Ethereum #TechnicalAnalysis #TradingView #BreakoutWatch #SupportResistance #CryptoTA #QuantTradingPro
