Bitcoin (BTC): Targeting $120K | Buyers Showing DominanceBitcoin is hovering still in between the old ATH area and the new, entering into a consolidation zone, which might be our breaking point.
Last week we saw the buyside dominance, which was backed by big institutions buy orders and short-term traders selling assets, giving us a sign of a potential bullish breakout—that's what we are looking for, a proper breakout from local resistance, which would then send the price towards our first target of $120K.
Swallow Academy
Crypto market

Litecoin Rebounds from FVG with $902.3 in SightFenzoFx—Litecoin is trading just below the $88.6 resistance after bouncing from the bullish fair value gap near $85.5.
If the $88.60 resistance is breached, LTC could aim for the previous week's high at $902.3. Please note that the bullish view remains valid above $82.4.

Bitcoin breakout is very closeBitcoin looks like it wants to break above its resistance and push upwards. My prediction still stands of 150-165k as cycle top.
Resistance levels (based on fib extension)
121.5k (0.618)
136k (1.00)

Buy Trade Strategy for BONK: Exploring Solana's Meme PowerDescription:
This trading idea highlights BONK, a meme-based cryptocurrency built on the fast and low-cost Solana blockchain. As one of the first major meme tokens in the Solana ecosystem, BONK has captured the attention of retail investors and traders, driven by a strong community, viral marketing, and integration into Solana-based dApps. Its tokenomics support deflationary mechanics and wide distribution, helping fuel adoption and engagement. BONK also benefits from Solana’s scalability, making transactions fast and cheap, an attractive feature for speculative and high-frequency trading environments.
Despite its playful branding, investing in meme tokens like BONK carries a high level of risk due to their reliance on social sentiment, market trends, and community hype. Their price movements can be extremely volatile and unpredictable, often lacking the stability of fundamentally-backed assets.
Disclaimer:
This trading idea is for educational purposes only and should not be taken as financial advice. Meme cryptocurrencies such as BONK are speculative and involve substantial risk, including the potential for total capital loss. Always do your own research, understand your risk tolerance, and seek guidance from a financial advisor before making any investment decisions. Past performance does not guarantee future results.

Wings of Opportunity: LINK’s Harmonic Setup Unfolding🦋 Title: A Butterfly on the Edge – But Only with Confirmation
On the 2H timeframe, a Bullish Butterfly Harmonic Pattern is unfolding. The wave structure (X → A → B → C → D) aligns closely with harmonic principles, and point D lies above X, within the 1.27 to 1.618 Fibonacci extension of XA — reinforcing the pattern’s validity.
📌 No entry has been triggered yet.
We are currently waiting for price to break and hold above the key resistance at 13.60 to confirm the bullish scenario.
🔹 Bullish Scenario (our primary and preferred outlook):
Given the strong reaction around the 12.74 demand zone and the harmonic structure completion, we are primarily focused on a long opportunity, if and only if confirmation is achieved above 13.60.
📥 Entry Zone: 13.05 – 13.65
🎯 Target 1: 17.94
🎯 Target 2: 18.76
🛑 Stop-Loss: Below 12.74 (structural invalidation)
🔻 Alternative Bearish Scenario:
If price fails to break 13.60 and instead loses the 12.74 support, the bullish setup becomes invalid, and the market could enter a deeper correction phase.
Potential downside targets in that case:
📉 11.80
📉 10.90 – 10.30 (if bearish momentum continues)
📊 Risk Management Notes:
Position sizing should not exceed 1% of total capital
Avoid early entries before confirmation
Prefer partial entries after breakout and retest
Stick to the invalidation level strictly
📈 While both scenarios are on the table, we are currently favoring the bullish setup, as long as price action supports it. Discipline and patience are key — confirmation first, trade second.

BTC flag with a pole to 140on a weekly BTC formed a flag, on Daily it's already bouncing off the flag treandline. the pole measured move is to 140. Just what my eye thinks it sees :)

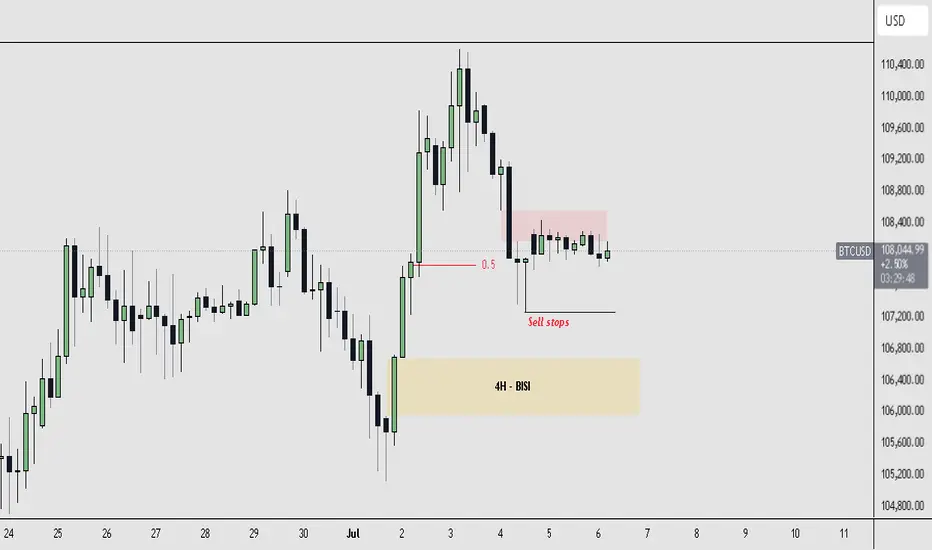
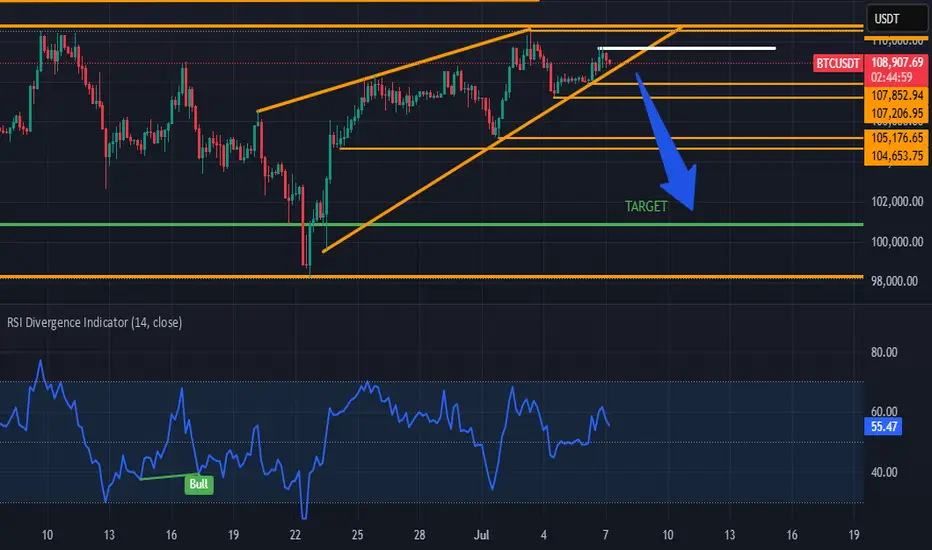
$BTCUSD Trade Idea Currently, BTCUSD is operating within a defined dealing range between $105,000 (low) and $110,600 (high). Price is consolidating near the equilibrium (0.5 level) of this range and forming a sideways structure just above visible sell-side liquidity.
We are seeing confluence with a 4H SIBI (Sell-side Imbalance, Buy-side Inefficiency) overhead, which is currently capping price and adding to short-term bearish pressure. At the same time, price is hovering above a clear liquidity pool marked by sell stops, creating a potential for a liquidity sweep scenario.
Below current price action lies a well-defined 4H BISI (Buy-side Imbalance, Sell-side Inefficiency) zone, which serves as a strong demand area and an ideal draw on liquidity before any potential bullish continuation.
BTC BEARISH IDEAL HOT BTC bullish ideal, BTC buys where Sensational and i dont expect the sell to be les either me and my whole theam eat let get it with BTC
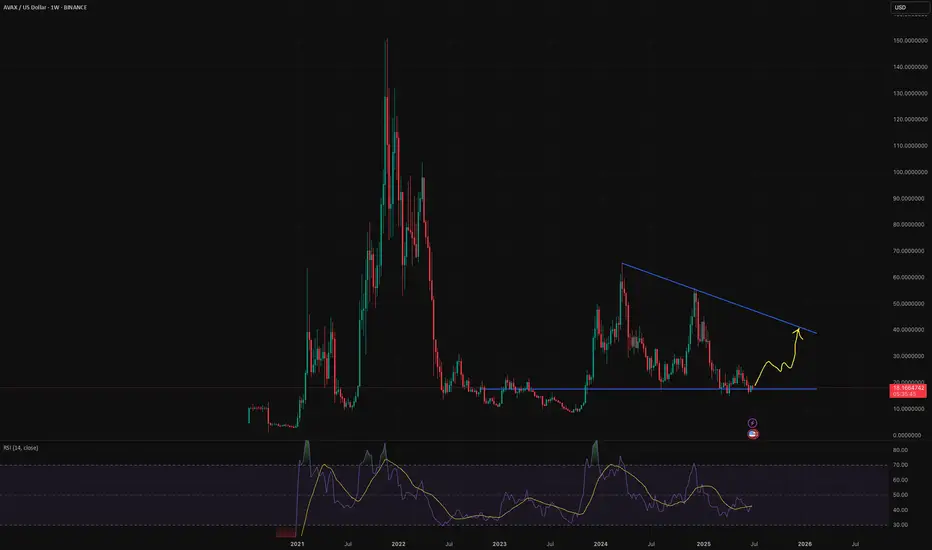
$AVAX will go to at least $40 this year-Almost oversold
-Positive RSI divergence
-at significant multi-year support
-retail sentiment: dead
-undervalued relative to Bitcoin
-in a continued crypto bull market (which I expect in 2025), AVAX will rise too, my first PT is $40 (hitting the descending resistance) with the potential to go much higher
Ethereum setup with a 14 R:R.Let’s see if this time marks the beginning of bullish momentum.
This setup offers a 14:1 risk-to-reward ratio
Entry at 2560
Stop loss 2457
Target at 4000.

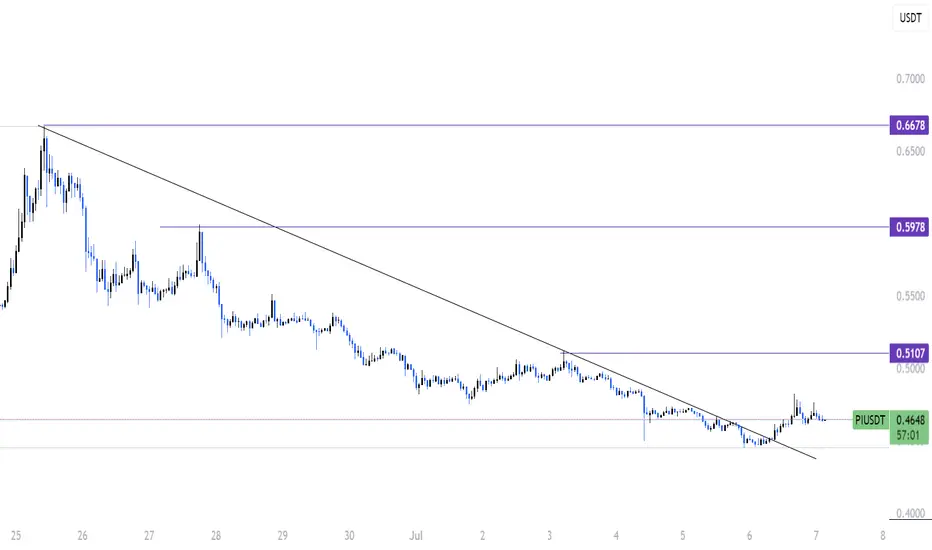
PI breakout from wedge and Trendline !!🚨 PI Breakout Update 🚨
Hey traders, hope you're all doing great!
Looks like PI just broke out of a strong trendline, and things are getting interesting.
We’ve seen solid support holding for a while, and now bulls are starting to wake up.
This move could be the start of something big if momentum continues.
Still early, but signs are pointing towards a possible bullish leg up.
Watch for a clean retest of the trendline — that could be your confirmation.
Volume is building nicely, and price action is starting to shift.
If you're tracking PI like I am, this is one to keep an eye on.
🔔 Follow for more updates and let's catch this move together!
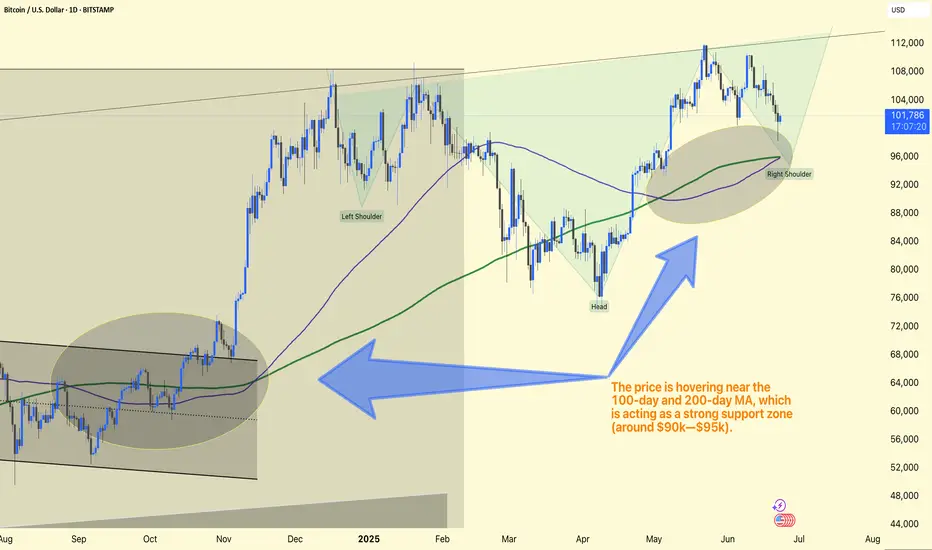
BTC/USD Analysis Update. Chart Pattern:
The chart clearly shows an Inverse Head & Shoulders structure:
Left Shoulder
Head
Right Shoulder
This is a strong bullish reversal pattern.
Moving Averages:
Price hovers near the 100-day and 200-day MA, acting as a strong support zone (around $90k–$95k).
This area is critical for sustaining long positions.
Expected Move:
Strong bullish potential towards the $113k–$115k zone, aligned with the upper trendline target.
RSI also suggests room for a bullish recovery from this zone.
Trade Plan:
Ideal Entry: Near $90k–$95k (Right Shoulder area)
Stop Loss: Just below $88k
Target: $113k–$115k
This structure is very favorable for long positions if the price confirms strength within the right shoulder zone.

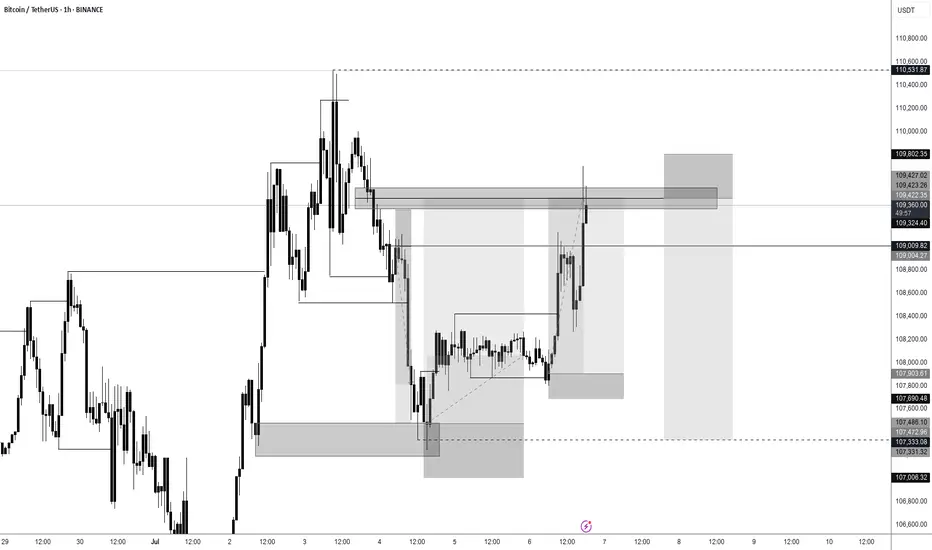
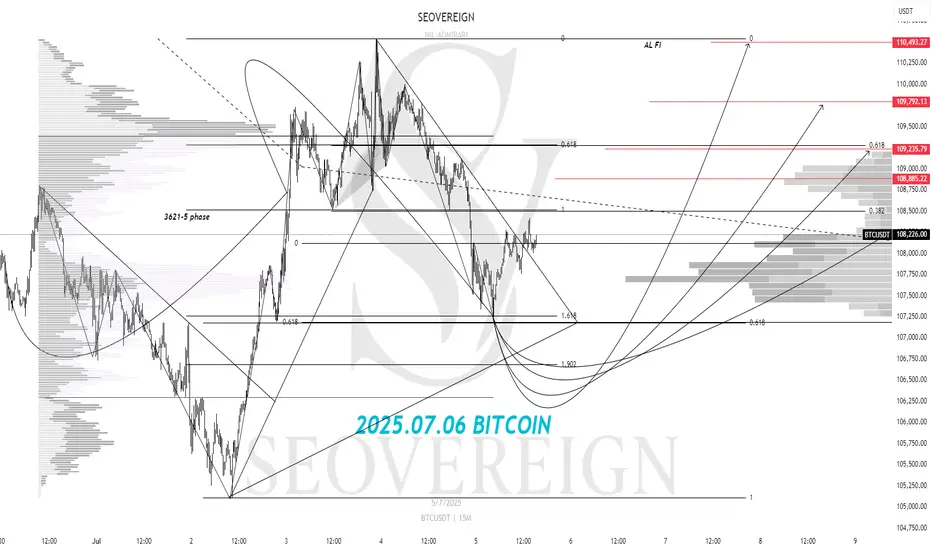
[SeoVereign] BITCOIN Bearish Outlook – July 6, 2025We are the SeoVereign Trading Team.
With sharp insight and precise analysis, we regularly share trading ideas on Bitcoin and other major assets—always guided by structure, sentiment, and momentum.
🔔 Follow us to never miss a market update.
🚀 Boosts provide strong motivation and drive to the SeoVereign team.
--------------------------------------------------------------------------------------------------------
Hello,
This is SeoVereign.
As of July 6, 2025, I present a bullish outlook on Bitcoin.
It has been a while since I last shared a long position perspective.
Those of you who have consistently followed SeoVereign’s ideas would know that, until now, most of the entry points have been centered around short positions. We have closely tracked the market, identifying opportunities amid the downtrend.
However, after comprehensively analyzing the recent overall market atmosphere, we have come to the conclusion that upward pressure is gradually increasing rather than downward pressure. After reviewing technical indicators and wave structures, we have determined that it is reasonable to consider a buy — in other words, a long position — at this stage.
The first target for this idea is set at an average of around 109,500 . This figure is based on a comprehensive judgment that includes the current wave structure, previous key support/resistance zones, and momentum trends. Of course, this target may be flexibly adjusted depending on how the market develops, and if necessary, the rationale will be clearly revised accordingly.
As always, we will continue to track this idea and refine our logic based on the real-time developments and structures, further solidifying the grounds for the long bet.
Wishing you continued good fortune.
BULLA/USDT - its Bull market !!!BULLA has reclaimed back 0.07 zone showing strong step in from buyers DCA in green box targeting 0.125
SL blow last swing low

OPUSDT: Buyers try to regain control inside the rangeHi traders and investors!
On the daily timeframe, OPUSDT is trading in a sideways range. The price has repeatedly dipped below the lower boundary at 0.545, but each time, buyers managed to bring it back.
Now, we’re seeing another attempt to return into the consolidation zone — a possible sign of renewed buyer initiative.
If the price secures above 0.545, the path opens toward the next targets at 0.844 and 0.954. However, a short-term dip below 0.52 may occur within this bullish scenario.
Therefore, buying becomes a priority once the price is firmly back above 0.545.
This analysis is based on the Initiative Analysis concept (IA).
Wishing you profitable trades!

BTC IS ABOUT THE RETEST THE 100.000 RANGE AGAIN BTC is about to break out of a bearish wedge and according to the Fibonacci extension it will test the $100,000 range again! I can also analyze a bearish divergence on 1 hour chart. Good luck folks... What are your ideas on that one?
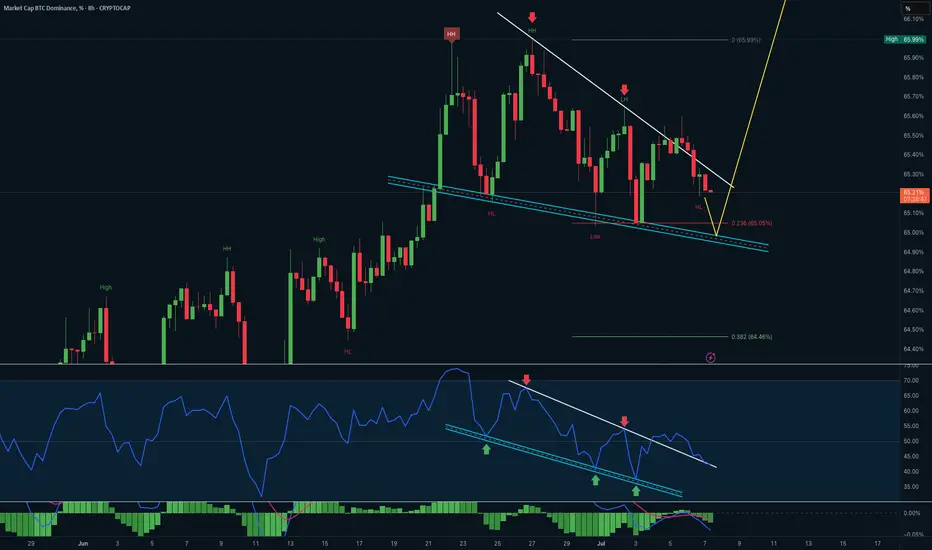
BTC Dominance: Falling Wedge Forming with RSI Channel DivergenceThis 8H BTC.D chart is showing signs of a potential bullish reversal setup within a falling wedge, supported by RSI channel divergence and MACD structure.
Price Action:
• BTC.D is compressing within a falling wedge, marked by lower highs and higher lows.
• Price is currently near the lower boundary of the wedge, with confluence at the 0.236 Fibonacci level (65.05%) and historical HL zone.
• A break above the wedge resistance would signal trend reversal or continuation toward 66% - 67%.
RSI Momentum:
• RSI mirrors price by forming a descending channel, with multiple bullish bounces at lower support.
• Repeated touches on the lower band suggest momentum divergence building from oversold conditions.
• A break of RSI’s trendline would confirm bullish shift ahead of price breakout.
MACD Histogram:
• Flattening after bearish pressure, signaling that sellers may be losing momentum.
• Watch for cross up to accompany price breakout for stronger confirmation.
📌 Key Takeaways:
• Bullish reversal potential building within wedge
• RSI showing leading divergence from price
• Break above 65.5% zone could trigger a move to 66.0%–66.3%
• Breakdown of wedge invalidates the structure → next support: 64.46%
#ZEUS/USDT#ZEUS
The price is moving within a descending channel on the 1-hour frame, adhering well to it, and is heading for a strong breakout and retest.
We have a bounce from the lower boundary of the descending channel. This support is at 0.1485.
We have a downtrend on the RSI indicator that is about to be broken and retested, supporting the upside.
There is a major support area in green at 0.1420, which represents a strong basis for the upside.
Don't forget a simple thing: ease and capital.
When you reach the first target, save some money and then change your stop-loss order to an entry order.
For inquiries, please leave a comment.
We have a trend of consolidation above the 100 Moving Average.
Entry price: 0.1618
First target: 0.1690
Second target: 0.1785
Third target: 0.1911
Don't forget a simple thing: ease and capital.
When you reach the first target, save some money and then change your stop-loss order to an entry order.
For inquiries, please leave a comment.
Thank you.

#GALA/USDT#GALA
The price is moving within a descending channel on the 1-hour frame, adhering well to it, and is poised to break it strongly upwards and retest it.
We have a bounce from the lower boundary of the descending channel. This support is at 0.01340.
We have a downtrend on the RSI indicator that is about to break and retest, supporting the upward trend.
There is a key support area in green at 0.01320, which represents a strong basis for the upward trend.
Don't forget one simple thing: ease and capital.
When you reach the first target, save some money and then change your stop-loss order to an entry order.
For inquiries, please leave a comment.
We have a trend of stability above the Moving Average 100.
Entry price: 0.01430
First target: 0.01465
Second target: 0.01500
Third target: 0.01533
Don't forget one simple thing: ease and capital.
When you reach the first target, save some money and then change your stop-loss order to an entry order.
For inquiries, please leave a comment.
Thank you.

$CHILLGUY Breakout Confirmed, Retest in Progress!#CHILLGUY just broke out after weeks of accumulation.
The price was stuck in a tight range for nearly a month, forming a clear symmetrical triangle just under major resistance. After multiple tests, bulls finally pushed through both the trendline and horizontal resistance around $0.054–$0.056.
This breakout is backed by strong volume and structure. The breakout zone is now being retested, which could act as a new support before the next leg up.
Key Breakout Level: $0.056
Target Zone: $0.072 – $0.078
Invalidation: Close back inside the old range below $0.054
If the retest holds, we may be looking at a 40%+ upside move from here.
DYOR, NFA
#Chillguy

Moodeng Set to Drop 33% with Target at 0.12500 SoonHello,✌
let’s dive into a full analysis of the upcoming price potential for Moodeng 🔍📈.
OKX:MOODENGUSDT is currently approaching the upper boundary of a strong descending channel, aligned with a significant daily resistance level. Given this setup, a correction of at least 33% appears likely, with the main target near 0.12500. Traders should watch for confirmation before entering positions. ⚠️📉
✨ Need a little love!
We pour love into every post your support keeps us inspired! 💛 Don’t be shy, we’d love to hear from you on comments. Big thanks , Mad Whale 🐋

#LEVER/USDT#LEVER
The price is moving within a descending channel on the 1-hour frame and is expected to break and continue upward.
We have a trend to stabilize above the 100 moving average once again.
We have a downtrend on the RSI indicator that supports the upward break.
We have a support area at the lower boundary of the channel at 0.0001404, acting as strong support from which the price can rebound.
Entry price: 0.0001529
First target: 0.0001795
Second target: 0.0002040
Third target: 0.0002333
To manage risk, don't forget stop loss and capital management.
When you reach the first target, save some profits and then change the stop order to an entry order.
For inquiries, please comment.
Thank you.
