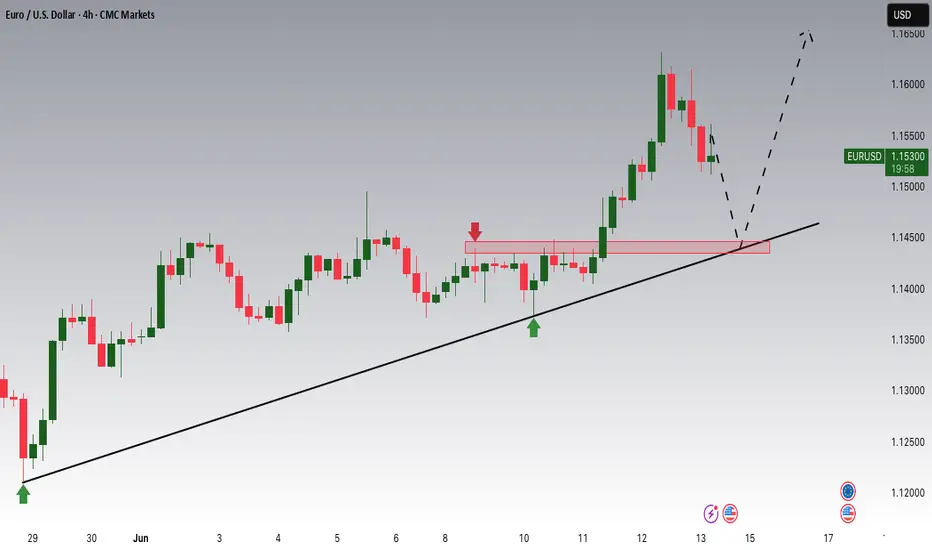
EURUSD Long Setup – Bullish Rejection from Demand ZoneEURUSD remains supported by strong eurozone fundamentals and broad USD softness. The pair has retraced into a key demand zone around 1.1490 and is showing signs of bullish rejection. With the Fed likely to pause further rate hikes and the ECB maintaining a steady tone, the bias favors further upside toward recent highs.
⚠️ Geopolitical tensions in the Middle East (Israel-Iran conflict) have introduced mild safe haven demand, but so far the USD has underperformed versus the euro, suggesting EUR remains relatively insulated.
Watch for confirmation and entries within the blue demand box.
🔍 Technical Analysis:
Structure: Clear uptrend with higher highs and higher lows. Price retraced to a well-defined 1H demand zone between 1.1490–1.1500.
Setup: Anticipating a bounce from the demand zone targeting the recent high near 1.1620–1.1630.
Entry Zone: 1.1490–1.1500 (bullish reaction area)
Target: 1.1620–1.1630 (previous supply zone)
Stop Loss: Below 1.1439 (recent swing low)
Risk-Reward Ratio: Approximately 1:2.5
🧠 Fundamental Context (as of June 16):
EUR Bias: Bullish – ECB has paused cuts; euro is resilient despite geopolitical headwinds.
USD Bias: Bearish – Fed is on pause; soft inflation data and geopolitical risks weigh on dollar strength.
Key Drivers:
Fed dovish tone (FOMC pause, lower CPI)
Strong EU resilience despite global tensions
CHF and JPY attracting safe haven flows over USD
📅 Key Events to Watch:
US Core PCE (next major inflation readout)
FOMC commentary and Fed speakers
Eurozone CPI and sentiment data
Forex market

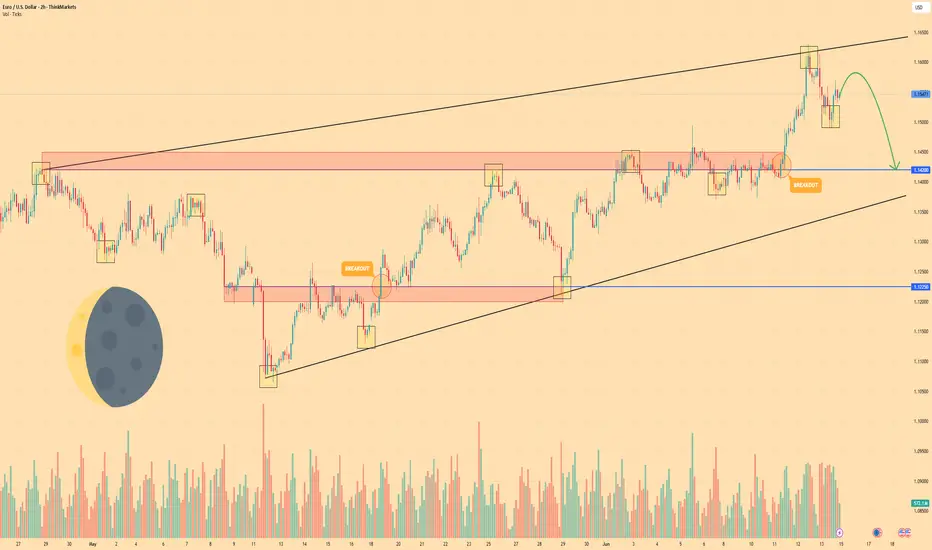
EURO - Pirce can make movement up and then drop to $1.1420Hi guys, this is my overview for EURUSD, feel free to check it and write your feedback in comments👊
After entering the wedge, Euro began to slow down, creating a tightening structure between support and resistance.
Price corrected toward the support line of the wedge, where it briefly paused and bounced with weak momentum.
The bounce triggered a breakout above local resistance, but buyers failed to hold the price at higher levels.
Soon after, the market reversed from the wedge’s upper boundary and began forming a bearish rejection pattern.
Now price trades just below the recent highs, showing fading demand and early signs of short-term reversal.
I expect Euro to move lower and reach the $1.1420 support level — my current target in this scenario.
If this post is useful to you, you can support me with like/boost and advice in comments❤️
Disclaimer: As part of ThinkMarkets’ Influencer Program, I am sponsored to share and publish their charts in my analysis.
GBPJPY Potential DownsidesHey Traders, in tomorrow's trading session we are monitoring GBPJPY for a selling opportunity around 195.600 zone, GBPJPY is trading in a downtrend and currently is in a correction phase in which in which it is approaching the trend at 195.600 support and resistance area.
Trade safe, Joe.

#EURJPY: Major Swing Sell +1100 Pips, One Not To Miss! The Japanese Yen (JPY) is most likely to continue its bullish trend, as the Dollar Index (DXY) is expected to decline due to the ongoing conflict between Israel and Iran. Historically, JPY and CHF, alongside gold and silver, have been favoured by global investors and remain bullish. Strong fundamentals and technical support further support our analysis.
The 167-169 price region remains a critical point for sellers, where we anticipate significant selling volume. There are two entry points to consider: one near the current price and another slightly further away. Please monitor volume and use smaller time frames for entries.
Our Swing Target is at 154, but you can also target smaller zones once the trade is activated. For instance, set take-profit levels at 164, 160, and finally, at 154.
To encourage and support us, you can like the idea, comment on it, or share it.
Team Setupsfx_
❤️❤️🚀🚀

NZDUSD Potential UpsidesHey Traders, in today's trading session we are monitoring NZDUSD for a buying opportunity around 0.60000 zone, NZDUSD is trading in an uptrend and currently is in a correction phase in which it is approaching the trend at 0.600000 support and resistance area.
Trade safe, Joe.

AUDJPY Potential UpsidesHey Traders, in today's trading session we are monitoring AUDJPY for a buying opportunity around 93.600 zone, AUDJPY is trading in an uptrend and currently is in a correction phase in which it is approaching the trend at 93.600 support and resistance area.
Trade safe, Joe.

EURUSD: Bullish Move After BreakoutThe price action on EURUSD shows that it broke through a horizontal resistance level on the 4-hour chart.
Following the breakout, a local correction occurred, forming a bullish flag pattern.
As the NY session opened, the market rose and surpassed its resistance line, indicating a strong likelihood of continued upward movement.
The target is set at 1.1616.

Israel-Iran Confrontation. (I expect upward movement in USD/CADIsrael and Iran are exchanging missile strikes, but it seems markets are trying to play their own game, assuming that this conflict will not cross the nuclear threshold. in the meantime, investors are shifting their focus to key events this week.
The main highlights will be the consumer inflation reports from the UK and the eurozone. In the EU, inflation is expected to stabilize at 1.9%, while in the UK, it is forecast to decrease from 3.5% to 3.3% year over year.
This week will also bring central bank meetings in Switzerland, the UK, and, of course, the U.S. Federal Reserve-which will likely take center stage and divert attention from the tow European central banks.
Other events worth focusing on include the release of the Philadelphia Fed Manufacturing Index U.S. retail sales figures.
But let's return to the week's main event-the Fed's final monetary policy decision, which will be made over two days, Tuesday and Wednesday. According to the consensus forecast, the central bank is expected to leave the key interest rate unchanged at 4,50% The main reasons for this are persistently high consumer inflation figures, which showed an annual increase last week (albeit smaller than expected), and uncertainty about the consequences of Donald Trump's presidency. Fed Chair Jerome Powell has previously cited both as reasons to pause the rate-cutting cycle.
So, what might come of the Fed holding rates steady?
Frankly, not much. Ongoing uncertainty will continue to be the primary driving force in the markets. Traders are starting to anticipate rate cuts in the second half of the year. However, I believe there is a strong chance that rates will remain unchanged until next year. This is due not only to risk of inflation returning to 3% and the murky geoeconomic policies of the U.S.-China trade war and its unclear outcome.
Given this combination of negative factors-each of which obstructs rate cuts-and the fact that the market has already priced these into its expectations, we can anticipate a continuation of existing trends.
The pair is declining amid rising crude oil prices, which support the Canadian dollar, a commodity-linked currency. If oil prices resume upward momentum, USD/CAD will face pressure again. If the pair fails to rise above 1,3600, a decline toward 1.3435 is likely. A potential sell level is 13560.

Smart Money Just Flipped Bearish on USD/CAD. Are You Still Long?🧠 1. COT Context & Institutional Flows
🇨🇦 CAD COT Report (CME) – June 10, 2025
Non-Commercials (speculators): net short 93,143 contracts (19,651 long vs. 112,794 short), with a short reduction of -14,319 → early bearish unwinding.
Commercials: net long 91,207 contracts (223,285 long vs. 132,078 short), with strong accumulation (+27,999 longs).
🔄 Net open interest change: +18,436 → renewed institutional interest on the long CAD side.
🇺🇸 USD Index COT Report (ICE) – June 10, 2025
Non-Commercials: net long 1,402 contracts (17,027 long vs. 15,625 short), with a +1,279 increase in longs → modest USD support.
Commercials remain net short -35 contracts, no clear shift.
🔄 Total open interest +2,652 → mild bullish interest in USD.
📌 Implication: Strong institutional support for CAD, USD mildly supported. Net positioning favors downside pressure on USD/CAD.
💹 2. Technical Analysis & Price Action
Primary trend: clearly bearish from the 1.38 zone.
Current price: 1.3552, testing a macro demand zone (1.3470–1.3540).
Daily RSI remains deeply oversold → possible technical bounce, but no reversal structure confirmed.
Recent candles show lower highs and lower lows, with no bullish momentum.
📌 Implication: The bearish trend remains in control. A technical rebound is possible, but bias stays short as long as price trades below 1.3640.
📈 3. Retail Sentiment
77% of retail traders are long USD/CAD, with an average entry at 1.3646.
Only 23% are short, positioned better at 1.3790.
📌 Implication: Retail is heavily long → contrarian bearish signal confirmed.
📊 4. Seasonality
June is historically weak for USD/CAD:
5Y Avg: -0.0118
2Y Avg: -0.0081
The June seasonal curve shows a stronger downside acceleration into the second half of the month.
📌 Implication: Seasonality adds downward pressure into month-end.

EUR/USD 4H CHART PATTERN.EUR/USD 4H chart, the chart analysis shows a bearish outlook after a potential rising channel breakdown. Here are the key bearish targets as shown:
---
📉 Bearish Targets:
1. First Target Zone (FVG Area)
Price Range: Around 1.1400 – 1.1350
This is marked as the Fair Value Gap (FVG) and could act as the first reaction/support zone.
2. Second Target Zone
Price Range: Around 1.1250 – 1.1200
Clearly labeled as “TARGET” in the middle of the chart.
3. Final Target Zone (Major Support)
Price Range: Around 1.1100 – 1.1050
Also labeled “TARGET” at the bottom. This aligns with a past support level and previous consolidation area.
---
🧭 Summary:
A breakdown from the rising channel is expected.
Price may drop first into the FVG zone (1.1350 area).
Then continue down to 1.1200.
Final support target sits near 1.1050.
Would you like me to help identify bullish invalidation or risk levels as well?

USD/JPY) Bearish trend analysis Read The ChaptianSMC trading point update
Technical analysis iUSD/JPY on the 30-minute timeframe, showing a rejection from resistance zones and a potential move toward lower support levels.
---
Analysis Breakdown
Technical Components:
1. Resistance Zones:
Primary Resistance: Near 145.500 (upper yellow box), which has previously been rejected multiple times (red arrows).
FVG (Fair Value Gap) Resistance Level: Around 144.400, also acting as strong resistance, especially near the EMA 200.
2. Downtrend Line:
The price is moving below a downward trendline, respecting bearish structure.
Last rejection from both the trendline and FVG zone confirms selling pressure.
3. EMA 200 (144.075):
Price is hovering around this level, showing indecision.
Bearish bias remains unless price breaks and holds above it.
4. Target Zone:
A clearly marked support level around 142.543, shown as the bearish target.
Includes multiple event markers (potential news catalysts or key dates), suggesting added volatility.
5. RSI (14):
Currently near 55.23, with a prior rejection from higher RSI levels.
Bearish divergence not clear, but no overbought conditions.
---
Bearish Idea Summary:
Thesis: Rejection from resistance zones + trendline + EMA suggests continuation to downside.
Expecting: Price to either:
Retest the upper resistance zone (around 145.000–145.500) and reject again, or
Break below current levels and continue lower toward 142.543.
---
Trade Idea Concept:
Entry Option 1: Sell on confirmed rejection from FVG zone or upper resistance.
Entry Option 2: Sell on break and retest below 144.000.
Target: 142.543 (support zone).
Stop Loss: Above the resistance zone or trendline (e.g., >145.600).
Mr SMC Trading point
Risks to Watch:
Invalidation: Clean break and close above 145.500 would invalidate the bearish setup.
News Impact: Note the icons near the target zone – monitor economic releases around that time.
---
Please support boost 🚀 this analysis)

Euro can turn around and start to fall to support areaHello traders, I want share with you my opinion about Euro. Observing this chart, we can see how the price earlier dropped toward the 1.1360 support level and successfully broke it. Then we saw a short recovery move, but the price once again returned to the downside and retested the support line from below. After that, the market created a strong upward impulse, broke back above the 1.1360 level, and entered a phase of consolidation inside a range. This range held for some time, with price respecting both its upper and lower boundaries. Eventually, we saw a breakout from this consolidation, followed by another strong bullish impulse and a steady climb above the 1.1530 zone, where price is currently trading. However, the price has now approached a critical structure and is showing signs of weakening momentum. In my mind, the Euro may attempt one more small move up but then turn around and start declining toward the 1.1530 support level, breaking the ascending support line as well. That's why my TP is this support level, which coincides with the support area. Please share this idea with your friends and click Boost 🚀
Disclaimer: As part of ThinkMarkets’ Influencer Program, I am sponsored to share and publish their charts in my analysis.

Retail is 86% Long on GBPCHF… But Smart Money Is Setting a Trap📊 1. RETAIL SENTIMENT
Long Positions: 86% – Average Entry: 1.1196
Short Positions: 14% – Average Entry: 1.0999
Current Price: 1.1010
Analysis:
Retail positioning is heavily skewed towards longs, with the average long entry significantly above the current market price. This creates vulnerability to downside pressure through stop-loss hunting or a bearish squeeze. Such extreme retail bias often acts as a contrarian signal: smart money may continue pushing the price lower to flush out retail traders before any meaningful reversal occurs.
🧾 2. COMMITMENTS OF TRADERS – COT REPORT (June 10, 2025)
🔹 British Pound (GBP)
Non-Commercials (Speculators): Net Long increasing by +7.4K → now at +51.6K
Commercials (Hedgers): Net Short decreasing by -13.9K → now at -60.5K
Total Open Interest: Decreased by -19K
Interpretation:
Speculators are maintaining strong long exposure on GBP, while commercials are covering some shorts—potentially signaling a short-term pause in bullish momentum. However, the drop in overall open interest suggests possible consolidation or short-term uncertainty.
🔹 Swiss Franc (CHF)
Non-Commercials: Net Shorts reduced by -2.7K
Commercials: Net Longs increased by +2.5K
Total Open Interest: Increased by +5.6K
Interpretation:
The CHF is gaining strength. Commercial participants are increasing their long exposure while speculators reduce their shorts—this positive divergence supports a bullish outlook on CHF, especially against retail-heavy long pairs like GBP.
📈 3. CHF SEASONALITY – JUNE
Average CHF Performance in June:
20-Year Avg: +0.0099
15-Year Avg: +0.0138
10-Year Avg: +0.0099
5-Year Avg: +0.0039
Analysis:
Historically, June is a seasonally strong month for the Swiss Franc. This seasonal bias aligns with current macro conditions, reinforcing the bullish case for CHF.
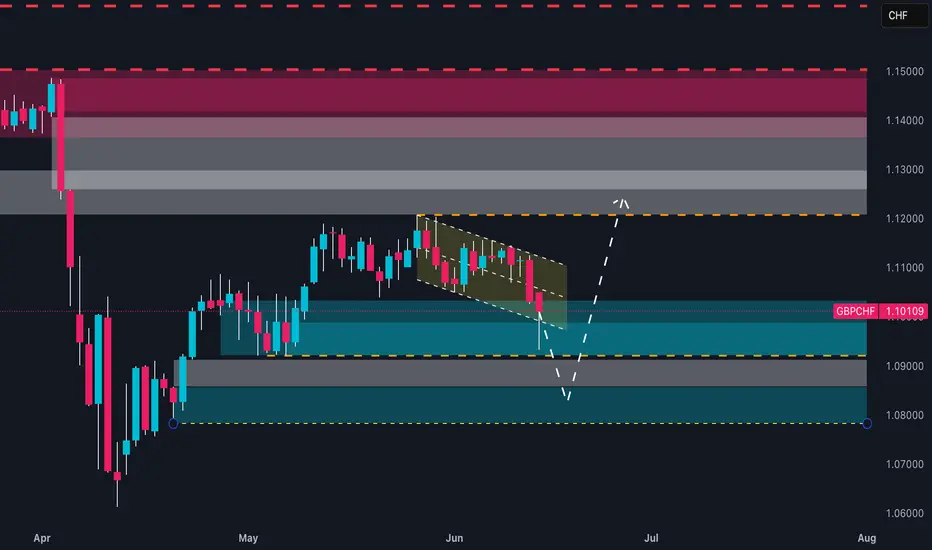
📊 4. TECHNICAL ANALYSIS (Daily Chart)
Pattern: Descending channel with a recent false breakdown and re-entry
Key Support Zone: 1.0980–1.1000 → tested and defended with a bullish wick
Target Resistance: 1.1170–1.1200 → prior retail cluster, supply zone, and average long entry
Scenario: A confirmed breakout of the channel could trigger a short squeeze toward 1.1170–1.1200
📌 STRATEGIC OUTLOOK
The current GBP/CHF setup is technically and sentimentally delicate. The price sits on a major daily demand zone, while sentiment and macro flows suggest downside pressure remains in play—but also allow room for a potential contrarian rally (short squeeze).
👉 Action Plan:
Wait for intraday/daily confirmation:
Go long above 1.1045 (breakout confirmation) → target 1.1170
Go short below 1.0980 (bearish continuation) → target 1.0860
Try a RR1 🔻 Sell Setup 1
Entry: 1.15600
SL: 1.16160
TP: 1.15050
R:R ≈ 1
Rejected from 1.160; Signal bar key bar detected.
Please manage your risk.

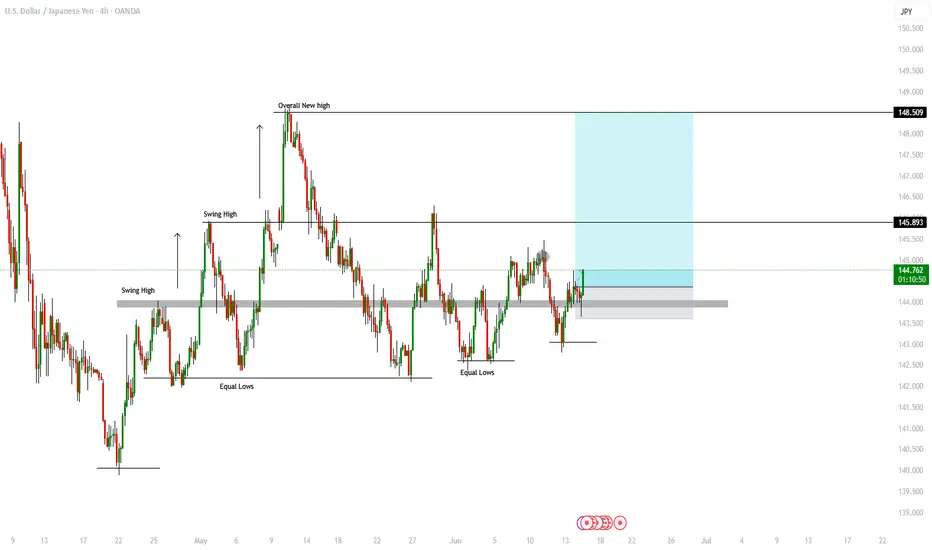
OANDA:USDJPY Buys SetupThe market has recently rebounded from a key support zone, showing strong bullish momentum and forming higher lows—a classic sign of accumulating demand. Price action suggests a potential breakout to the upside, possibly driven by liquidity resting above recent swing highs. If history is any guide, this pattern could signal further continuation in the direction of the trend.
Trade Setup (Risk Parameters):
Entry: 144.372
Stop Loss: 143.599
Target Levels:
Take Profit 1: 145.889
Take Profit 2: 148.508
This setup offers a favorable risk-to-reward ratio, aligning with recent market structure and momentum. As always, manage risk appropriately and monitor price action closely.
Let me know your thoughts in the comments. If this analysis resonates with your trading style, consider giving it a boost and follow for more high-probability setups. Stay disciplined and trade safe!
Lingrid | USDCHF long Trading Opportunity from Strong SupportThe price perfectly fulfills my previous idea . FX:USDCHF just printed a new lower low at the bottom of a wide downward channel, completing a textbook bearish leg from the triangle breakdown. The price is showing signs of local accumulation with a possible double bottom forming near 0.8078 support. If a bullish bounce holds, the next target lies near the confluence of the upward trendline and 0.8200 zone.
📈 Key Levels
Buy zone: 0.8060–0.8080
Sell trigger: breakdown below 0.8050
Target: 0.8200
Buy trigger: strong bullish engulfing above 0.8125
💡 Risks
Break below 0.8050 reopens path to 0.7980
Weak recovery could form another lower high
Downward channel remains dominant until confirmed breakout
Traders, if you liked this idea or if you have your own opinion about it, write in the comments. I will be glad 👩💻

Bearish continuation for the Loonie?The price has rejected off the pivot and could drop to the 1st support which acts as a pullback support.
Pivot: 1.3725
1st Support: 1.3430
1st Resistance: 1.3837
Risk Warning:
Trading Forex and CFDs carries a high level of risk to your capital and you should only trade with money you can afford to lose. Trading Forex and CFDs may not be suitable for all investors, so please ensure that you fully understand the risks involved and seek independent advice if necessary.
Disclaimer:
The above opinions given constitute general market commentary, and do not constitute the opinion or advice of IC Markets or any form of personal or investment advice.
Any opinions, news, research, analyses, prices, other information, or links to third-party sites contained on this website are provided on an "as-is" basis, are intended only to be informative, is not an advice nor a recommendation, nor research, or a record of our trading prices, or an offer of, or solicitation for a transaction in any financial instrument and thus should not be treated as such. The information provided does not involve any specific investment objectives, financial situation and needs of any specific person who may receive it. Please be aware, that past performance is not a reliable indicator of future performance and/or results. Past Performance or Forward-looking scenarios based upon the reasonable beliefs of the third-party provider are not a guarantee of future performance. Actual results may differ materially from those anticipated in forward-looking or past performance statements. IC Markets makes no representation or warranty and assumes no liability as to the accuracy or completeness of the information provided, nor any loss arising from any investment based on a recommendation, forecast or any information supplied by any third-party.

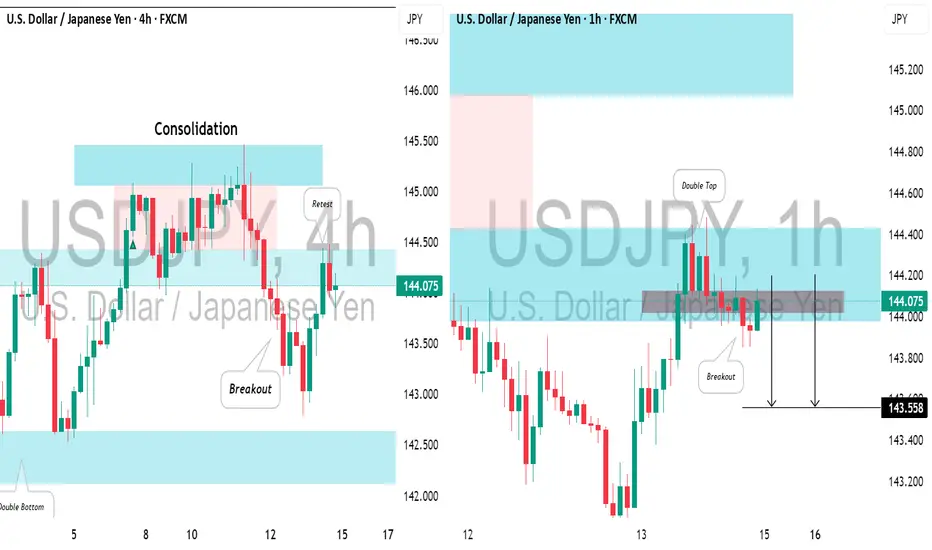
USDJPY: Intraday Bearish ConfirmationIn the middle of last week, I spotted a valid confirmed structure breakout on 📉USDJPY on a 4-hour timeframe.
Currently, the pair is retesting the broken structure, and the price has formed a strong bearish confirmation on the hourly chart.
I see a double top pattern and a violation of its neckline.
With high probability, the price will fall and reach the 144.02 level.
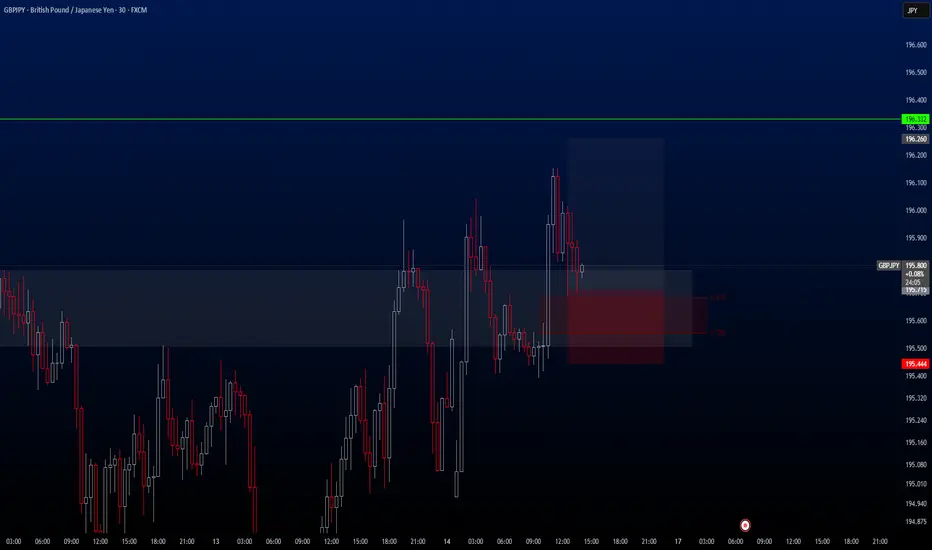
GBPJPY Hello traders.
Today's first trade comes from the GBPJPY pair. The trade is currently active on my side, and I’m happy to share it with you as well.
🔍 Trade Details
✔️ Timeframe: 15-Minute
✔️ Risk-to-Reward Ratio: 1:2
✔️ Trade Direction: Buy
✔️ Entry Price: 195.715
✔️ Take Profit: 196.260
✔️ Stop Loss: 195.444
🔔 Disclaimer: This is not financial advice. I’m simply sharing a trade I’ve taken based on my personal trading system, strictly for educational and illustrative purposes.
📌 Interested in a systematic, data-driven trading approach?
💡 Follow the page and turn on notifications to stay updated on future trade setups and advanced market insights.
GBPUSD Making Its Prices HighGBP/USD now faces some renewed selling orders and slips back to the 1.3600 zone on Monday. Cable's decent gains come on the heels of rising pessimism about the US Dollar and encouraging geopolitical news.

EURUSD Potential UpsidesHey Traders, in today's trading session we are monitoring EURUSD for a buying opportunity around 1.14500 zone, EURUSD is trading in an uptrend and currently is in a correction phase in which it is approaching the trend at 1.14500 support and resistance area.
Trade safe, Joe.
Eurusd Will Drop Its PricesEUR/USD continues to recover ground lost and now extends the rebound to the 1.1550 zone on Friday. Meanwhile, the US Dollar maintain its bullish bias intact in response to a significant flight to safety amid increasing geopolitical concerns, while positive consumer sentiment data also contribute to the daily uptick.

GBPUSD Analysis Today: Technical and Order Flow !In this video I will be sharing my GBPUSD analysis today, by providing my complete technical and order flow analysis, so you can watch it to possibly improve your forex trading skillset. The video is structured in 3 parts, first I will be performing my complete technical analysis, then I will be moving to the COT data analysis, so how the big payers in market are moving their orders, and to do this I will be using my customized proprietary software and then I will be putting together these two different types of analysis.
