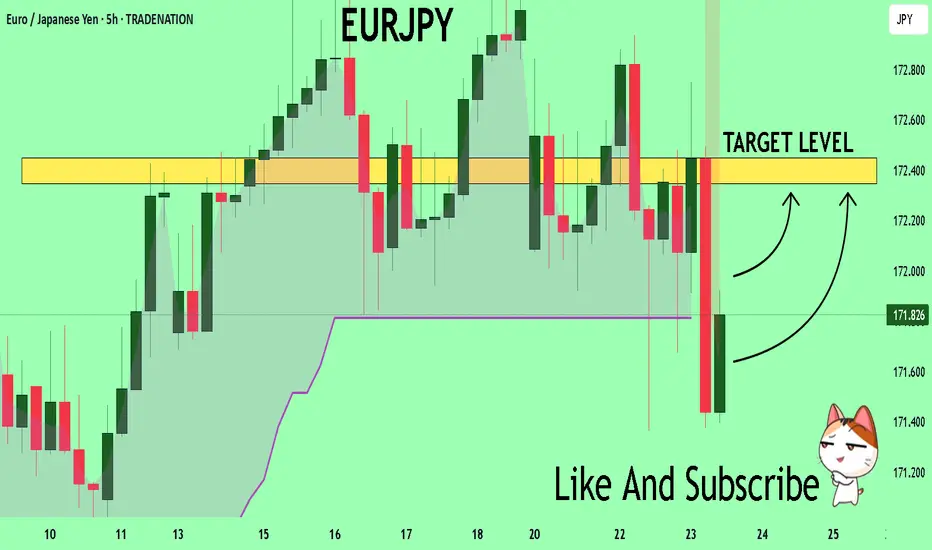
EURJPY Will Explode! BUY!
My dear subscribers,
My technical analysis for EURJPY is below:
The price is coiling around a solid key level - 171.82
Bias - Bullish
Technical Indicators: Pivot Points Low anticipates a potential price reversal.
Super trend shows a clear buy, giving a perfect indicators' convergence.
Goal - 172.34
About Used Indicators:
By the very nature of the supertrend indicator, it offers firm support and resistance levels for traders to enter and exit trades. Additionally, it also provides signals for setting stop losses
Disclosure: I am part of Trade Nation's Influencer program and receive a monthly fee for using their TradingView charts in my analysis.
———————————
WISH YOU ALL LUCK
Forex market
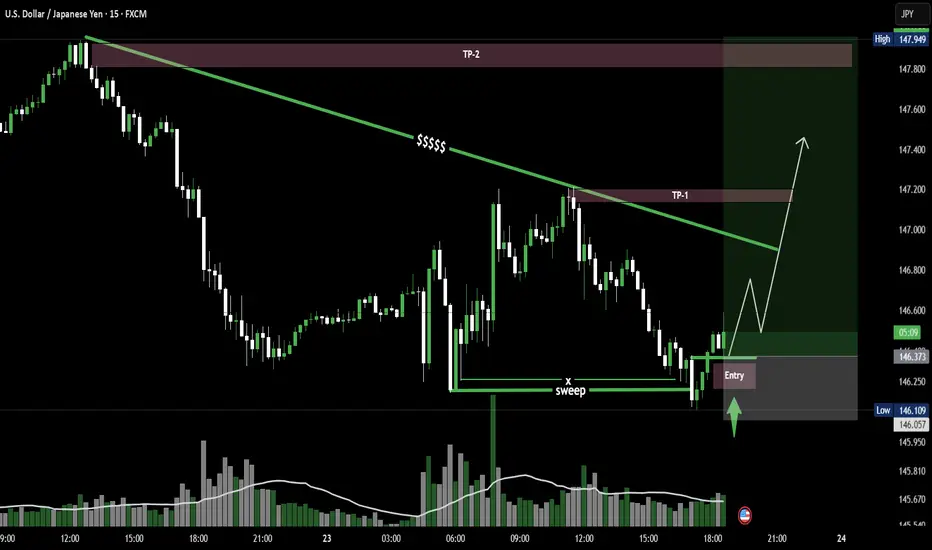
USD/JPY - 15MIN Sweep, Reclaim, LaunchUSD/JPY on the 15M chart shows a clean liquidity sweep followed by a strong reclaim and entry confirmation. Price is now pushing toward TP1 near the descending trendline and could extend to TP2, a key supply zone. Classic SMC structure in motion.
USD/JPY – Sweep, Reclaim, Launch 🚀
Sell gbpusdStrong selling wave coming
Recently broke its buy trend line
Monthly still overbought pair

GBPUSD 15M Setup In the 1-hour timeframe, the trend is down, so in the 15-minute timeframe, we look for bearish order blocks. As shown in the image, we expect the price to reach the 15-minute order block and then fall to 1.35480.

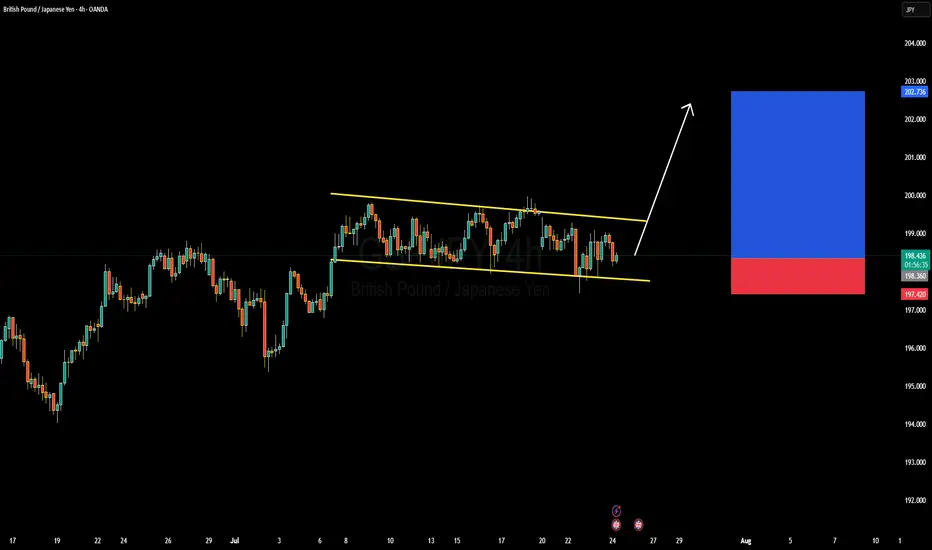
GBPJPY Forming Descending ChannelGBPJPY is currently trading within a well-defined descending channel on the 4H chart, showing signs of building pressure toward an upside breakout. The price has consistently respected both the upper and lower bounds of this channel, creating a controlled correction within a larger bullish trend. With the recent bounce off the lower channel boundary, the pair is now preparing for a potential bullish breakout, aiming for a target zone near 202.700 in the coming sessions.
From a fundamental perspective, the British pound is benefiting from hawkish commentary by the Bank of England, which continues to battle sticky inflation. The latest UK inflation data suggests that price pressures remain elevated, prompting market participants to anticipate further tightening or a prolonged hold in interest rates. On the other hand, the Japanese yen continues to weaken due to the Bank of Japan’s ultra-loose monetary policy, making GBPJPY attractive for long positions amid widening yield differentials.
Technically, the structure remains bullish in the broader context, and this descending channel looks more like a bullish flag—a continuation pattern. If bulls maintain momentum and break above the upper trendline near 199.50, we can expect a strong impulsive move toward the 202–203 zone. The risk remains well-defined below 197.40, which is the recent swing low, giving a healthy risk-to-reward setup for traders.
With strong technical structure and fundamental divergence favoring the British pound over the yen, GBPJPY presents a high-probability long opportunity. I'm looking for confirmation of a breakout on lower timeframes, and once triggered, I expect clean bullish follow-through. Stay ready for the breakout—it’s a textbook setup aligning with macro and technical confluence.
GBPCHF NEXT BIG MOVE MIGHT OCCUR SOON!Price has been moving in a tight consolidation lately. Following the rebound we saw around 1.06900 level. From the technical standpoint, I’d anticipate a breakout above the trendline for more bullish price action continuation.

GBPCAD Q3 | D24 | W30 | Y25📊GBPCAD Q3 | D24 | W30 | Y25
Daily Forecast🔍📅
Here’s a short diagnosis of the current chart setup 🧠📈
Higher time frame order blocks have been identified — these are our patient points of interest 🎯🧭.
It’s crucial to wait for a confirmed break of structure 🧱✅ before forming a directional bias.
This keeps us disciplined and aligned with what price action is truly telling us.
📈 Risk Management Protocols
🔑 Core principles:
Max 1% risk per trade
Only execute at pre-identified levels
Use alerts, not emotion
Stick to your RR plan — minimum 1:2
🧠 You’re not paid for how many trades you take, you’re paid for how well you manage risk.
🧠 Weekly FRGNT Insight
"Trade what the market gives, not what your ego wants."
Stay mechanical. Stay focused. Let the probabilities work.
FRGNT

AUDJPY Q3 | D24 | W30 | Y25📊AUDJPY Q3 | D24 | W30 | Y25
Daily Forecast🔍📅
Here’s a short diagnosis of the current chart setup 🧠📈
Higher time frame order blocks have been identified — these are our patient points of interest 🎯🧭.
It’s crucial to wait for a confirmed break of structure 🧱✅ before forming a directional bias.
This keeps us disciplined and aligned with what price action is truly telling us.
📈 Risk Management Protocols
🔑 Core principles:
Max 1% risk per trade
Only execute at pre-identified levels
Use alerts, not emotion
Stick to your RR plan — minimum 1:2
🧠 You’re not paid for how many trades you take, you’re paid for how well you manage risk.
🧠 Weekly FRGNT Insight
"Trade what the market gives, not what your ego wants."
Stay mechanical. Stay focused. Let the probabilities work.
FRGNT

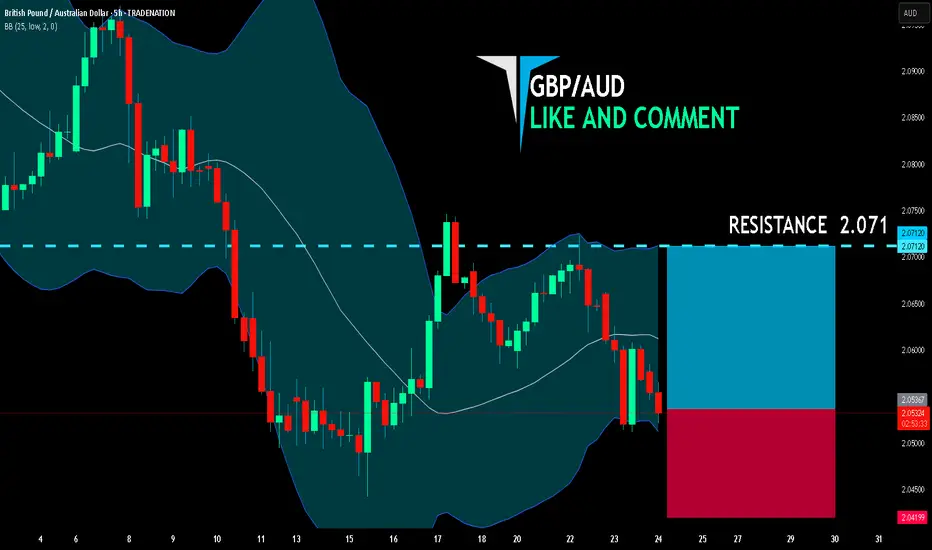
GBP/AUD LONG FROM SUPPORT
GBP/AUD SIGNAL
Trade Direction: long
Entry Level: 2.053
Target Level: 2.071
Stop Loss: 2.041
RISK PROFILE
Risk level: medium
Suggested risk: 1%
Timeframe: 5h
Disclosure: I am part of Trade Nation's Influencer program and receive a monthly fee for using their TradingView charts in my analysis.
✅LIKE AND COMMENT MY IDEAS✅
Sell EURGBPEURGBP is beginning to turn around after a great 3 month bull run. Price is indicative of bearish movement.

Possible GBY/JPY bullish?I did mark my chart. You can look at it and decipher accordingly! If you have any ideas or mark ups please drop them or tag me in them :)

EUR/USD About to Trap the Bears? Final Push Before the Drop! EUR/USD is showing a solid short-term bullish structure, with a move initiated from the demand base around 1.1560, fueling a strong rally toward the current level near 1.1770. Price is now approaching a significant supply zone between 1.1790 and 1.1875, previously responsible for the last major bearish swing. This area also aligns with projected Fibonacci levels (25%-100%), reinforcing its relevance as a possible inflection point.
This movement suggests there’s still room for price to push higher, likely completing the final leg of this bullish cycle before a more convincing short setup develops. At this stage, Fibonacci levels are not acting as firm supports, but rather as hypothetical pullback projections: once price enters the 1.1800–1.1875 area, it will be key to monitor for signs of exhaustion. A rejection here may initiate a bearish retracement toward 1.1670–1.1650, in line with the 62–70.5% fib levels.
Retail sentiment remains highly contrarian: 76% of traders are short, positioning themselves too early against the trend. This imbalance adds fuel for a potential continuation higher, as the market may seek to "squeeze" these premature shorts. Additionally, the COT report confirms growing institutional interest in the euro, with non-commercials increasing their net longs, while USD net long exposure continues to shrink.
Seasonality adds further confluence: late July is historically bullish for EUR/USD, suggesting one final leg up could materialize before a typically weaker August.
✅ Trading Outlook
EUR/USD is technically aligned for a final push toward the 1.1800–1.1875 premium zone, where a potential short opportunity may arise. The rally is currently driven by overextended retail shorts and supportive institutional flows. Only after price interacts with the upper supply zone should reversal signs be evaluated, with correction targets around 1.1670–1.1650. The ideal play: wait for confirmation of bearish intent in August, when seasonal weakness typically kicks in.

NZD-JPY Resistance Ahead! Sell!
Hello,Traders!
NZD-JPY is trading in an
Uptrend but the pair is locally
Overbought so after the pair
Hits the horizontal resistance
Level of 88.900 we will be
Expecting a local bearish
Move down
Sell!
Comment and subscribe to help us grow!
Check out other forecasts below too!
Disclosure: I am part of Trade Nation's Influencer program and receive a monthly fee for using their TradingView charts in my analysis.

USDJPY Technical Analysis – Key Support Zone in Focus!USDJPY Technical Analysis – Key Support Zone in Focus!
As shown in the chart, USDJPY has broken out of its long-term trendline and is now trading within a rising channel structure. Currently, the price is sitting near a crucial support zone at 145.190, which could play a decisive role in the pair’s next move.
🔹 If this support holds, we may see a bullish continuation towards the following key resistance levels:
First target: 151.110
Next target: 160.100 (upper bound of the channel)
🔻 However, if the 145.190 support fails, the price could decline toward the bottom of the rising channel, with the next major support near:
136.000
📌 This area is critical for swing and position traders. Price action in this zone will likely provide strong signals for entry or exit.
📊 Follow for more real-time analysis and trading insights!

EURCAD: Expecting Bearish Continuation! Here is Why
Balance of buyers and sellers on the EURCAD pair, that is best felt when all the timeframes are analyzed properly is shifting in favor of the sellers, therefore is it only natural that we go short on the pair.
Disclosure: I am part of Trade Nation's Influencer program and receive a monthly fee for using their TradingView charts in my analysis.
❤️ Please, support our work with like & comment! ❤️

GBPUSD (2H - long)GBPUSD (2H - FXCM) chart analysis with Ichimoku Theories. The price has recently broken above the trendline, signaling the start of a new upward trend. On the Ichimoku cloud, the price has moved above the cloud, indicating a bullish shift, with the Tenkan-sen crossing above the Kijun-sen, reinforcing the bullish momentum. Traders should watch for potential resistance levels and monitor the cloud thickness for confirmation of strength. Stay cautious of any pullbacks as the market establishes this new trend!
if you like hint it

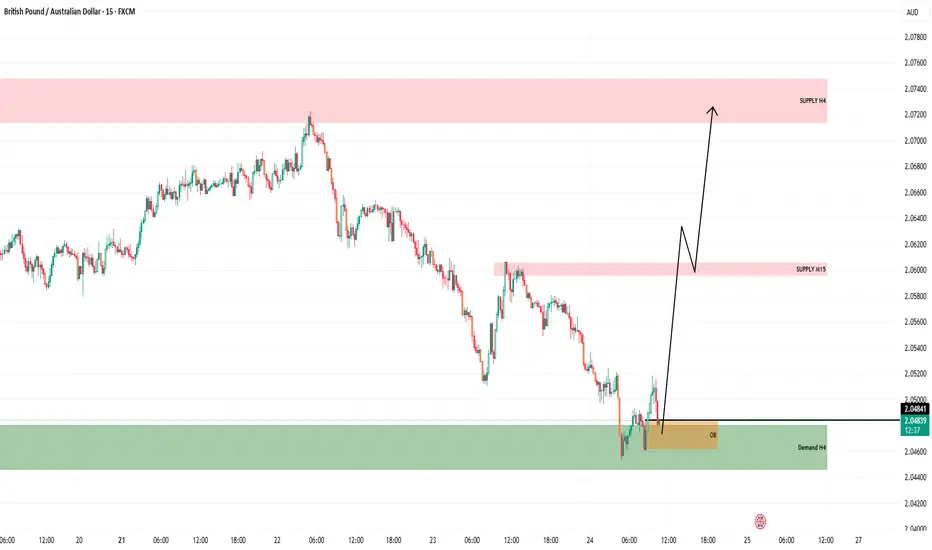
GBPAUD BUY OPPORTUNITY📈 Expected Price Action:
Initial Reaction from Demand H4 & OB:
Bullish rejection confirms buyers stepping in.
Short-Term Target - Supply M15 (Red Zone):
Around 2.0600 – Expect price to react or consolidate here temporarily.
Final Target - Supply H4 Zone:
Around 2.0720–2.0740, where higher-timeframe sellers may step in.
✅ Summary of Bias:
Directional Bias: Bullish
Entry Area: Between OB and Demand H4 zone (2.0450–2.0480)
First Target: 2.0600 (M15 supply)
Final Target: 2.0720+ (H4 supply)
🧠 Notes:
Ensure you monitor price action around the M15 supply for partial profits or re-entry.
A break below the OB and H4 Demand would invalidate the setup.
USDJPY range-bound trade- Trade is based on potential breakout on either side as range bound markets are there to be broken

EURJPY - Short Idea - 24th July 2025- Stopped making news HHs
- Suspected Double Top pattern found
- Likely to go bearish
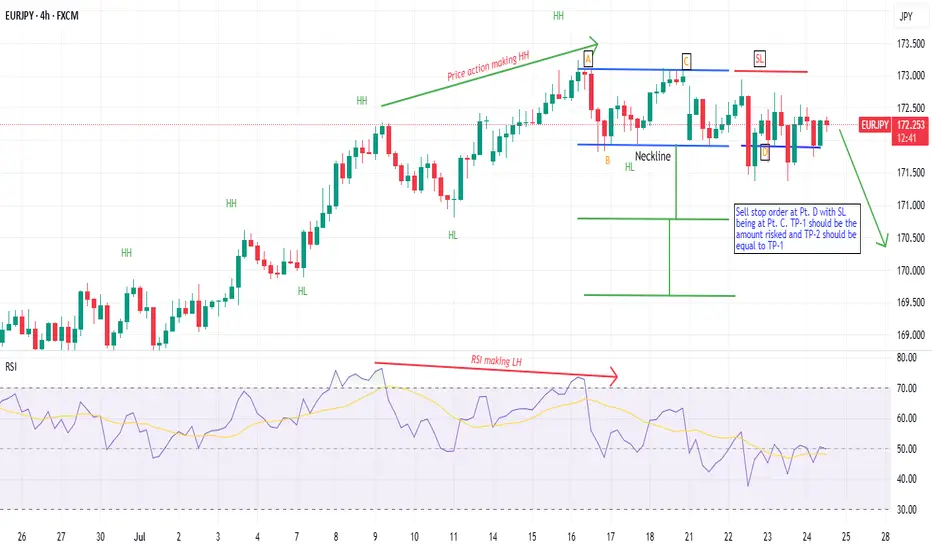
Short or Long-Market is at has broken resistance level but has not tested.
-Market may be rejected by resistance to form a double top (M shape)
-If 14:15 interest rates news are positive on the Euro, we will have to take a long position, to which it may come to retest the new support after some time, confirming the long position.
-If the markets for a double bottom, it means we have tested the resistance level at a second rejection. We would then have to short that position.

Sell euraudMonthly sell structure valid
Now daily support trend line breaks and candel close below the trend and market making lower low
Just wait to break the fresh lower high

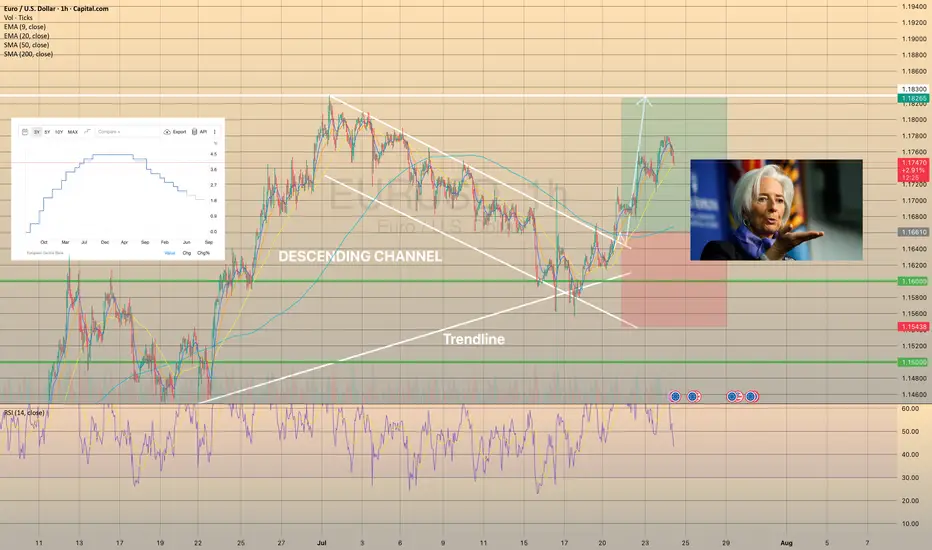
ECB Interest Rate Decision: What to Expect and How Could React📊 ECB Interest Rate Decision: What to Expect and How EURUSD Could React
This week’s spotlight is on the European Central Bank (ECB) Interest Rate Decision — a key market driver that could shape the near-term direction of the euro and broader European markets. Here's what to expect. 👇
🔔 Key Event to Watch
📅 ECB Interest Rate Decision
🕐 Date: July 24
⏰ Time: 12:15 p.m. UTC
📉 Forecast: Hold at 2.15%
📌 Economic Context
The European Central Bank is expected to hold interest rates steady on Thursday, likely marking the end of its current easing cycle after eight consecutive cuts that brought borrowing costs to their lowest levels since November 2022.
🔒 Main refinancing rate: 2.15%
💰 Deposit facility rate: 2.00%
Policymakers are likely to adopt a wait-and-see approach as they monitor the impact of persistent trade uncertaintyand potential U.S. tariffs on economic growth and inflation.
Adding to the cautious stance, inflation finally reached the ECB’s 2% target in June, and is now forecast to dip belowthat level later this year. This drop is expected to be sustained over the next 18 months, driven by:
A strong euro 💶
Falling energy prices 🛢️
Cheaper imports from China 🇨🇳
Markets are currently pricing in just one more rate cut by December, with around a 50% probability of that happening in September, before a possible tightening cycle resumes in late 2026.
📈 EURUSD Technical Outlook
EURUSD has been trading within a descending channel since early July. However, it recently rebounded from trendline support, backed by bullish RSI divergence. The pair is approaching a breakout above the 1-hour SMA200, signaling a potential continuation of the uptrend. 🔼
A minor pullback is possible before a stronger move
Bullish momentum may continue if resistance is cleared
🎯 Target range: 1.18250 – 1.18300
🧩 Summary
The ECB is likely to keep rates unchanged at 2.15%, adopting a cautious tone amid easing inflation and global trade risks. This outcome could support the euro, particularly if U.S. rate expectations soften.
With technical indicators aligning with fundamental stability, EURUSD may be setting up for a bullish continuationin the coming sessions. 📊💶