Forex market
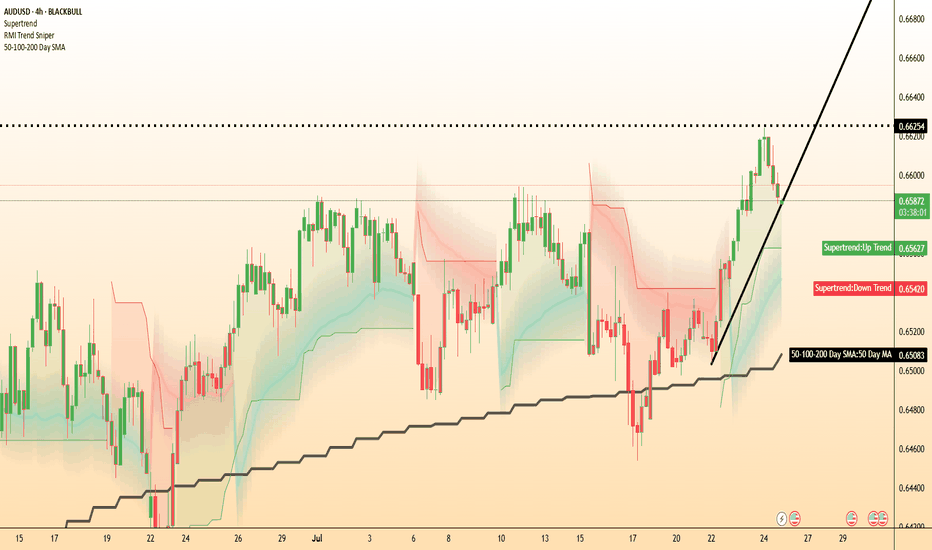
AUD/USD tests uptrend as Trump targets Powell at Fed siteThe US dollar is trading mixed after President Trump made a rare appearance at the Federal Reserve’s renovation site, in an attempt to distract from you know what.
While the visit had no formal policy announcements, Trump did try to further undermine Chair Jerome Powell by erroneously claiming the renovation cost had blown out to 3.1 billion by adding the cost of a building finished 5 years ago.
Meanwhile, AUD/USD could be of the most interest. Traders might like to watch to see if it can hold its uptrend after its downside breakout from yesterday. AUD/USD remains potentially supported above its 50-DMA, with momentum pointing to potential further upside beyond 0.6625.
Trading Divergences With Wedges in ForexTrading Divergences With Wedges in Forex
Divergence trading in forex is a powerful technique for analysing market movements, as is observing rising and falling wedges. This article explores the synergy between divergence trading and wedges in forex, offering insights into how traders can leverage these signals. From the basics to advanced strategies, learn how you could utilise this approach effectively, potentially enhancing your trading skills in the dynamic forex market.
Understanding Divergences
In forex trading, the concept of divergence plays a pivotal role in identifying potential market shifts. A divergence in forex, meaning a situation where price action and a technical indicator like the Relative Strength Index (RSI) or Moving Average Convergence Divergence (MACD) move in opposite directions, often signals a weakening trend. This discrepancy is a valuable tool in divergence chart trading, as it may indicate a possible reversal or continuation of the current trend.
There are two primary types of divergence in forex—regular and hidden. Regular divergence occurs when the price makes higher highs or lower lows while the indicator does the opposite, often signalling a reversal. Hidden divergence, on the other hand, happens when the price makes lower highs or higher lows while the indicator shows higher highs or lower lows, typically suggesting a continuation of the current trend.
Trading Rising and Falling Wedges
Rising and falling wedges are significant patterns in forex trading, often signalling potential trend reversals. A rising wedge, formed by converging upward trendlines, often indicates a bearish reversal if it appears in an uptrend. Conversely, a falling wedge, characterised by converging downward trendlines, typically reflects a bullish reversal if it occurs in a downtrend.
Traders often look for a breakout from these patterns as a signal to enter trades. For rising wedges, a downward breakout can be seen as a sell signal, while an upward breakout from a falling wedge is often interpreted as a buy signal. When combined with divergences, this chart pattern can add confirmation and precede strong movements.
Best Practices for Trading Divergences
Trading divergence patterns in forex requires a keen eye for detail and a disciplined, holistic approach. Here are key practices for effective trading:
- Comprehensive Analysis: Before trading on divergence and wedges, be sure to analyse overall market conditions.
- Selecting the Right Indicator: Choose a forex divergence indicator that suits your trading style. Common choices include RSI, MACD, and Stochastic.
- Confirmation Is Key: It’s best to watch for additional confirmation from price action or other technical tools before entering a trade.
- Risk Management: Traders always set stop-loss orders to manage risk effectively. Divergence trading isn't foolproof; protecting your capital is crucial.
- Patience in Entry and Exit: Be patient as the divergence develops and confirm with your chosen indicators before entering or exiting a trade.
Strategy 1: RSI and Wedge Divergence
Traders focus on regular divergence patterns when the RSI is above 70 (overbought) or below 30 (oversold), combined with a rising or falling wedge pattern. The strategy hinges on identifying highs or lows within these RSI extremes. It's not crucial if the RSI remains consistently overbought or oversold, or if it fluctuates in and out of these zones.
Entry
- Traders may observe a regular divergence where both the price highs/lows and RSI readings are above 70 or below 30.
- After the formation of a lower high (in an overbought zone) or a higher low (in an oversold zone) in the RSI, traders typically watch as the RSI crosses back below 70 or above 30. This is accompanied by a breakout from a rising or falling wedge, acting as a potential signal to enter.
Stop Loss
- Stop losses might be set just beyond the high or low of the wedge.
Take Profit
- Profit targets may be established at suitable support/resistance levels.
- Another potential approach is to exit when the RSI crosses back into the opposite overbought/oversold territory.
Strategy 2: MACD and Wedge Divergence
Regarded as one of the best divergence trading strategies, MACD divergence focuses on the discrepancy between price action and the MACD histogram. The strategy is particularly potent when combined with a rising or falling wedge pattern in price.
Entry
- Traders typically observe for the MACD histogram to diverge from the price. This divergence manifests as the price reaching new highs or lows while the MACD histogram fails to do the same.
- The strategy involves waiting for the MACD signal line to cross over the MACD line in the direction of the anticipated reversal. This crossover should coincide with a breakout from the rising or falling wedge.
- After these conditions are met, traders may consider entering a trade in anticipation of a trend reversal.
Stop Loss
- Stop losses may be set beyond the high or low of the wedge, which may help traders manage risk by identifying a clear exit point if the anticipated reversal does not materialise.
Take Profit
- Profit targets might be established at nearby support or resistance levels, allowing traders to capitalise on the expected move while managing potential downside.
Strategy 3: Stochastic and Wedge Divergence
Stochastic divergence is a key technique for divergence day trading in forex, especially useful for identifying potential trend reversals. This strategy typically employs the Stochastic Oscillator with settings of 14, 3, 3.
Entry
- Traders may look for divergence scenarios where the Stochastic readings are above 80 or below 20, mirroring the RSI approach.
- This divergence is observed in conjunction with price action, forming a rising or falling wedge.
- Entry may be considered following a breakout from the wedge, which signals a potential shift in market direction.
Stop Loss
- Setting stop losses just beyond the high or low of the wedge might be an effective approach.
Take Profit
- Profit targets may be set at key support/resistance levels.
The Bottom Line
Divergence trading, coupled with the analysis of rising and falling wedges, offers a comprehensive approach to navigating the forex market. By integrating the discussed strategies with sound risk management and market analysis, traders may potentially enhance their ability to make informed decisions in the dynamic world of forex.
This article represents the opinion of the Companies operating under the FXOpen brand only. It is not to be construed as an offer, solicitation, or recommendation with respect to products and services provided by the Companies operating under the FXOpen brand, nor is it to be considered financial advice.
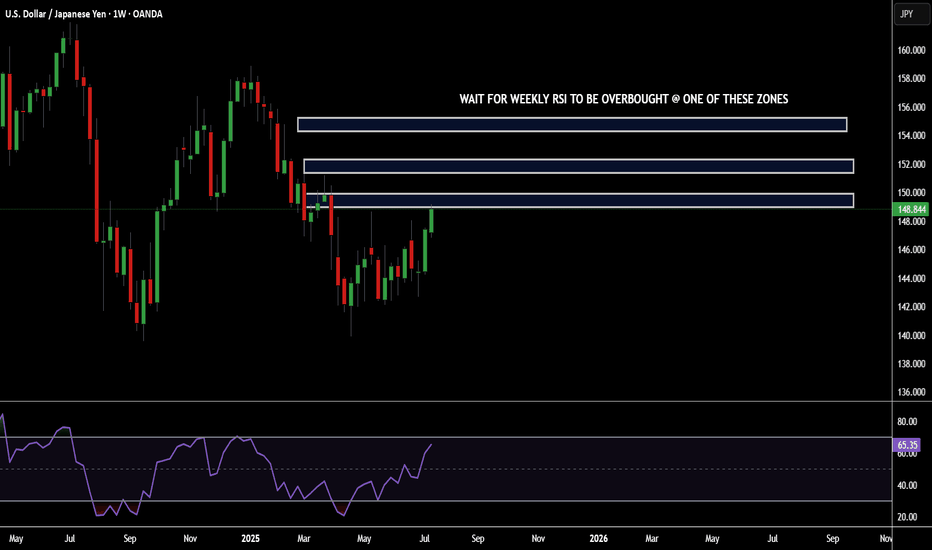
SIMPLEST SELL SETUP YOU'VE EVER SEEN...POTENTIAL USDJPY SHORTSHey hey Tradingview community!!! Hope you are all doing amazing! Just wanted to do a very detailed and complex breakdown for potential swing short opportunities I see for USDJPY...let's dive in!!
OK so first....lol
I'm kidding. Very simple. Look at the chart. Mark those zones to look for shorts. Swing trading opportunity...Love you all!!
Cheers!
OH...if you need the RSI settings it is the 7 period deviation. Cheers pt. 2!
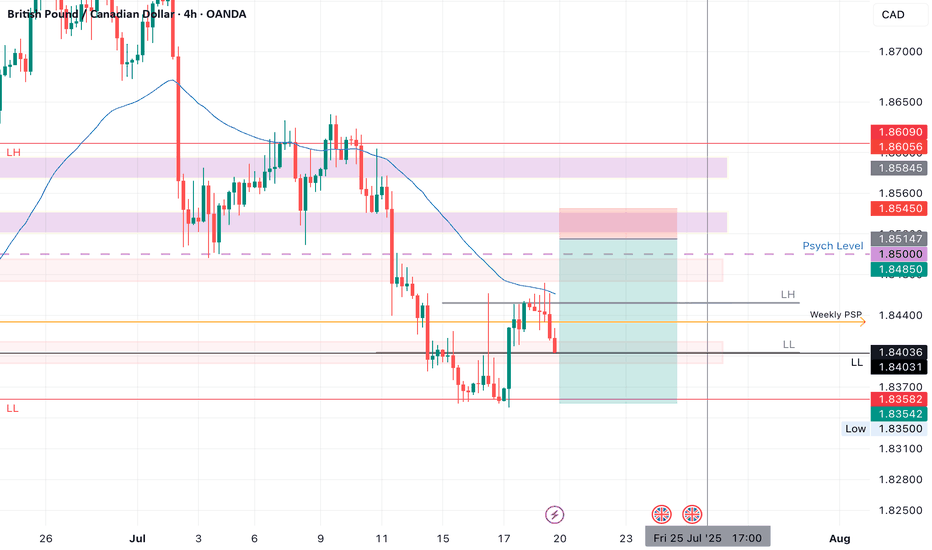
GBPCAD SHORTMarket structure bearish on HTFs DW
Entry at both Weekly and Daily AOi
Weekly Rejection at AOi
Previous Weekly Structure Point
Daily Rejection at AOi
Daily EMA retest
Around Psychological Level 1.85000
H4 Candlestick rejection
Levels 5.3
Entry 90%
REMEMBER : Trading is a Game Of Probability
: Manage Your Risk
: Be Patient
: Every Moment Is Unique
: Rinse, Wash, Repeat!
: Christ is King.
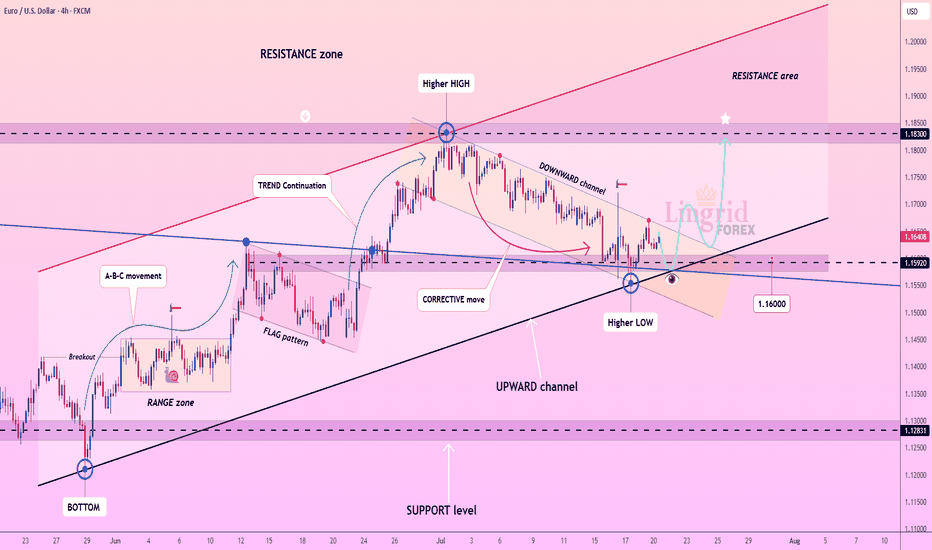
Lingrid | EURUSD Potential Surge Following Channel BreakoutFX:EURUSD is consolidating after bouncing from a key confluence of support around 1.16000 and forming a higher low within the upward channel. The recent corrective pullback through a downward channel now appears complete, with bullish structure resuming. Price is likely to advance toward the 1.18300 resistance as long as the 1.15900 zone holds. Momentum favors a continuation of the A-B-C and trend continuation sequences already established.
📉 Key Levels
Buy trigger: Break above 1.16500
Buy zone: 1.16000–1.16250
Target: 1.18300
Invalidation: Close below 1.14500
💡 Risks
Failure to break the corrective channel resistance
Bearish divergence on lower timeframes
Broader USD strength reversal
If this idea resonates with you or you have your own opinion, traders, hit the comments. I’m excited to read your thoughts!
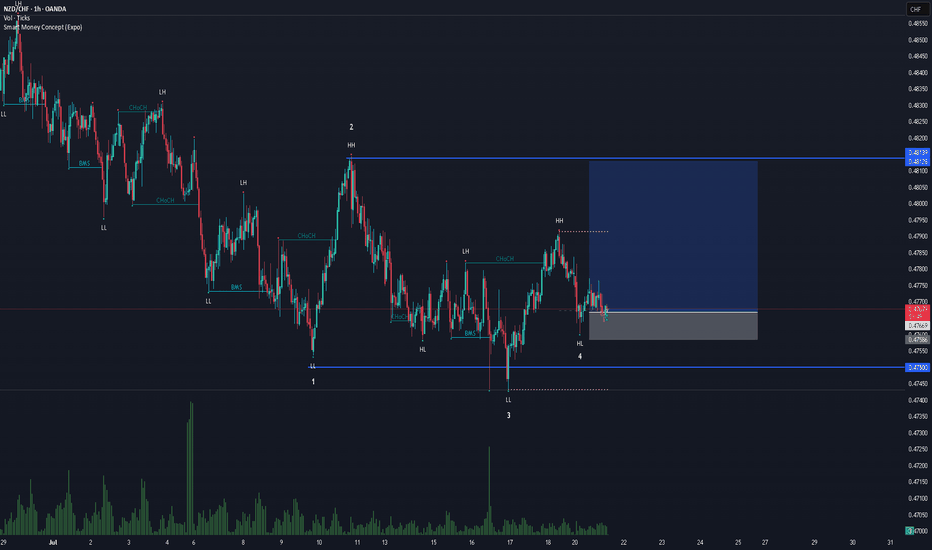
NZDCHF BUYSPrice was in a long downtrend, but sellers eventually lost strength. After a sharp selloff, the market began moving sideways — showing signs that larger players were quietly building positions while keeping price in a range.
Price then dipped below the range and quickly reversed, followed by strong buying that broke previous highs and shifted the overall structure from bearish to bullish. If that same buying pressure returns, we could see a continuation of the upward move as momentum builds.
Entry: 0.47629
Take Profit: 0.48139
Stop Loss: 0.47490
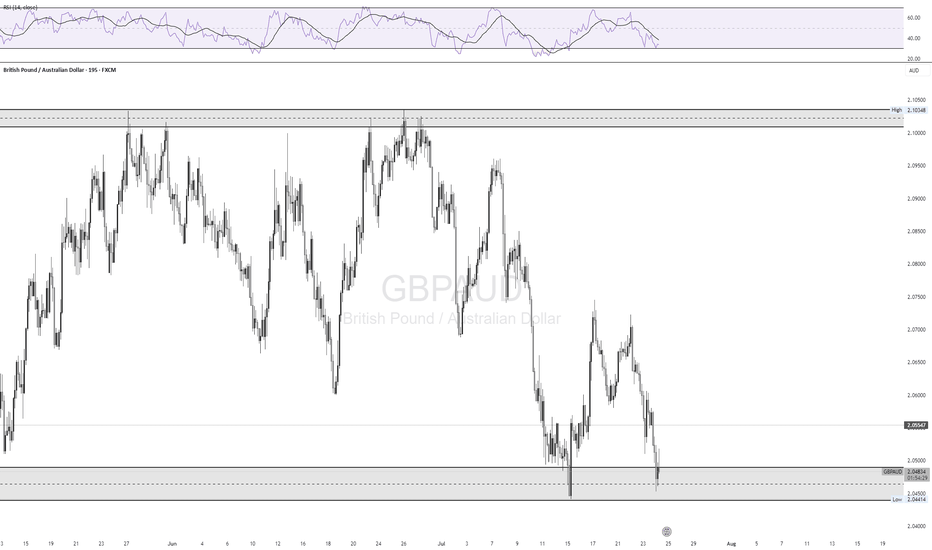
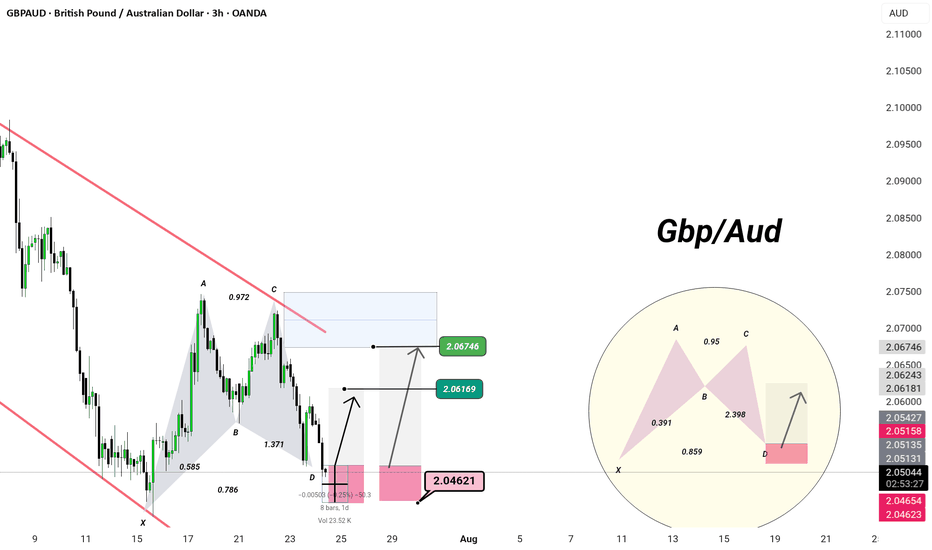
IGBPAUD | 3H Chart | Precision Setup –
🦋 Bullish Harmonic Activation – Deep Zone Precision
When elegance meets geometry — we trade like a Monaco man.
🔺 Pattern: Potential Bullish Bat/Alt Bat
XA → AB → BC → CD
Ideal D-point completion at 2.0462
88.6% XA retracement + 2.0+ BC extension = high-probability reaction zone
🛡️ Demand Zone:
Price is testing the PRZ (Potential Reversal Zone) at 2.0462
Reaction expected → projected targets:
🎯 TP1: 2.0616
🎯 TP2: 2.0674
⚙️ Entry Plan:
Long from 2.0462–2.0465
Invalidation below structure low
Maintain composure. Let the setup mature — precision > prediction
💡 Bias: Tactical long within channel, targeting liquidity above C
🎩
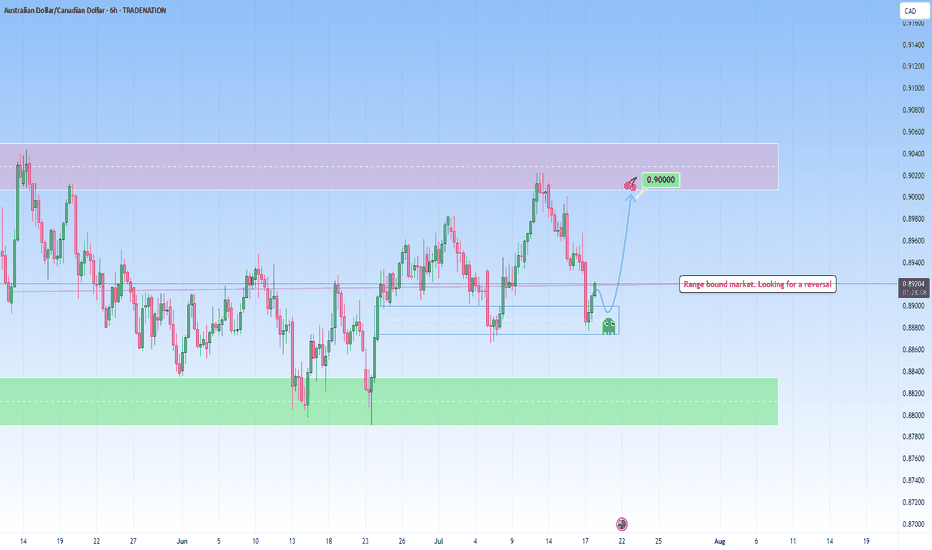
AUDCAD: Respecting Structure, Repeating OpportunityWhat we’re looking at here is a beautifully balanced range market, the kind I love trading, because it speaks so clearly when you take a moment to listen. Price is respecting both sides of this range clearly. The lows are being protected and respected multiple times before.
We’ve already tapped into that lower bound, and the reaction has been good, together with liquidity collecting. And when price finds its feet in these kinds of zones, I immediately think of what the range is offering, right now, with risk clearly defined and reward just sitting at the other edge, waiting.
If price gives us one more small retest, I’m watching for confirmation: not just in candlestick structure, but also in volume behavior. I have my eyes set straight on that upper resistance zone near 0.90000.
And from there unless there’s a news catalyst or volume breakout, that’s where the move likely might exhaust… and that’s where I’m out, before the reversal can bite.
If the structure shifts, I’ll shift too. But until then, this is a perfect range.
Just sharing my thoughts for the charts, this isn’t financial advice. Always confirm your setups and manage your risk properly.
Disclosure: I am part of Trade Nation's Influencer program and receive a monthly fee for using their TradingView charts in my analysis.
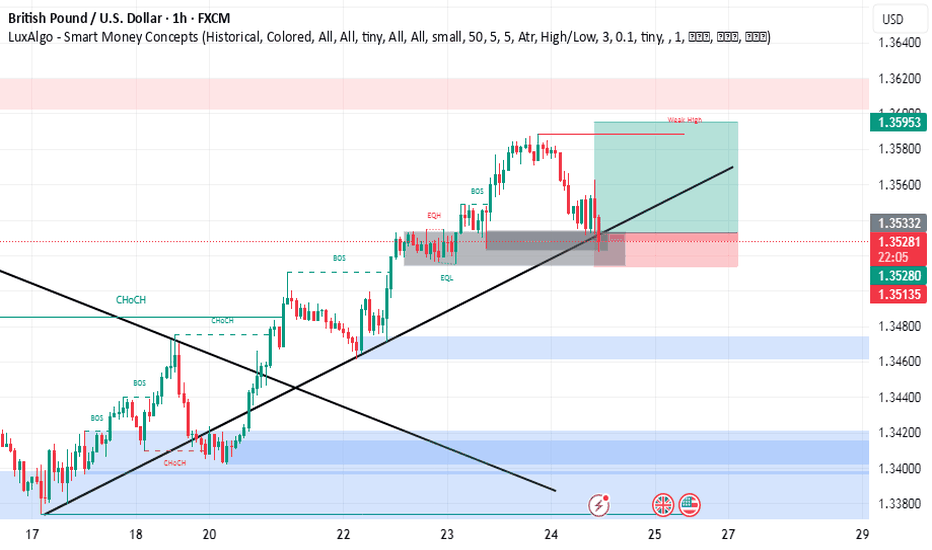
GBPUSD short-dominated rhythm has been confirmed by most shortLong-short strength comparison model, the long side of the current foreign exchange market continues to weaken, and the short-dominated rhythm has been confirmed by most short- and medium-term accounts. Signals tracked by the model show that the share of short trading volume has increased for several consecutive trading days and started to affect the short-term trend rhythm.
In the public opinion analysis, "beginning of adjustment", "direction reversal" and "downside space" have become the buzzwords. These semantic features and concluded that the market has gradually shifted from neutral to systematic bearish expectations. to systematic bearishness.
At the same time, the system identified some related assets (e.g. commodities, carry assets) prices synchronized downward, providing cross-asset support for shorts. Sentiment is expected to continue to be bearish in the short term, and any rebound could be an opportunity for shorts to re-enter the market.
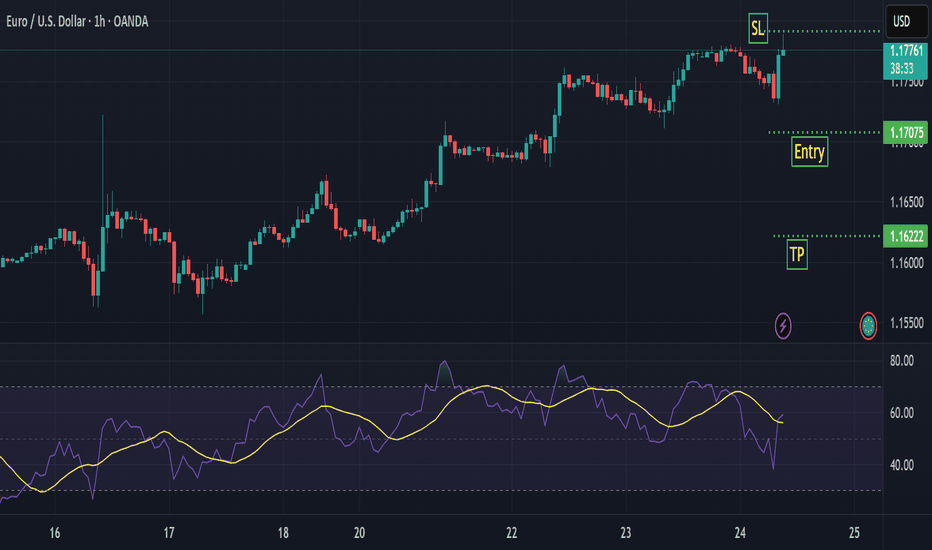
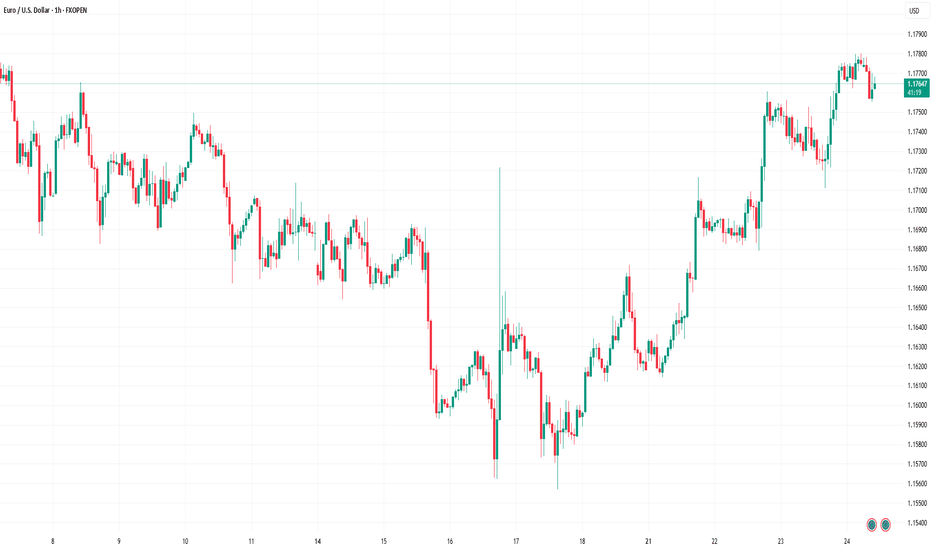
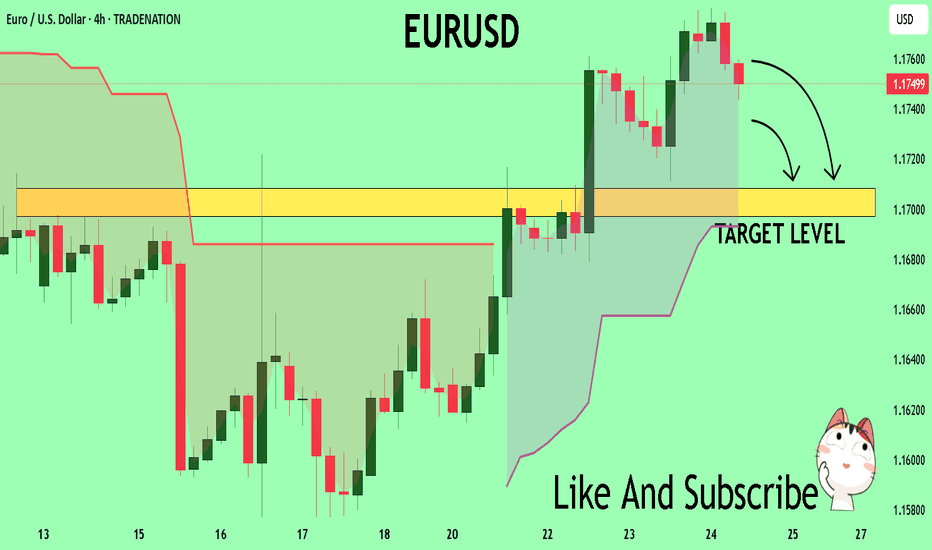
EURUSD A Fall Expected! SELL!
My dear friends,
Please, find my technical outlook for EURUSD below:
The instrument tests an important psychological level 1.1751
Bias - Bearish
Technical Indicators: Supper Trend gives a precise Bearish signal, while Pivot Point HL predicts price changes and potential reversals in the market.
Target - 1.1708
About Used Indicators:
Super-trend indicator is more useful in trending markets where there are clear uptrends and downtrends in price.
Disclosure: I am part of Trade Nation's Influencer program and receive a monthly fee for using their TradingView charts in my analysis.
———————————
WISH YOU ALL LUCK
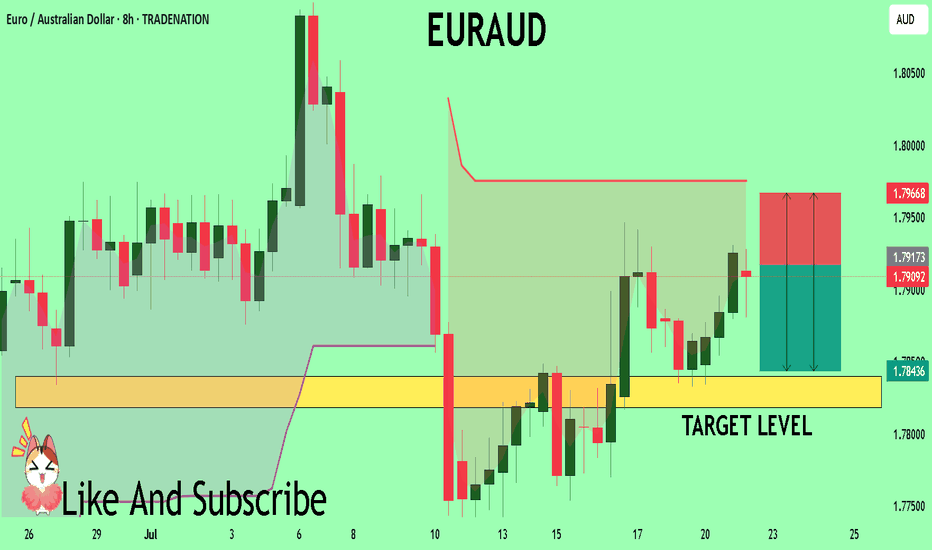
EURAUD Set To Fall! SELL!
My dear followers,
I analysed this chart on EURAUD and concluded the following:
The market is trading on 1.7917 pivot level.
Bias - Bearish
Technical Indicators: Both Super Trend & Pivot HL indicate a highly probable Bearish continuation.
Target - 1.7840
Safe Stop Loss - 1.7966
About Used Indicators:
A super-trend indicator is plotted on either above or below the closing price to signal a buy or sell. The indicator changes color, based on whether or not you should be buying. If the super-trend indicator moves below the closing price, the indicator turns green, and it signals an entry point or points to buy.
Disclosure: I am part of Trade Nation's Influencer program and receive a monthly fee for using their TradingView charts in my analysis.
———————————
WISH YOU ALL LUCK
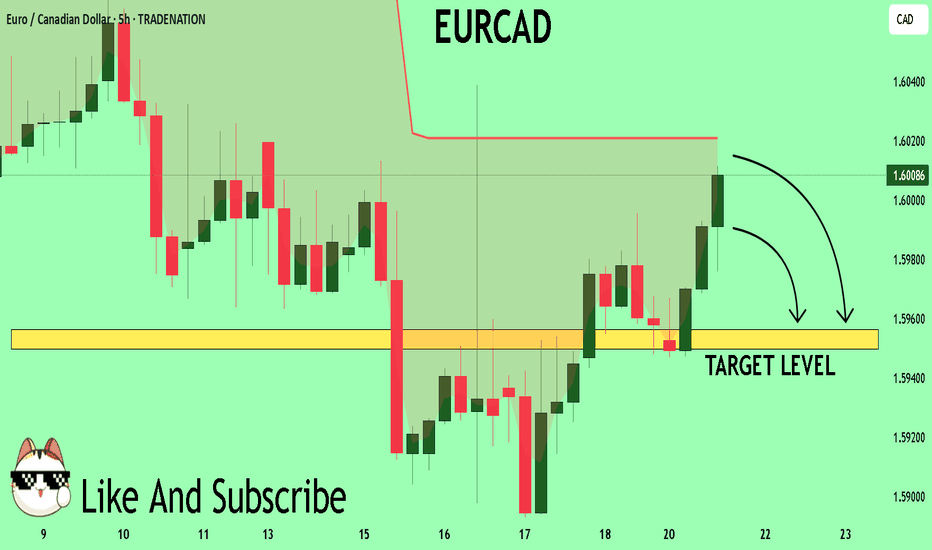
EURCAD Buyers In Panic! SELL!
My dear friends,
My technical analysis for EURCAD is below:
The market is trading on 1.6005 pivot level.
Bias - Bearish
Technical Indicators: Both Super Trend & Pivot HL indicate a highly probable Bearish continuation.
Target - 1.5956
About Used Indicators:
A pivot point is a technical analysis indicator, or calculations, used to determine the overall trend of the market over different time frames.
Disclosure: I am part of Trade Nation's Influencer program and receive a monthly fee for using their TradingView charts in my analysis.
———————————
WISH YOU ALL LUCK
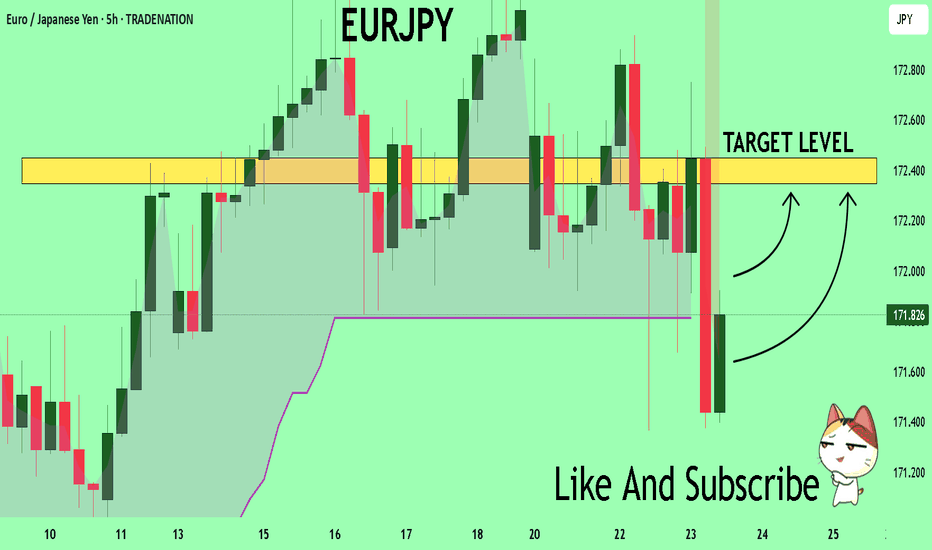
EURJPY Will Explode! BUY!
My dear subscribers,
My technical analysis for EURJPY is below:
The price is coiling around a solid key level - 171.82
Bias - Bullish
Technical Indicators: Pivot Points Low anticipates a potential price reversal.
Super trend shows a clear buy, giving a perfect indicators' convergence.
Goal - 172.34
About Used Indicators:
By the very nature of the supertrend indicator, it offers firm support and resistance levels for traders to enter and exit trades. Additionally, it also provides signals for setting stop losses
Disclosure: I am part of Trade Nation's Influencer program and receive a monthly fee for using their TradingView charts in my analysis.
———————————
WISH YOU ALL LUCK
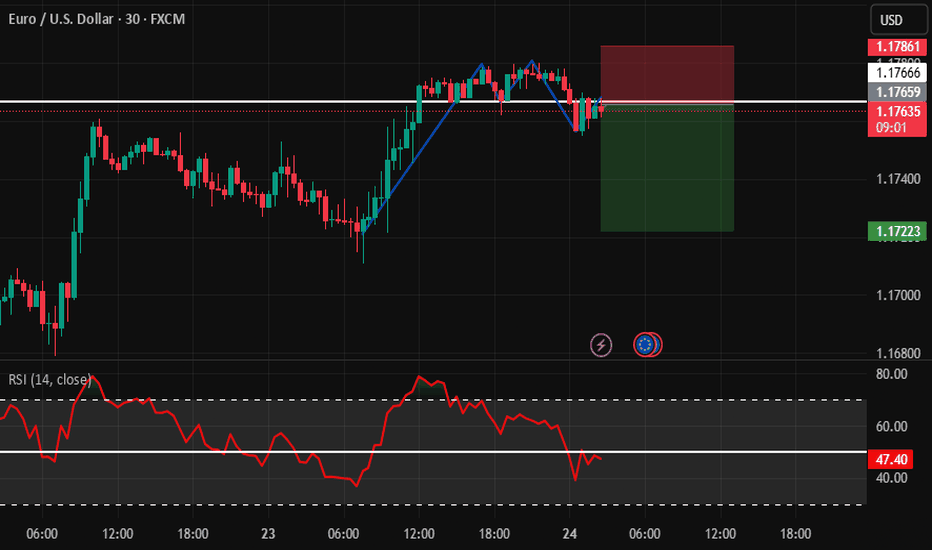
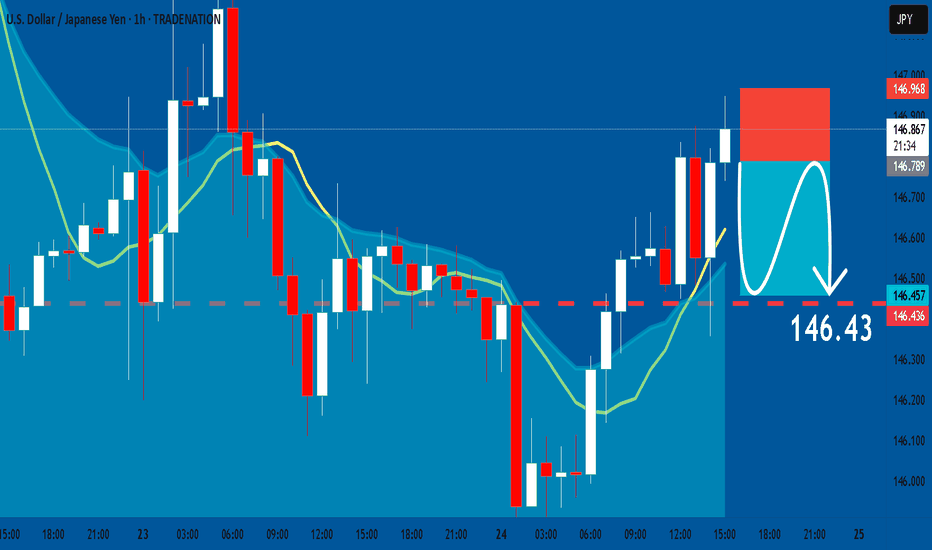
USDJPY: Short Trading Opportunity
USDJPY
- Classic bearish pattern
- Our team expects retracement
SUGGESTED TRADE:
Swing Trade
Sell USDJPY
Entry - 146.78
Stop - 146.96
Take - 146.43
Our Risk - 1%
Start protection of your profits from lower levels
Disclosure: I am part of Trade Nation's Influencer program and receive a monthly fee for using their TradingView charts in my analysis.
❤️ Please, support our work with like & comment! ❤️
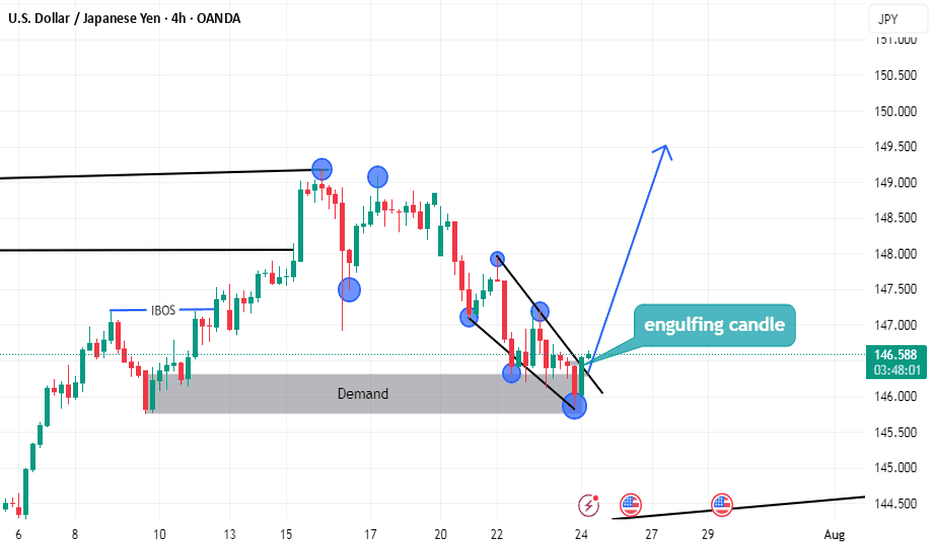
USDJPY BUY TRADE PLAN🔥 USDJPY TRADE PLAN 🔥
📅 Date: July 24, 2025
📋 Trade Plan Overview:
Plan ID Type Direction Confidence R:R Status
USDJPY2407-ID Intra-Day Buy ⭐⭐⭐⭐ 80% 3.6:1 ✅ Active (Confirmed)
Guidance:
Prioritize this Buy Plan as price is reacting to a clean H4 demand + engulfing candle + fundamental JPY weakness. Total risk: 0.75–1%.
🆔 Primary Trade Plan: Intra-Day BUY
📈 Market Bias & Trade Type
Bias: Bullish
Trade Type: Continuation after correction into H4 OB
🔰 Confidence Level
Confidence: ⭐⭐⭐⭐ (80%)
Breakdown:
🔹 H4 Bullish OB + Engulfing: 35%
🔹 JPY macro weakness + yield spread divergence: 20%
🔹 Volume buildup on LTF demand zone: 15%
🔹 Retail crowd short-biased: 10%
🔹 Sentiment score: +7.5/10
📌 Status
✅ Active – Entry Confirmed (H4 Engulfing)
📍 Entry Zones
🟩 Primary Buy Zone:
145.85 – 146.15 (H4 Demand + Previous LTF BOS Retest)
Current Price: 146.60 (slightly above, ideal retest already occurred OR wait for another re-test of 146.30-50 zone)
❗ Stop Loss
📍 SL: 144.85
(Just below secondary zone & structural wick buffer, 60–70 pips risk)
🎯 Take Profit Targets
🎯 Target Level R:R Notes
🥇 TP1 147.35 ~1.0:1 H1 Supply imbalance
🥈 TP2 148.05 ~2.1:1 H4 Resistance/Orderblock
🥉 TP3 148.60 ~3.6:1 D1 Wick High – swing extension
🧠 Management Strategy
Risk: 0.75–1% of $
Lots: Adjust for ~60–70 pips SL
Breakeven: Move SL to BE after TP1
Partials:
40% TP1
40% TP2
20% trail to TP3
Exit Early If: DXY rallies aggressively or USDJPY H1 prints reversal signal
⚠️ Confirmation Checklist
✅ H4 Bullish Engulfing Candle (Confirmed)
🔄 Tick chart volume cluster support
✅ Entry during London → NY overlap
❌ No high-impact red USD/JPY news in next 2 hours
💡 Look for additional M30 continuation on pullback
⏳ Validity
Plan valid: 24–36 hours
Expires: End of July 25 (or H4 break below 144.85)
Confirmed as active on H4
❌ Invalidation
Full H4 body close below 144.85
Sharp sell-off on high DXY momentum
Reversal signal + divergence on H1 near 147.30–148.00
🌐 Fundamental & Sentiment Snapshot
COT: Net Long USD, Net Short JPY widening
Yield Spread: Favors USD; JPY yields still compressed
Retail: 71% short USDJPY → Contrarian Buy
DXY: Soft intraday after CPI pullback
Macro Events: BOJ dovish stance remains, no USD red news today
Sentiment Score: +7.5/10
Historical: 76% win rate on this structure with engulfing confirmation
📋 Final Trade Summary
USDJPY offers a high-probability continuation long off a clean H4 demand block that was retested with engulfing confirmation. Momentum and bias align bullishly, retail is counter-trend, and volume supports continuation. This setup provides a favorable R:R with clear invalidation and 3 well-defined profit targets. Excellent structure for intra-day to swing capture.
