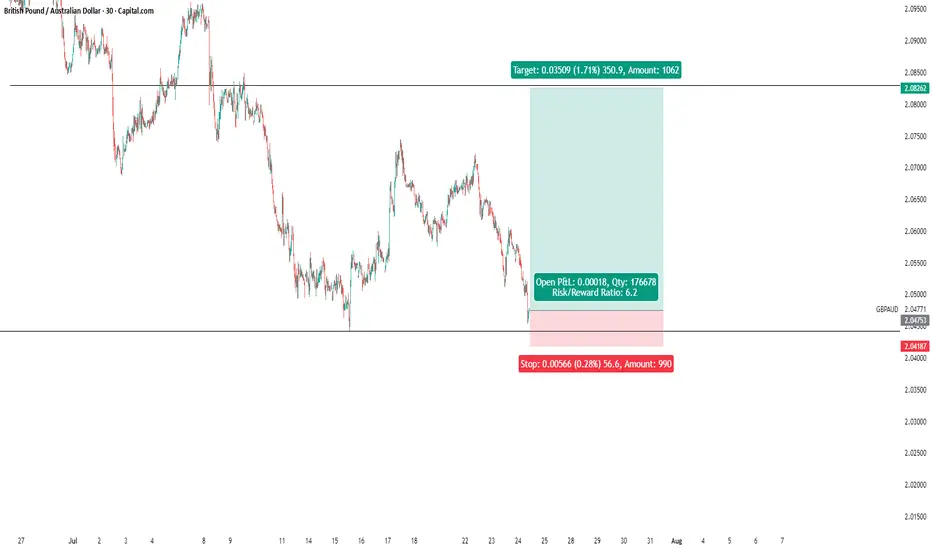
GBPAUD BUY SIGNAL. Don't forget about stop-loss.
Write in the comments all your questions and instruments analysis of which you want to see.
Friends, push the like button, write a comment, and share with your mates - that would be the best THANK YOU.
P.S. I personally will open entry if the price will show it according to my strategy.
Always make your analysis before a trade
Forex market
EURAUD SELL EURAUD SELL
🕒 4H Chart | FXCM Feed
Price has broken out of the ascending channel and is now rejecting a key supply zone with a clean break and retest. We anticipate continued bearish movement.
🔹 Sell Entry: 1.77675
🔹 Stop Loss: 1.78500 (−82.5 pips)
🔹 Take Profit 1: 1.76500 (+117.5 pips)
🔹 Take Profit 2: 1.75500 (+217.5 pips)
🔹 Take Profit 3: 1.74500 (+317.5 pips)
📊 Risk:Reward Ratios:
TP1 ≈ 1.42R
TP2 ≈ 2.63R
TP3 ≈ 3.85R
📎 Confluences:
✔️ Ascending channel break
✔️ Bearish retest of structure
✔️ Supply zone reaction
✔️ Clean downside space into demand zone
🔔 Partial profits at TP1 or SL to BE is advised. Let runners play if price flows cleanly.
📅 Signal Date: July 24, 2025
📢 @PulseTradesFX

USDCHF 23.07.25~+ Pressure on Powell, Waller is dovish
~+ Anticipation of the Trade deals deadline
+ Risk-on general sentiment after Japan trade deal
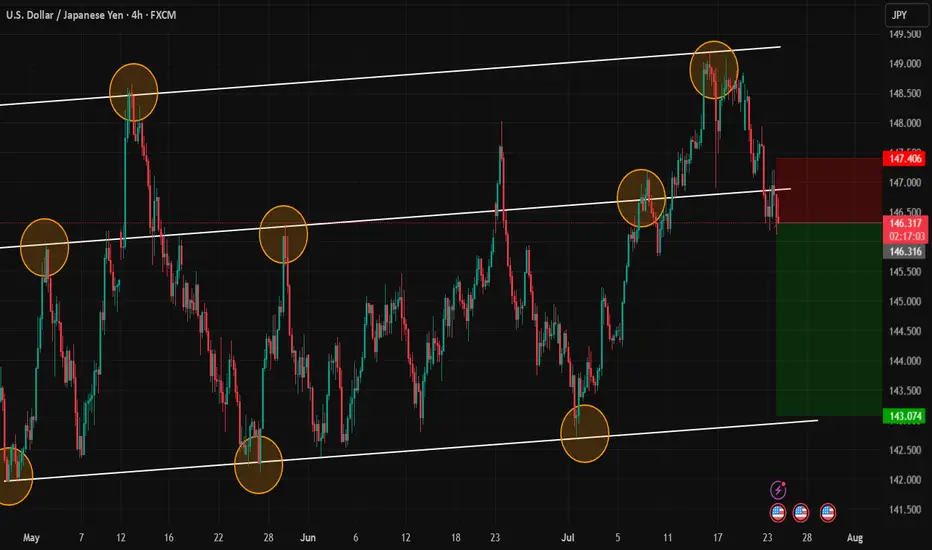
USDJPY LTF Triangle being formedUSDJPY is going down in all TF's
We want to see a SELL position.
On the 15M, we see a Triangle being formed.
If it breaks below, we want to enter into a SELL position.

AUDUSD Q3 | D24 | W30 | Y25📊AUDUSD Q3 | D24 | W30 | Y25
Daily Forecast🔍📅
Here’s a short diagnosis of the current chart setup 🧠📈
Higher time frame order blocks have been identified — these are our patient points of interest 🎯🧭.
It’s crucial to wait for a confirmed break of structure 🧱✅ before forming a directional bias.
This keeps us disciplined and aligned with what price action is truly telling us.
📈 Risk Management Protocols
🔑 Core principles:
Max 1% risk per trade
Only execute at pre-identified levels
Use alerts, not emotion
Stick to your RR plan — minimum 1:2
🧠 You’re not paid for how many trades you take, you’re paid for how well you manage risk.
🧠 Weekly FRGNT Insight
"Trade what the market gives, not what your ego wants."
Stay mechanical. Stay focused. Let the probabilities work.
FRGNT

AUDUSD Will Go Up From Support! Long!
Here is our detailed technical review for AUDUSD.
Time Frame: 4h
Current Trend: Bullish
Sentiment: Oversold (based on 7-period RSI)
Forecast: Bullish
The market is on a crucial zone of demand 0.661.
The oversold market condition in a combination with key structure gives us a relatively strong bullish signal with goal 0.665 level.
P.S
Please, note that an oversold/overbought condition can last for a long time, and therefore being oversold/overbought doesn't mean a price rally will come soon, or at all.
Disclosure: I am part of Trade Nation's Influencer program and receive a monthly fee for using their TradingView charts in my analysis.
Like and subscribe and comment my ideas if you enjoy them!

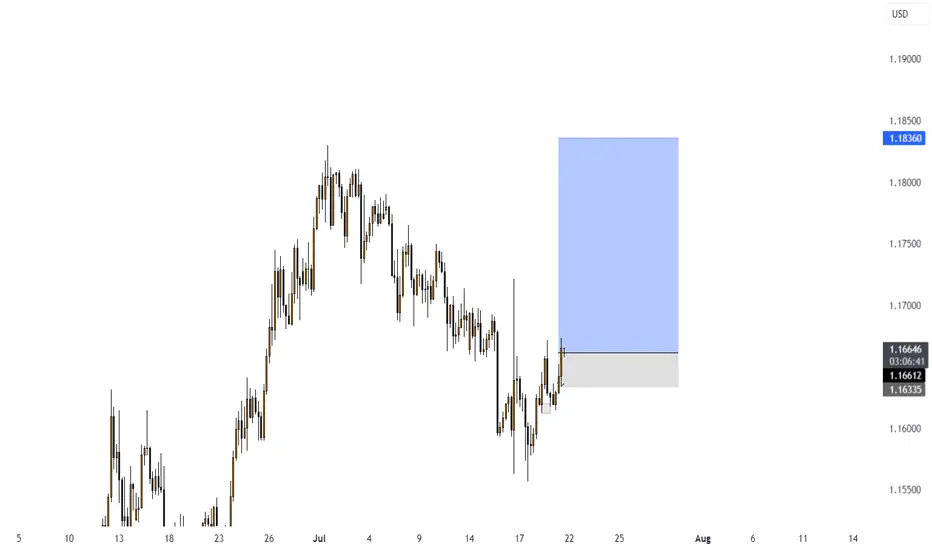
EURUSD – The Comeback is Real! After weeks trapped in a descending channel, EURUSD has broken out in style, launching into a clean bullish channel. Price is now carving a staircase of FVG zones, with momentum clearly favoring the bulls.
What’s fueling the fire?
Flash Manufacturing PMI from Europe beat forecasts
Eurozone consumer confidence improved
Markets pricing in dovish Fed as jobless claims dropped but inflation expectations stall
As long as price stays above 1.1750 and respects the ascending channel, the 1.1850 zone is well within reach.
Strategy: Buy the dips inside the bullish channel. FVGs act as stepping stones for further upside.

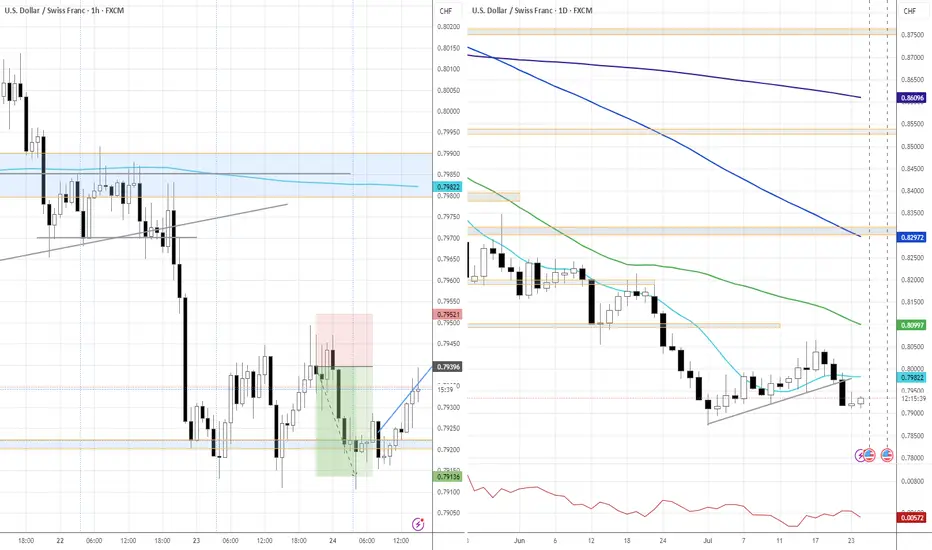
USDCHF – The Wind Still Blows South!USDCHF remains trapped below the descending trendline since June. Every bullish attempt has been sharply rejected – showing sellers are still in control.
Fresh U.S. data just released:
Jobless claims dropped → strong labor market → Fed likely to keep rates high → USD gains strength.
Manufacturing PMI beat expectations → resilient economy → more reason for a hawkish Fed.
But don’t forget: CHF is attracting safe-haven flows, adding downward pressure on USD!
If price fails to break above 0.7990 and gets rejected at the trendline, a drop toward 0.7890 is likely.
Strategy: Look to SELL around the trendline – follow the trend, not your emotions!


Possible scenario for EUR/USD based on Weekly-Daily-4h technicalPossible scenario for EUR/USD based on Weekly-Daily-4h technical and fundamental analyses.

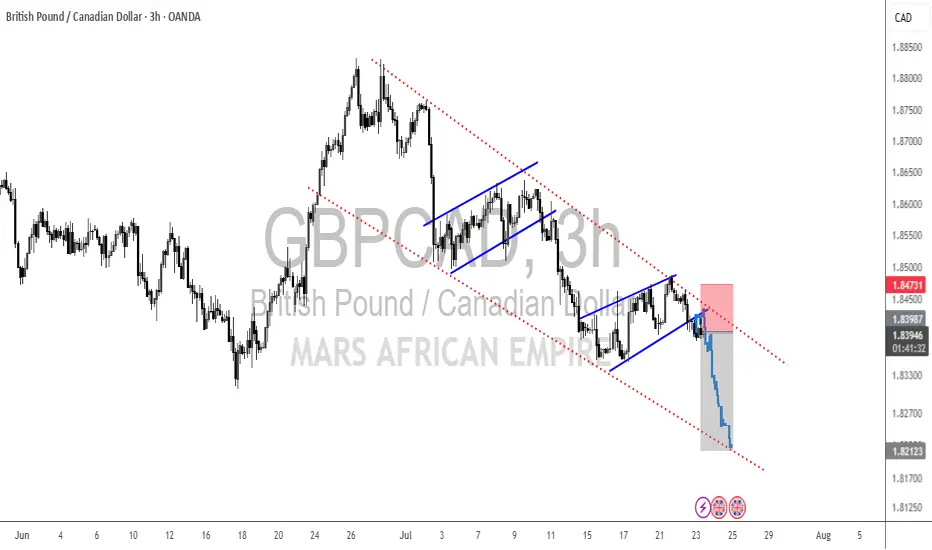
GBPCAD Moving UpAs per our previous analysis GBPCAD has taken off. We can expect a reversal to breakeven point, do not hesitate to add more positions.

EURUSD - market structure EURUSD - market structure , easy and clean chart, of course this is no analysis, use risk and trade managment
WOULD YOU TAKE THIS TRADE? GBPAUD SELLAll the information you need to find a high probability trade are in front of you on the charts so build your trading decisions on 'the facts' of the chart NOT what you think or what you want to happen or even what you heard will happen. If you have enough facts telling you to trade in a certain direction and therefore enough confluence to take a trade, then this is how you will gain consistency in you trading and build confidence. Check out my trade idea!!
www.tradingview.com

big energy the buy from demand was just too beautifuli told ya see how smoothly she sails the GBPUSD
i did a detailed explanation in my post earlier about this trade check it out and let me know what you think
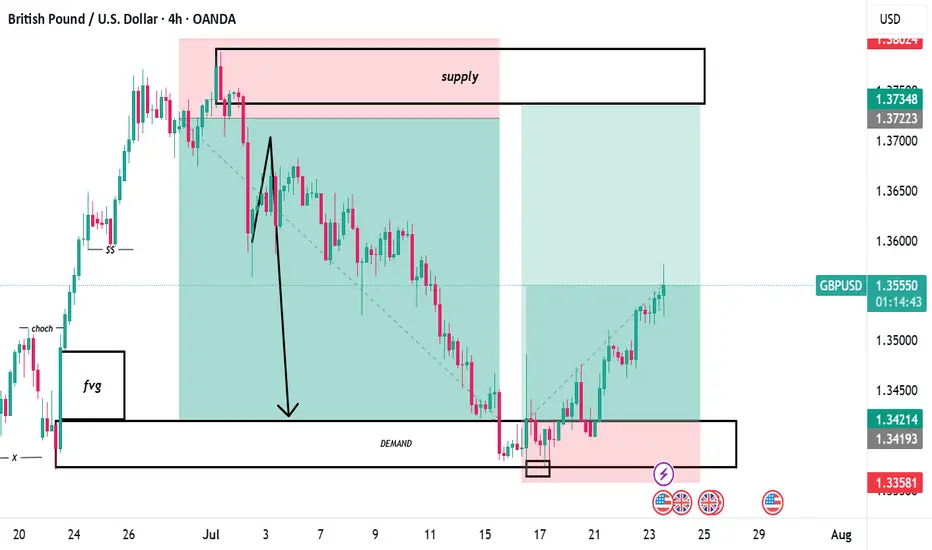
Demand to Supply MoveThis idea illustrates a potential bullish price movement from a recent demand zone toward a nearby supply zone based on structural price action and S/R dynamics.
Concept:
Price recently reacted from a clearly defined demand zone below, where strong buying pressure was previously observed.
The current structure shows a sequence of higher lows, signaling short-term bullish momentum.
Expectation:
Projecting a continuation of this bullish push toward the overhead supply zone, which also aligns with a broken support now acting as resistance.
The target area represents a liquidity zone where sellers are likely to re-enter, offering a potential reversal or reaction.
Reasoning:
Demand Zone Reaction: Price has already confirmed bullish intent with strong rejection wicks and momentum candles.
Clean Traffic to the Left: Limited resistance between current price and the target zone.
S/R Confluence: The target area corresponds to a previous consolidation and breakdown point, enhancing its validity as resistance.
AUDJPY BEARISHTechnically:
AUDJPY printed bearish divergence
AUDJPY broke LL
AUDJPY respecting bearish trendline
AUDJPY retrace which is new LH


EURNZD: Bulls Will Push Higher
Our strategy, polished by years of trial and error has helped us identify what seems to be a great trading opportunity and we are here to share it with you as the time is ripe for us to buy EURNZD.
Disclosure: I am part of Trade Nation's Influencer program and receive a monthly fee for using their TradingView charts in my analysis.
❤️ Please, support our work with like & comment! ❤️

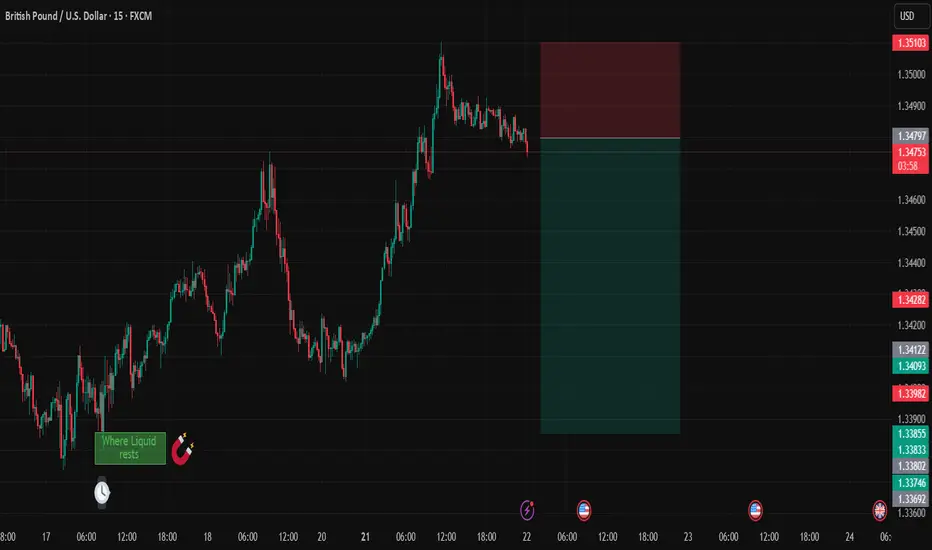
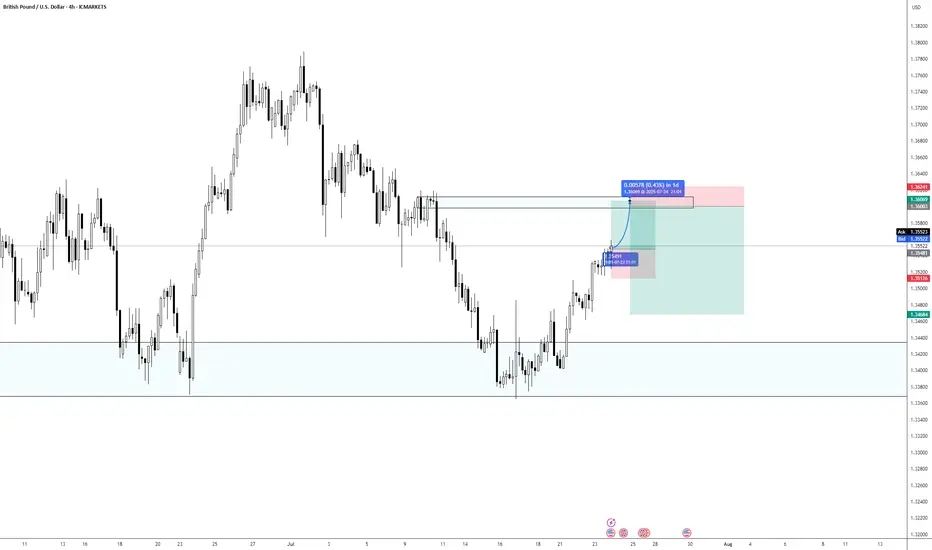
GBPUSDDate:
July 22,2025
Session:
Tokyo and London session
Pair:
GBPUSD
Bias:
Short
Price is setting up to target where liquid rests from last weeks London open on Thursday. Price action shows exhaustion after NYC and London liquidity grab.
Entry:1.34795
Stop Loss:1.35103
Target:1.33853
RR:3.08