GBP/USD BREAKOUT SIGNAL FOR BULLISH CONTINUATION?We were anticipating a breakout of range last week which we finally saw to the upside. The range lasted over a week and the breakout to the upside was a significant signal of bullish strength in price. We are clear on the fact that we are still in a bullish trend and the current correction in price is likely to prepare us for a bull run with no less than 200 pips in sight.
Let's observe patiently and let's see how price reacts so we can cash in on any potential move.
Forex market

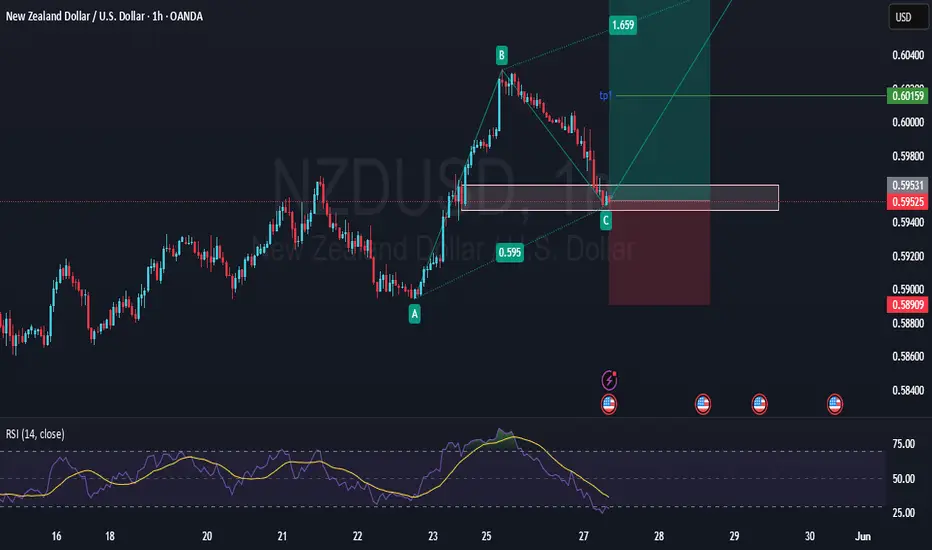
NZDUSD BULLISH H1NZDUSD BULLISH H1
Printing HH & HL
ab=cd pattern to be formed
current price at 0.61% fib level
good for buy
USD/MXN: The Mexican Peso Faces Strong NeutralityOver the last five trading sessions, USD/MXN fluctuations have shown a variation of barely 1%, indicating the emergence of sustained neutrality in the pair's recent moves. For now, the slight bearish bias in USD/MXN has managed to maintain a steady downward trend, as the Mexican peso benefits from short-term weakness in the U.S. dollar—as shown by the DXY index, which continues to trade below the 100-point mark, highlighting persistent weakness in the U.S. currency.
Potential Downtrend:
Since early April, bearish moves have begun to form a steady downtrend, bringing the price close to the 19 pesos per dollar level. So far, no significant bullish correction has reversed the current selling trend. However, it is important to note that the recent neutral tone could undermine the bearish bias of the past few months. If this neutrality continues, it could give way to a new phase of prolonged sideways trading in the short term.
MACD:
The MACD histogram has been hovering around the 0 line for several sessions, indicating that the moving averages are in a neutral zone, with no clear bullish or bearish dominance. If this pattern persists, the current neutrality could lead to a more defined consolidation range.
RSI:
The RSI line has started forming higher lows while USD/MXN prices have marked lower lows—resulting in a bullish divergence. This could signal room for potential upward corrections in the short term.
Key Levels to Watch:
19.24 pesos per dollar: A current barrier where price action has shown strong neutrality; it could serve as a starting point for potential short-term bullish corrections.
19.70 pesos per dollar: A critical resistance at the highest level the pair has reached in recent weeks. Sustained bullish movement near this zone could mark the end of the prevailing downtrend.
19.00 pesos per dollar: A significant psychological support. Continued bearish moves approaching this level could revive the forgotten bearish sentiment and strengthen the current downtrend line.
Written by Julian Pineda, CFA – Market Analyst

GBP/CHF Break & Retest – Bullish Continuation Setup (4H)Price has broken above a key structure level around 1.1155–1.1160, forming a higher high in line with the prevailing 4H uptrend. I’m watching for a clean retest of this zone with a rejection confirmation (preferably wick rejection or bullish engulfing) to take a long position.
Confluences:
• EMA 20/50 bullish alignment
• Break & retest of previous resistance turned support
• Bullish market structure (HHs, HLs)
Target: 1.13100
Invalidation: Break and close below the retest zone
Waiting for price to come to me — no early entries.

usdchf droppingThe monthly and the weeklt time frame a going to the downside , we saw a slight bullish move on the daily time frame but there is already a shift of trend .

Has the 'hawkish masterstroke' failed to deliver?The yen weakened after hitting a four - week high of 142.11 in early Asian trading, but then quickly reversed. It strongly broke through the 144.00 mark during European trading, with an intraday gain of 1.20% and is now quoted at 144. This trend is in sharp contrast to the hawkish remarks of Kazuo Ueda, the Governor of the Bank of Japan, highlighting that the market's expectation that the Ministry of Finance of Japan (MOF) may reduce long - term bond issuance is dominant. At the same time, the easing of US tariff rhetoric has helped the US Dollar Index (USDX) stabilize, and the rebound in risk appetite has further weakened the safe - haven demand for the yen. In the next three weeks, the trend of the US dollar against the yen will depend on two major events:
Confirmation of the MOF's bond - issuing plan in the middle and late June: If the supply of long - term bonds is clearly reduced, the yen may weaken further, with a target of 145.50. Conversely, if the status quo is maintained, short - covering may push the exchange rate back to test 142.00.
The Bank of Japan's policy meeting in June: Any signal of adjusting the bond - buying scale or raising interest rates ahead of schedule may trigger violent fluctuations, but a hawkish shift requires the support of stronger inflation data.
you are currently struggling with losses,or are unsure which of the numerous trading strategies to follow,You have the option to join our VIP program. I will assist you and provide you with accurate trading signals, enabling you to navigate the financial markets with greater confidence and potentially achieve optimal trading results.

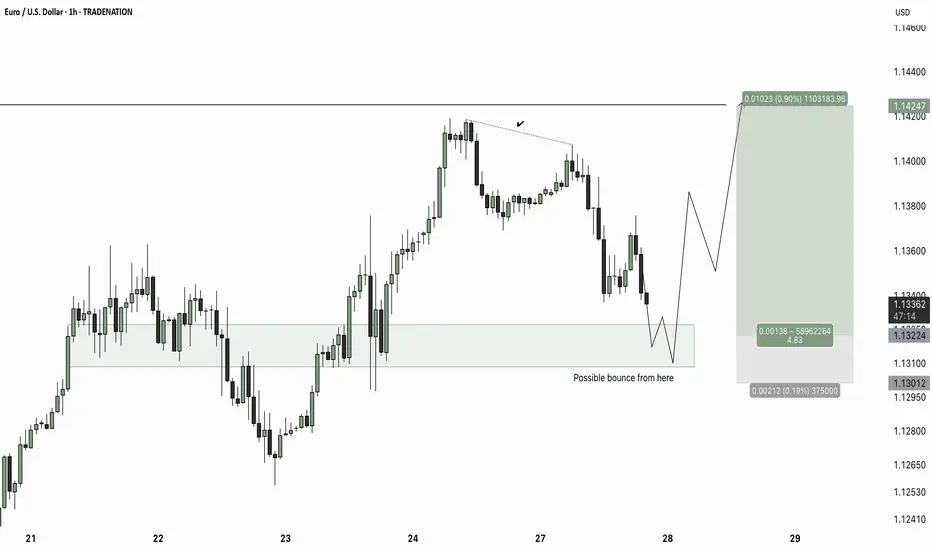
EUR/USD – Potential Short-Term TradeTime Frame: 1H
Bias: Long (Bullish Reversal Expected)
Setup Type: Reversal from Flip Zone
Date: May 27, 2025
🔍 Market Context:
The price is currently retracing after forming a short-term lower high.
It has entered a prior demand zone (highlighted box) that acted as resistance-turned-support — a classic flip zone.
The market has shown responsiveness to this zone in the past (bounces seen on May 22–23 and again on May 24), suggesting strong buyer interest remains here.
📌 Key Levels:
Interest Zone for Longs: 1.1300 – 1.1320
This is where buyers are expected to step in again. Look for bullish price action confirmation in this zone before entry.
Entry Trigger: Bullish engulfing, strong wick rejection, or bullish divergence within the demand zone.
Target Zone: 1.1424
A clean 90-pip move (approx. 0.90%) from the entry zone — aligns with the previous high and liquidity pool.
Stop Loss: Below 1.1300 (e.g., 1.1288)
To protect against deeper sweeps of the zone.
Risk-Reward: ~1:5
Excellent R:R if price reacts cleanly from the flip zone.
📈 Trade Idea Summary:
Buy EUR/USD around 1.130–1.132
Stop Loss: 1.1288
Take Profit: 1.1424
R:R Ratio: ~1:4.8
Confirmation Needed: Bullish candlestick pattern or rejection wick in the zone.
⚠️ Note:
If price slices cleanly through 1.1300 without wicks or slowing down, invalidate the setup — wait for a deeper retest or a fresh demand zone to form.
⚠️ Disclaimer
This post is purely for educational purposes. I am not a financial advisor, and nothing here should be taken as financial advice. Always consult your financial advisor before making any investment or trading decisions. Or at the very least, consult your cat. 🐱
CHFJPY Will Collapse! SELL!
My dear subscribers,
My technical analysis for CHFJPY is below:
The price is coiling around a solid key level - 174.11
Bias - Bearish
Technical Indicators: Pivot Points Low anticipates a potential price reversal.
Super trend shows a clear sell, giving a perfect indicators' convergence.
Goal - 173.84
About Used Indicators:
By the very nature of the supertrend indicator, it offers firm support and resistance levels for traders to enter and exit trades. Additionally, it also provides signals for setting stop losses
Disclosure: I am part of Trade Nation's Influencer program and receive a monthly fee for using their TradingView charts in my analysis.
———————————
WISH YOU ALL LUCK

EURGBP - NEW BREAKDOWNHello Traders !
The EURGBP reached the resistance level (0.87176 - 0.87660) and failed to break it !
The price broke the support level (0.84736 - 0.84322).
So, I expect a bearish move📉
______________
TARGET: 0.83450🎯


EURUSD sell analysis/ideaThis trade is based on the daily and 4-hour timeframes and is executed using reversal trading and trend formation. Complete explanation in the video!


#GBPJPY: +916 Pips Swing Buy Opportunity! Comment Down Your ViewThe FX:GBPJPY price has moved nicely from 187 to 191, almost +400 pips. I expect a small correction, but then the bullish move should continue towards the 200 region. You can set a target based on your analysis or set it at 200, whichever works for you. Good luck and trade safely.
Good luck and trade safely!
Thank you for your unwavering support! 😊
If you’d like to contribute, here are a few ways you can help us:
- Like our ideas
- Comment on our ideas
- Share our ideas
Team Setupsfx_
❤️🚀

Double Top Alert: Key Resistance at 1.3570 Before US PCE DataGBPUSD PLAN – MAY 27 | Double Top Alert: Key Resistance at 1.3570 Before US PCE Data
GBPUSD is currently testing a critical resistance zone near 1.3570, forming a potential Double Top pattern. As markets await this week’s US Core PCE inflation release, the pair may be at risk of a short-term pullback.
🌍 MACRO FUNDAMENTALS
USD Rebounds Slightly ahead of April’s PCE inflation report – a key Fed inflation gauge due this Friday.
GBP Under Pressure as dovish tones from Bank of England (BoE) officials signal a potential pause in rate hikes.
UK Political Uncertainty and sluggish EU-UK trade talks continue to dampen investor confidence in the pound.
📊 TECHNICAL ANALYSIS
Price Structure: GBPUSD surged from 1.3446 support but is now facing resistance near 1.3570, where a Double Top formation is emerging.
Key Levels:
Resistance: 1.3570 – 1.3580 (previous high and psychological barrier)
Support 1: 1.3496 (confluence of EMA89 and 38.2% Fibonacci retracement)
Support 2: 1.3446
Indicators:
EMA13, EMA34 show early signs of bearish crossover on the 30-minute chart.
RSI approaches overbought territory, hinting at potential bearish divergence.
🎯 TRADE SETUP (IF PRICE REJECTS 1.3570)
🔻 SELL SETUP
Entry: 1.3570 – 1.3550
Stop-Loss: 1.3595
Take-Profit Targets:
TP1: 1.3496
TP2: 1.3446
📌 A bullish breakout only becomes valid if price closes strongly above 1.3590 on the H1 chart.
🧠 STRATEGIC NOTES
Wait for a clear reaction or bearish confirmation near 1.3570 before entering trades.
Avoid chasing trades mid-range; focus on clean breakouts or rejections.
PCE data may trigger volatility — manage risk tightly and prepare for directional momentum.
👉 What do you think of this Double Top scenario? Will GBPUSD reject or break through resistance? Drop your analysis below and follow for daily structured plans!

Ready to buy AUDUSDTrade Screenshot Buy
Setup : TBO Buy
Pair : AUDUSD
CS Date : 27 may 25
CS TIME : 20:00 MY
Ready To Buy
1. TBO
2. CSR Bullish Engulfing
3. Entry Half candle Price
Following DXY continues bearish

CADCHF Will Go Higher! Long!
Take a look at our analysis for CADCHF.
Time Frame: 9h
Current Trend: Bullish
Sentiment: Oversold (based on 7-period RSI)
Forecast: Bullish
The market is on a crucial zone of demand 0.599.
The oversold market condition in a combination with key structure gives us a relatively strong bullish signal with goal 0.605 level.
P.S
The term oversold refers to a condition where an asset has traded lower in price and has the potential for a price bounce.
Overbought refers to market scenarios where the instrument is traded considerably higher than its fair value. Overvaluation is caused by market sentiments when there is positive news.
Disclosure: I am part of Trade Nation's Influencer program and receive a monthly fee for using their TradingView charts in my analysis.
Like and subscribe and comment my ideas if you enjoy them!

AUDCAD The Target Is UP! BUY!
My dear friends,
Please, find my technical outlook for AUDCAD below:
The instrument tests an important psychological level 0.8873
Bias - Bullish
Technical Indicators: Supper Trend gives a precise Bullish signal, while Pivot Point HL predicts price changes and potential reversals in the market.
Target - 0.8918
Recommended Stop Loss - 0.8850
About Used Indicators:
Super-trend indicator is more useful in trending markets where there are clear uptrends and downtrends in price.
Disclosure: I am part of Trade Nation's Influencer program and receive a monthly fee for using their TradingView charts in my analysis.
———————————
WISH YOU ALL LUCK

GBPCAD expectation 1HWith Canada releasing good news the market is responding well, we need at least 3 candles above this trend line to confirm a rise of a new high and a breaking out of the range its been in. MA is a good distance away from price, so we looking good for a buy. Trade safe guys. See you soon. #ToTheMoonTogether

USDJPY Breakout Watch | Bullish Momentum Toward Key ResistanceUSD/JPY is showing strong bullish momentum on the 15-minute chart, breaking out of a consolidation range with increased volume.
Technical Highlights:
Price has surged with strong bullish candles, showing clean impulsive movement.
The key level at 144.39 is being tested as potential breakout resistance.
If price sustains above this zone, it may target the next resistance area near 145.35.
Clean price structure with volume supporting upward movement.
Risk is managed with a stop below the breakout level, targeting a favorable risk-to-reward ratio.
This setup reflects trend continuation with bullish momentum and clear technical structure.
📈 Watching closely for confirmation and follow-through above key breakout zone.

GBPJPY BUYHonestly speaking, it wasn't funny for all JPY pairs last week, everybody collect, Hopefully the recovery that we are now seeing on some jpy pairs these week will stands. I shared trade ideas on GBPJPY, currently we are seeing some promising moves from team bullish. lets join the flow.

EURUSD Sellers In Panic! BUY!
My dear friends,
Please, find my technical outlook for EURUSD below:
The instrument tests an important psychological level 1.1346
Bias -Bullish
Technical Indicators: Supper Trend gives a precise Bullish signal, while Pivot Point HL predicts price changes and potential reversals in the market.
Target - 1.1371
About Used Indicators:
Super-trend indicator is more useful in trending markets where there are clear uptrends and downtrends in price.
Disclosure: I am part of Trade Nation's Influencer program and receive a monthly fee for using their TradingView charts in my analysis.
———————————
WISH YOU ALL LUCK

EURJPY could be about to soarThe price is stuck in a large ascending triangle pattern. But with stocks moving higher, cryptocurrencies gaining momentum, and the trade war easing, could this pattern finally break? Watch the video to see which levels matter.
This content is not directed to residents of the EU or UK. Any opinions, news, research, analyses, prices or other information contained on this website is provided as general market commentary and does not constitute investment advice. ThinkMarkets will not accept liability for any loss or damage including, without limitation, to any loss of profit which may arise directly or indirectly from use of or reliance on such information.

GBPNZD Trading Opportunity! SELL!
My dear friends,
Please, find my technical outlook for GBPNZD below:
The instrument tests an important psychological level 2.2738
Bias - Bearish
Technical Indicators: Supper Trend gives a precise Bearish signal, while Pivot Point HL predicts price changes and potential reversals in the market.
Target - 2.2584
Recommended Stop Loss - 2.2812
About Used Indicators:
Super-trend indicator is more useful in trending markets where there are clear uptrends and downtrends in price.
Disclosure: I am part of Trade Nation's Influencer program and receive a monthly fee for using their TradingView charts in my analysis.
———————————
WISH YOU ALL LUCK
