EURUSD FORMED BEARISH PENNANT. THE PRICE IS READY TO DROP.EURUSD FORMED BEARISH PENNANT. THE PRICE IS READY TO DROP.
EURUSD has been trading sideways within the last day, showing lower highs and higher lows. Eventually, the price has formed the pennant chart pattern.
What is a pennant?
A pennant chart pattern is a short-term continuation pattern in technical analysis, resembling a small symmetrical triangle, formed after a strong price movement (flagpole). It consists of converging trendlines, indicating a brief consolidation before the trend resumes. Bullish pennants form after an uptrend, bearish pennants after a downtrend.
The price is expected to decline towards 1.14500 support level
Forex market

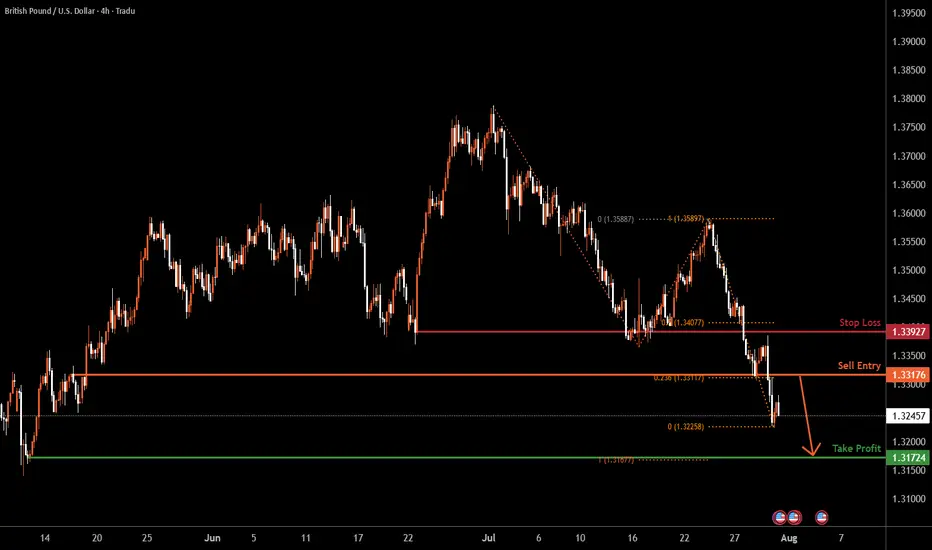
GBPUSD H4 | Bearish continuationThe Cable (GBP/USD) is rising towards the sell entry, which is a pullback resistance that aligns with the 23.6% Fibonacci retracement and could drop lower from this level.
Sell entry is at 1.3317, which is a pullback resistance that lines up with the 23.6% Fibonacci retracement.
Stop loss at 1.3392, which is a pullback resistance that is slightly below the 50% Fibonacci retracement.
Take profit is at 1.3172, which is a swing low support that aligns with the 100% Fibonacci projection.
High Risk Investment Warning
Trading Forex/CFDs on margin carries a high level of risk and may not be suitable for all investors. Leverage can work against you.
Stratos Markets Limited (tradu.com ):
CFDs are complex instruments and come with a high risk of losing money rapidly due to leverage. 65% of retail investor accounts lose money when trading CFDs with this provider. You should consider whether you understand how CFDs work and whether you can afford to take the high risk of losing your money.
Stratos Europe Ltd (tradu.com ):
CFDs are complex instruments and come with a high risk of losing money rapidly due to leverage. 66% of retail investor accounts lose money when trading CFDs with this provider. You should consider whether you understand how CFDs work and whether you can afford to take the high risk of losing your money.
Stratos Global LLC (tradu.com ):
Losses can exceed deposits.
Please be advised that the information presented on TradingView is provided to Tradu (‘Company’, ‘we’) by a third-party provider (‘TFA Global Pte Ltd’). Please be reminded that you are solely responsible for the trading decisions on your account. There is a very high degree of risk involved in trading. Any information and/or content is intended entirely for research, educational and informational purposes only and does not constitute investment or consultation advice or investment strategy. The information is not tailored to the investment needs of any specific person and therefore does not involve a consideration of any of the investment objectives, financial situation or needs of any viewer that may receive it. Kindly also note that past performance is not a reliable indicator of future results. Actual results may differ materially from those anticipated in forward-looking or past performance statements. We assume no liability as to the accuracy or completeness of any of the information and/or content provided herein and the Company cannot be held responsible for any omission, mistake nor for any loss or damage including without limitation to any loss of profit which may arise from reliance on any information supplied by TFA Global Pte Ltd.
The speaker(s) is neither an employee, agent nor representative of Tradu and is therefore acting independently. The opinions given are their own, constitute general market commentary, and do not constitute the opinion or advice of Tradu or any form of personal or investment advice. Tradu neither endorses nor guarantees offerings of third-party speakers, nor is Tradu responsible for the content, veracity or opinions of third-party speakers, presenters or participants.
The Fed aftermath. US dollar bulls enjoy the moment.The US dollar bulls went in hard after during and after the Fed's press conference. Can the momentum stay? Let's dig in.
MARKETSCOM:DOLLARINDEX
TVC:DXY
Let us know what you think in the comments below.
Thank you.
75.2% of retail investor accounts lose money when trading CFDs with this provider. You should consider whether you understand how CFDs work and whether you can afford to take the high risk of losing your money. Past performance is not necessarily indicative of future results. The value of investments may fall as well as rise and the investor may not get back the amount initially invested. This content is not intended for nor applicable to residents of the UK. Cryptocurrency CFDs and spread bets are restricted in the UK for all retail clients.

EURUSD H4 | Bearish reversal off overlap resistanceThe Fiber (EUR/USD) is rising towards the sell entry, which is an overlap resistance and could drop lower.
Sell entry is at 1.1452, which is an overlap resistance.
Stop loss is at 1.1536, which is a pullback resistance that lines up with the 38.2% Fibonacci retracement.
Take profit is at 1.1323, which is a pullback support that is slightly below the 78.6% Fibonacci retracement.
High Risk Investment Warning
Trading Forex/CFDs on margin carries a high level of risk and may not be suitable for all investors. Leverage can work against you.
Stratos Markets Limited (tradu.com ):
CFDs are complex instruments and come with a high risk of losing money rapidly due to leverage. 65% of retail investor accounts lose money when trading CFDs with this provider. You should consider whether you understand how CFDs work and whether you can afford to take the high risk of losing your money.
Stratos Europe Ltd (tradu.com ):
CFDs are complex instruments and come with a high risk of losing money rapidly due to leverage. 66% of retail investor accounts lose money when trading CFDs with this provider. You should consider whether you understand how CFDs work and whether you can afford to take the high risk of losing your money.
Stratos Global LLC (tradu.com ):
Losses can exceed deposits.
Please be advised that the information presented on TradingView is provided to Tradu (‘Company’, ‘we’) by a third-party provider (‘TFA Global Pte Ltd’). Please be reminded that you are solely responsible for the trading decisions on your account. There is a very high degree of risk involved in trading. Any information and/or content is intended entirely for research, educational and informational purposes only and does not constitute investment or consultation advice or investment strategy. The information is not tailored to the investment needs of any specific person and therefore does not involve a consideration of any of the investment objectives, financial situation or needs of any viewer that may receive it. Kindly also note that past performance is not a reliable indicator of future results. Actual results may differ materially from those anticipated in forward-looking or past performance statements. We assume no liability as to the accuracy or completeness of any of the information and/or content provided herein and the Company cannot be held responsible for any omission, mistake nor for any loss or damage including without limitation to any loss of profit which may arise from reliance on any information supplied by TFA Global Pte Ltd.
The speaker(s) is neither an employee, agent nor representative of Tradu and is therefore acting independently. The opinions given are their own, constitute general market commentary, and do not constitute the opinion or advice of Tradu or any form of personal or investment advice. Tradu neither endorses nor guarantees offerings of third-party speakers, nor is Tradu responsible for the content, veracity or opinions of third-party speakers, presenters or participants.

USD/CAD SHORT FROM RESISTANCE
Hello, Friends!
It makes sense for us to go short on USD/CAD right now from the resistance line above with the target of 1.376 because of the confluence of the two strong factors which are the general downtrend on the previous 1W candle and the overbought situation on the lower TF determined by it’s proximity to the upper BB band.
Disclosure: I am part of Trade Nation's Influencer program and receive a monthly fee for using their TradingView charts in my analysis.
✅LIKE AND COMMENT MY IDEAS✅

Closed Longs, Now Selling Rallies on EURUSD ReversalAs mentioned in my previous posts, I’m been bullish on EURUSD in the medium term, targeting 1.20 and even beyond.
But no pair—especially not EURUSD, which tends to move more steadily and rationally—goes up in a straight line.
________________________________________
🔹 Last week, the pair stalled just below 1.18, and I decided to close my long trade with a +150 pip gain. That proved to be a wise call, as price dropped hard shortly after.
________________________________________
📉 What’s happening now?
• EURUSD has broken below the rising trendline
• More importantly, it’s broken below the neckline of a double top pattern
• Now trading around 1.1535
This opens the door for a deeper correction, and I expect we could see a test of the 1.1150–1.1100 zone by the end of summer.
________________________________________
📌 Trading Plan:
• I’m now in sell-the-rally mode
• Ideal short entry: around 1.1650, where we also get a favorable 1:3+ risk-reward
• Watch also for interim support around 1.1400
________________________________________
Conclusion:
The bigger picture remains bullish— but this correction looks healthy and isn’t done yet.
Selling rallies makes more sense now, until the structure tells us otherwise.
Disclosure: I am part of TradeNation's Influencer program and receive a monthly fee for using their TradingView charts in my analyses and educational articles.

NZD/USD SELLERS WILL DOMINATE THE MARKET|SHORT
Hello, Friends!
NZD-USD uptrend evident from the last 1W green candle makes short trades more risky, but the current set-up targeting 0.594 area still presents a good opportunity for us to sell the pair because the resistance line is nearby and the BB upper band is close which indicates the overbought state of the NZD/USD pair.
Disclosure: I am part of Trade Nation's Influencer program and receive a monthly fee for using their TradingView charts in my analysis.
✅LIKE AND COMMENT MY IDEAS✅

EUR/USD Potential Bearish MoveHi Traders.
1. HTF Expanding Structure
2. HnS Pattern
3. LTF Bearish Impulse
4. Breakout from Structure
Wait for LTF Correction and Breakout to confirm this setup

Fundamental Market Analysis for July 31, 2025 GBPUSDGBPUSD:
The pound remains under pressure as consumer spending and the labor market in the UK are weakening, reducing the likelihood of an aggressive response from the Bank of England. Core inflation has dropped to 3.3% y/y – the lowest in two years – allowing the regulator to keep rates steady for longer.
External factors are also unfavorable: demand for the defensive dollar is strengthening ahead of the FOMC meeting, and the yield spread between 10-year gilts and USTs has narrowed to 115 basis points – the lowest since March, stimulating flows into the dollar.
Additional negative dynamics come from the rise in the UK current account deficit to 3.9% of GDP, amid higher prices for imported energy and declining exports of services. Expectations of tighter fiscal consolidation are increasing fiscal risks and encouraging investors to reduce long GBP positions.
Risks to the bearish outlook are limited: these would be a surprise in the form of hawkish Bank of England comments or a sharp deterioration in US macro data that could weaken the dollar.
Trade recommendation: SELL 1.32700, SL 1.32900, TP 1.31700

GBPJPY is moving towards a decrease in the parity rate.The predicted direction of movement for this high-margin currency pair seems to me to be more of a corrective one and I have displayed my desired price target on the chart. If it is in line with your analysis, you can use this price target for your profit limit points. Please note that this is a weekly chart.
Thanks
MJ.REZEI

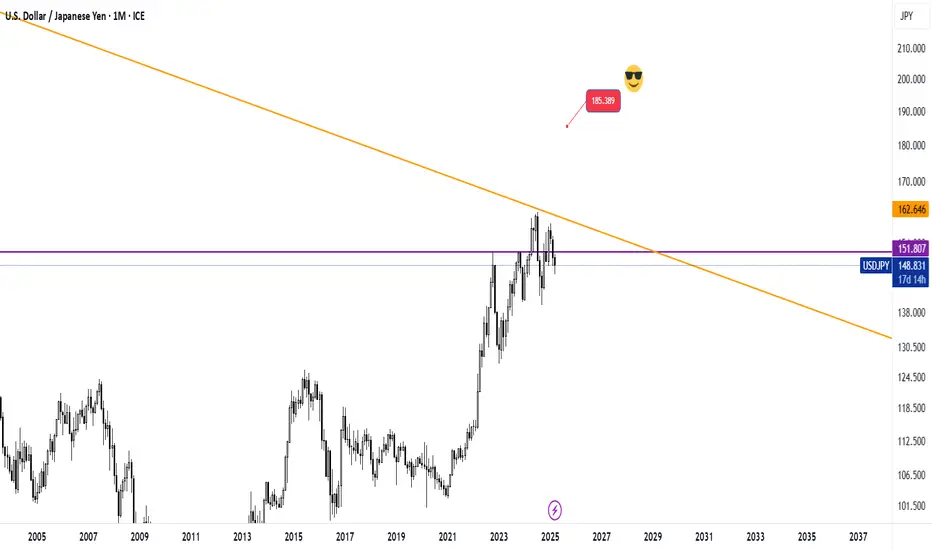
Increasing chances of bullish volatility in JPYThe fluctuations formed since May 2024 indicate a strengthening of the possibility of upward fluctuations in the currency pair, and in the long term, there is news of price targets in the range of 185 units!
Be careful, we will face numerous upward and downward fluctuations until the desired price target is reached!
Good luck
MJ.REZAEI
eurusd buy short termafter yesterday's drop of the euro, today and tomorrow should make a small correction of 100 pips, extending to 150 pips, until the value of 1.1550

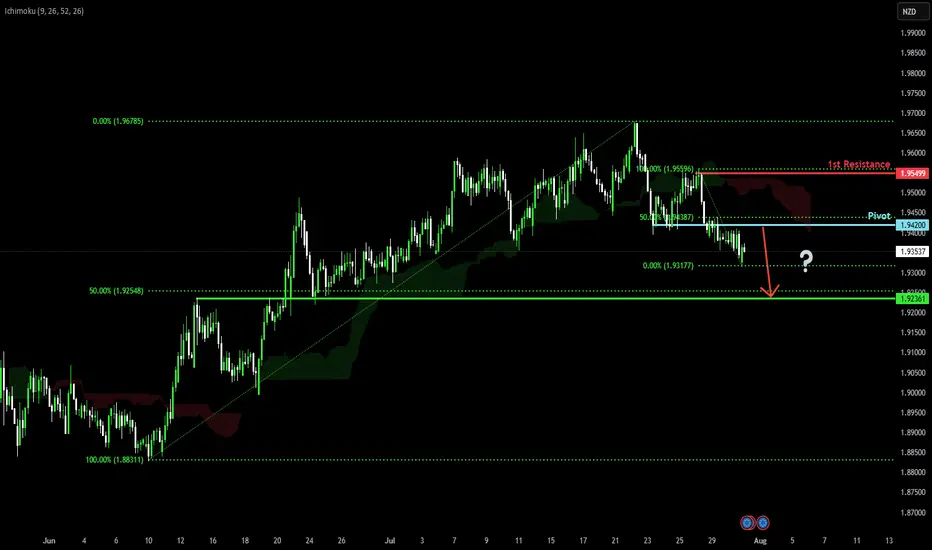
Potential bearish drop?EUR/NZD has rejected off the pivot and could drop to the overlap support.
Pivot: 1.94200
1st Support: 1.92361
1st Resistance: 1.95499
Risk Warning:
Trading Forex and CFDs carries a high level of risk to your capital and you should only trade with money you can afford to lose. Trading Forex and CFDs may not be suitable for all investors, so please ensure that you fully understand the risks involved and seek independent advice if necessary.
Disclaimer:
The above opinions given constitute general market commentary, and do not constitute the opinion or advice of IC Markets or any form of personal or investment advice.
Any opinions, news, research, analyses, prices, other information, or links to third-party sites contained on this website are provided on an "as-is" basis, are intended only to be informative, is not an advice nor a recommendation, nor research, or a record of our trading prices, or an offer of, or solicitation for a transaction in any financial instrument and thus should not be treated as such. The information provided does not involve any specific investment objectives, financial situation and needs of any specific person who may receive it. Please be aware, that past performance is not a reliable indicator of future performance and/or results. Past Performance or Forward-looking scenarios based upon the reasonable beliefs of the third-party provider are not a guarantee of future performance. Actual results may differ materially from those anticipated in forward-looking or past performance statements. IC Markets makes no representation or warranty and assumes no liability as to the accuracy or completeness of the information provided, nor any loss arising from any investment based on a recommendation, forecast or any information supplied by any third-party.
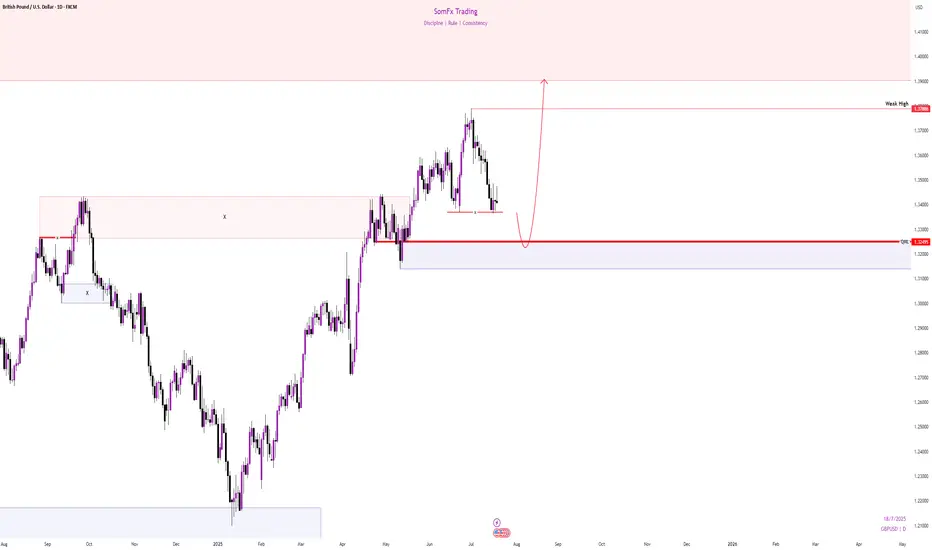
GBPUSD Big Bullish Move incoming.GGBPUSD as trending to the upside quite a few months, breaking above 1.3450 leaving behind a Trapped zone for the sellers which is weekly Flip level which happened right before the breaking up and also the market created a liquidity Zone which is intended to further Trap the the seller, and it is acting as a Double Bottom area, i hope sellers will be trapped the next week and righ after that we look for our bullish positions.
USDJPY AnalysisThis analysis is based on the 4-hour timeframe, reversal trading, and trend formation. I' looking for buys in this market and I explained why in the video. I will post updates on this analysis soon!

GBPJPY ShortGBPJPY is short on the regression break.
I am not taking this trade, as it has terrible roll short and the other GBP and JPY crosses are not following.

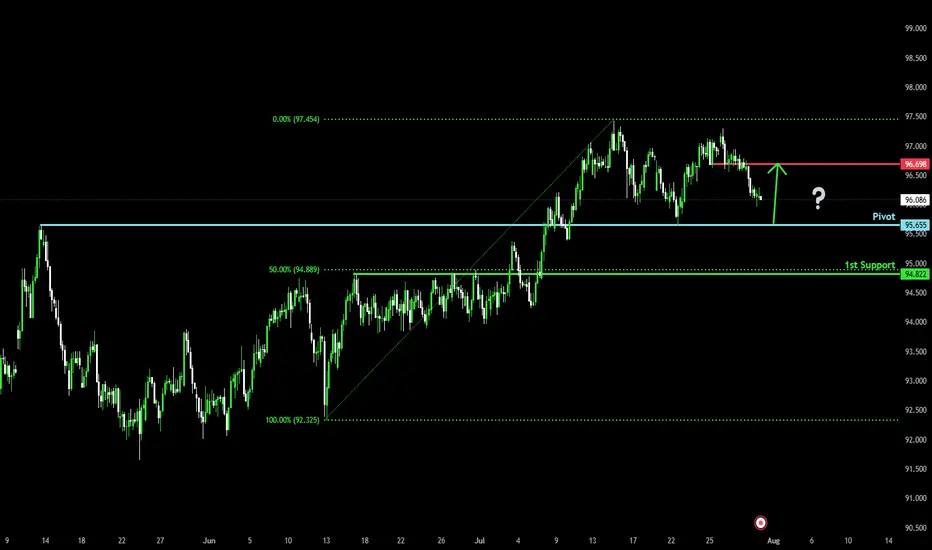
Falling towards overlap support?AUD/JPY is falling towards the pivot, which has been identified as an overlap support and could bounce to the 1st resistance.
Pivot: 95.65
1st Support: 94.82
1st Resistance: 96.69
Risk Warning:
Trading Forex and CFDs carries a high level of risk to your capital and you should only trade with money you can afford to lose. Trading Forex and CFDs may not be suitable for all investors, so please ensure that you fully understand the risks involved and seek independent advice if necessary.
Disclaimer:
The above opinions given constitute general market commentary, and do not constitute the opinion or advice of IC Markets or any form of personal or investment advice.
Any opinions, news, research, analyses, prices, other information, or links to third-party sites contained on this website are provided on an "as-is" basis, are intended only to be informative, is not an advice nor a recommendation, nor research, or a record of our trading prices, or an offer of, or solicitation for a transaction in any financial instrument and thus should not be treated as such. The information provided does not involve any specific investment objectives, financial situation and needs of any specific person who may receive it. Please be aware, that past performance is not a reliable indicator of future performance and/or results. Past Performance or Forward-looking scenarios based upon the reasonable beliefs of the third-party provider are not a guarantee of future performance. Actual results may differ materially from those anticipated in forward-looking or past performance statements. IC Markets makes no representation or warranty and assumes no liability as to the accuracy or completeness of the information provided, nor any loss arising from any investment based on a recommendation, forecast or any information supplied by any third-party.
EURUSD: Buy or Sell?Dear friends!
On our 1D chart, after careful observation, we can see that a wedge pattern is forming. After EURUSD breaks out of the previous trend and completes the correction phase, a new downtrend is likely to be established.
Adam's target is to break above the 1.16000 support level and head towards the lower support level of 1.140000, which is where the pine attracts a large amount of buyers.
And you, do you think the price will go up or down? What is the target for your thinking?

EURUSD SELL SHORTEURUSD in Daily TF Market will bearish , In Daily TF mss in LTF after valid MSS then Entry short in LTF
Target to Monthly BISI / Monthly OBI / OB
enjoYYYYYYYYYYYYYYYYYYYYYYYYYYYYYYYYYYYYYYYYYYYYYYYYYYYYYYYYYYYYYYYYYYYY

EURJPY 300+ PIP DROPFrom the beginning of the week i have called out shorts on EJ into 170.000 in the video we can see price hit that support and hitting target for a few positions and entry i called out during the week and also some key points for your personal trading

USD-JPY Will Keep Growing! Buy!
Hello,Traders!
USD-JPY keep growing and
The pair made a bullish breakout
Of the key horizontal level
Of 149.181 and the pair is
Already retesting the new
Support and we will be
Expecting a further
Bullish move up
Sell!
Comment and subscribe to help us grow!
Check out other forecasts below too!
Disclosure: I am part of Trade Nation's Influencer program and receive a monthly fee for using their TradingView charts in my analysis.

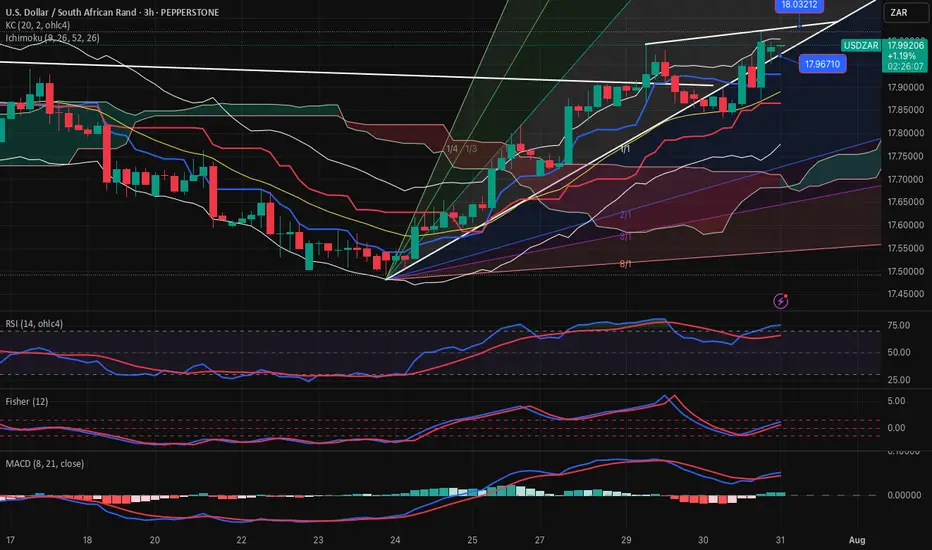
USDZAR-SELL strategy 3 hourly chart GANNThe pair has upward pressure and I suspect we will see little higher. Perhaps we may touch near 18.0500-18.0975 area, before selling pressure may set in. Since we have established 17.8500 area, it is wise to wait for the SELL. We are approaching overbought levels.
Strategy SELL @ 18.0650-18.1150 and take profit near 17.8875.
USDJPYMaintaining Long Bias On UJ. Targetted price prediction are the orange and blue arrow for both TP1 and TP2
Trade safe and manage you risk wisely
