USD/JPY Robbery Route | Enter at Dip, Exit Before Police💥USD/JPY Forex Money Heist Plan 🎯 — Ninja Robbery at 146.000💥
🌟 Hi! Hola! Ola! Bonjour! Hallo! Marhaba! 🌟
Dear Market Bandits, Money Makers & Risky Robbers 🤑💰💸✈️
Welcome to another Thief Trader-style operation. We've cracked open the USD/JPY vault (aka "The Gopher" 💹), and here's the blueprint to pull off this forex heist like true professionals. 💼🎭💵
🚨 Strategy Overview
This isn't just a trade – it’s a well-researched, precision-timed robbery mission based on technicals, macro analysis, sentiment, and the bigger global picture.
Expect action near critical zones – especially the moving average barricade, where police (aka risk) is waiting. Stay sharp.
🔓 Entry Point – Unlock the Vault
📈 Watch for bullish pullbacks near 146.000.
Whether it's a dip, zone test, or wick bounce — you’re looking to layer buy limit orders like a seasoned thief using DCA tactics.
Enter on swings or any bullish confirmation.
Heist Window is Open.
🛑 Stop Loss – Escape Route
📍 SL near 143.000 (1D swing low) — adjust based on your capital and position size.
💡 Don’t go blind — SL is your backup plan, not an optional accessory.
Custom-fit it based on how many entries you’re stacking.
🎯 Target – Vault Exit Point
🏁 151.000 or exit before resistance heat catches on.
No greedy thieves here — precision exit is key.
Lock profits, vanish in style. 🕶️💼💸
🧲 Scalpers Take Note
Only long side raids are valid. Scalping against the trend? That's walking into a trap.
Use trailing SLs and protect your loot.
Small bag or big vault — play your game smart. 🎯💰
📢 Fundamental Boosters
USD/JPY’s bullish run isn’t random — it’s backed by:
📊 Macro shifts,
📈 COT reports,
🧠 Sentiment drivers,
📉 Intermarket trends,
And a whole mix of thief-level intel 🔍
🧭 Dive deeper before acting. The map’s been provided. 🔗🌍
🗞 News Traps Ahead – Move Cautiously
🚫 Avoid new trades during major releases
🔁 Use trailing SLs on open positions
💡 Position management is a thief’s best defense. Risk management keeps you in the game. 🎯🧠
🔥💖 Support the Heist Crew
Smash that ❤️🔥 Boost Button to keep our robbery engine running.
Each boost = strength for our crew.
💬 Share the love, spread the intel, and trade like a rogue with brains. 🤝💵
👀 Stay tuned for more high-profile FX heists from Thief Trader.
Until next time — loot wisely, vanish clean. 🐱👤💨
Forex market

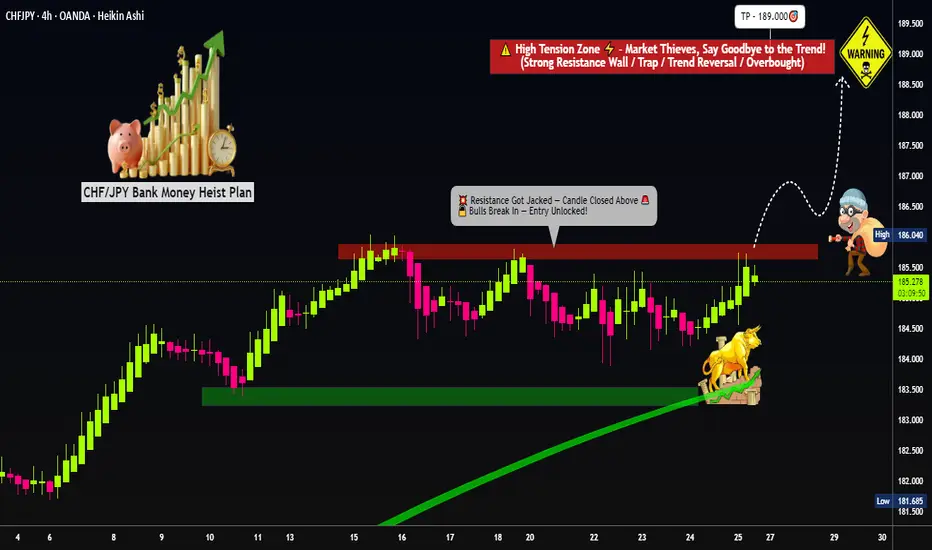
"Master Plan to Rob CHF/JPY – Breakout Trading Idea"💣CHF/JPY Forex Heist: Swiss vs Yen 🔥Master Robbery Plan Unfolded!
🌟Hi! Hola! Ola! Bonjour! Hallo! Marhaba!🌟
Dear Money Makers, Bandits & Chart Pirates 🤑💰💸✈️
It's time to reload your gear and lock in the blueprint. Based on our 🔥Thief Trader Technical + Fundamental Intelligence🔥, we’re all set to ambush the CHF/JPY "Swiss vs Yen" battlefield. This ain’t no casual walk—it’s a full-scale market operation targeting the High Voltage Reversal Trap Zone⚡. The pressure is real: Overbought, Tricky Consolidation, and Bears camping at resistance. Your job? Steal profits before they smell the breakout! 🏆💪💵
🎯 Entry Point — "Let the Heist Begin"
🗝 Entry Level: Wait for the Breakout @ 186.000. When price shatters the Moving Average ceiling—that's your greenlight!
🚀 Execution Choices:
Place Buy Stop above the breakout point
Or, use Buy Limit Orders near recent swing highs/lows on the 15/30-min chart using Layering/DCA tactics (that’s how the real thieves sneak in 🕶️).
🔔 Set an alert to stay sharp—don’t miss the vault crackin’ open!
🛑 Stop Loss — “Cover Your Escape”
🎯 SL Level: Just under the recent swing low on the 4H timeframe (around 184.000)
🚫 Never place the SL before the breakout confirms! Let the move prove itself first.
🧠 SL sizing depends on your capital, lot size, and number of entries stacked. You control the risk, not the other way around!
🎯 Target — "Cash Out or Vanish"
💎 First Take-Profit: 189.000
🚪Optional Escape: Secure the bag early if momentum fades. Better leave rich than be late!
👀 For Scalpers & Swing Robbers Alike
🔍 Scalpers: Only ride the Long wave.
💼 Big pockets? Hit straight entry.
👟 Small capital? Tag in with swing trades and trail that SL like a pro.
🎣 Use a Trailing SL to lock profits as price sprints toward resistance.
📰 The Bigger Picture: Why CHF/JPY?
The pair is pumped by:
📈 Macro Economics
📊 Quant Analysis
📰 COT Reports
📉 Intermarket Correlations
🧠 Sentiment Heatmaps
🔥 Future Price Dynamics
Don’t pull the trigger blind. Read the battlefield before charging in.
⚠️ Thief’s Caution Zone: News Traps Ahead
🛎 News = chaos.
📌 Avoid entering fresh trades during major data drops.
🔐 Use Trailing SLs to protect ongoing plays.
📉 Let the market dance, but you control the music.
💥Hit the Boost Button!💥
If this heist plan pumps your portfolio, smash that boost. That’s how we fund more blueprints, fuel the Thief Gang’s vault, and keep the robbery cycle alive.
🤑💵 Together, let’s rob this market clean—Thief Style.
New plan drops soon. Stay locked. Stay sharp. Stay profitable.
🧠💰🏴☠️
— Thief Trader Out 🐱👤🔓🚀
Pound-yen consolidates below critical resistanceWeaker retail data and concerns about fiscal policy which affected the pound negatively and caused it to decline against various other major currencies don’t seem to have had a big impact on GBPJPY. Several recent trade deals between the USA and other countries including Japan have reduced demand for havens like the yen and gold. The big shift recently was a significant decline in expectations for the BoJ to hike at its upcoming meeting on 31 July: a hold at 0.5% now seems much more likely.
¥200 would normally be a strong area of psychological resistance and this seems to be likely based on unsuccessful tests in the fourth quarter of 2024. Above there, the next likely area of resistance might be ¥207 around last summer’s highs. Another attempt to push above ¥200 might be more technically likely to succeed because there’s no longer an overbought signal from the slow stochastic. ATR at new lows though could indicate a retracement lower rather than a new upward wave.
There’s no obvious candidate for short-term static support but dynamic support would probably come from the 50 SMA from Bands. British credit and mortgage data on 29 July might increase intraday volatility somewhat but the next strong catalyst is much more likely to come from news about tariffs and/or the BoJ’s press conference on 31 July.
This is my personal opinion, not the opinion of Exness. This is not a recommendation to trade.

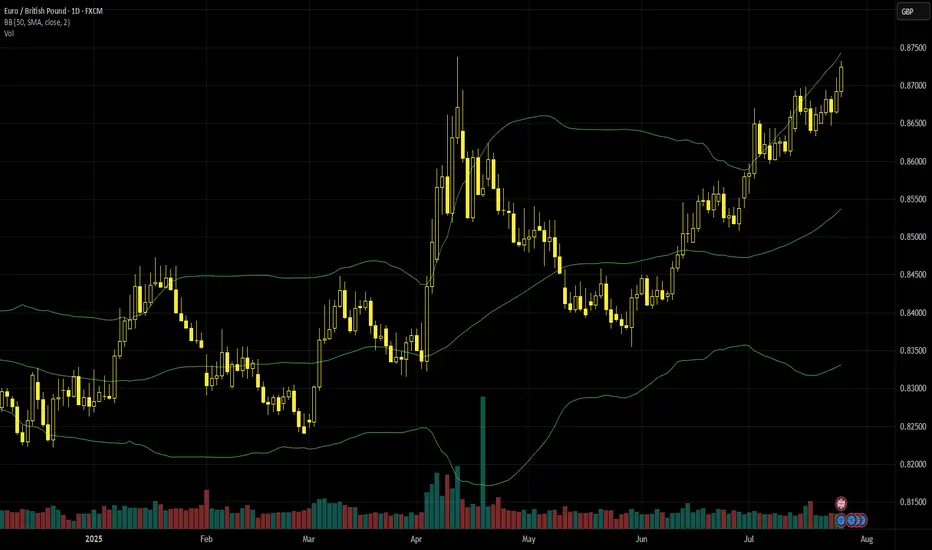
Euro-pound retests April’s highsThe ECB’s relative hawkishness or at least lower dovishness on 24 July seems to have boosted the euro significantly, with euro-pound in particular continuing its uptrend. Here though the generally weaker recent sentiment on British growth and disappointing retail data added fuel to EURGBP’s gains. There’s also some likelihood that the EU will secure a trade deal with the USA in the next few days before the deadline for new tariffs of 1 August.
87p on 24 July was euro-pound’s highest daily close since December 2023 and gains continued intraday the following day with a clear push above the 23.6% monthly Fibonacci retracement. The overall trend since March is upward and these two days might suggest that the latest phase of it isn’t close to exhaustion yet; on the contrary, momentum has increased in recent sessions. However, volume has been significantly lower since late April and now a seasonal further drop might be possible. The slow stochastic signals overbought and ATR hasn’t risen significantly in recent days.
The 20 SMA might be an important dynamic support in the near future, but first it’d be possible to see the 23.6% Fibo flipping to support from resistance previously. Traders are looking ahead to the eurozone’s flash GDP for Q2 on 30 July and inflation on 1 August although the latter might be overshadowed by the NFP the same day.
This is my personal opinion, not the opinion of Exness. This is not a recommendation to trade.
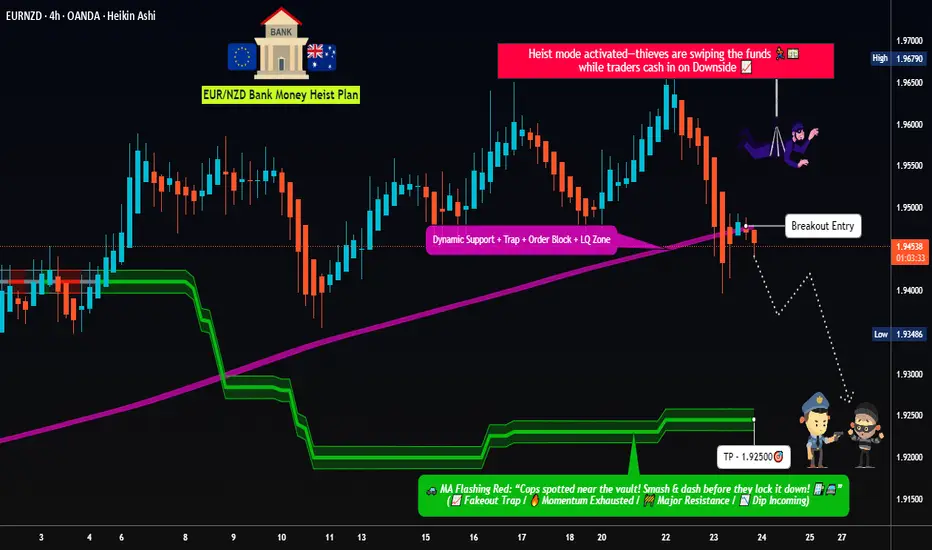
Dynamic Entry Alert – EUR/NZD Bearish Heist Execution!💣 EUR/NZD Robbery Blueprint: The Kiwi Vault Bearish Heist Plan 💰🕵️♂️
🌟Hi! Hola! Ola! Bonjour! Hallo! Marhaba!🌟
Dear Money Makers & Robbers, 🤑💰✈️
This ain't your usual trading tip — it’s a Thief Trading Masterstroke 🎯. We're gearing up for a high-stakes heist on the EUR/NZD forex market. Time to crack open the Kiwi vault and rob those bullish bandits blind! 😼💣
🧠 Strategic Mindset:
🔍 We're targeting the oversold consolidation zone. Bullish traders think they’re safe? Think again. This area is a trap — the perfect bait for our bearish ambush. Expect trend reversal vibes, layered with juicy liquidity grabs.
🕵️♂️ Entry Plan:
🎯 Sell Entry Trigger: Wait for a clean break below 1.94500.
💣 Setup:
Place Sell Stop Orders below the MA Support Breakout
Or... go stealth: Sell Limit Orders at nearest swing highs (15m or 30m timeframe)
Use DCA / Layering Method for multiple entries (scalp or swing tactics)
📌 Set your Alert 🚨 — no breakout, no entry. Patience pays.
🛑 Stop Loss Strategy (SL):
No premature moves! Don’t place that SL till we get the confirmed break.
🔥 SL Recommendation:
Just above 1.95700 (4H candle wick swing high)
Adjust based on lot size and number of layers
📍 Remember, the market’s a jungle — stay sharp or get sliced.
🎯 Take Profit (TP):
💵 Target Zone: 1.92500
(But hey, escape early if the vault starts shaking. Protect your gains like a pro.)
📊 Macro Intel – Why This Works:
This isn’t random — it's backed by our 🔥 combo of:
COT Reports
Sentiment Analysis
Quant/Algo Bias
Intermarket Correlation
Fundamental + Technical Confirmation
📌 You can dig deeper — but trust me, this setup’s been scouted like a pro job.
⚠️ Risk Protocols:
Avoid entries during high-impact news
Use Trailing SLs to lock in the loot
Adjust position size to suit your personal bankroll & risk appetite
🔥 Final Word from the Thief:
Smash that 💥Boost Button💥 if you're vibing with the heist plan!
Support the squad, stay profitable, and rob the market — legally, of course.
We don’t trade, we infiltrate.
We don’t predict, we execute.
📡 Stay tuned… More robbery blueprints coming soon!
🤑🐱👤🚨💸💪 #ThiefTrader #ForexHeist #EURNZDShortPlan
EUR/USD - Sells on H1EUR/USD broke an Ascending Channel and have also shifted the trend downwards.
We will wait for a pullback to 0.5 - 0.618 Fib level for entry with the SL placed above the last high

EUR/GBP Pushing higherLooks like a good trade to the upside on the EUR/GBP.
Risk to reward potential 3:1
Upward trend is well formed

CHECK EURJPY SIGNAL UPDATE GO AND READ CAPTAINEntry Point: Around 173.350 TO 173.200
Take Profit 1: 172.600
Take Profit 2: 171.900
Last Target: 171.200
Stop Loss: 173.900

EURGBP near the current highest point of 2025.FX_IDC:EURGBP is slowly approaching a strong area of resistance, which is the current highest point of 2025. Let's dig in...
MARKETSCOM:EURGBP
Let us know what you think in the comments below.
Thank you.
75.2% of retail investor accounts lose money when trading CFDs with this provider. You should consider whether you understand how CFDs work and whether you can afford to take the high risk of losing your money. Past performance is not necessarily indicative of future results. The value of investments may fall as well as rise and the investor may not get back the amount initially invested. This content is not intended for nor applicable to residents of the UK. Cryptocurrency CFDs and spread bets are restricted in the UK for all retail clients.


USDNOK short potential setupUSDNOK recently broke down below the monthly 50ema (overlayed on this 4h chart) and has rejected off the daily 20ema (overlayed) twice this week. RSI is showing bearish momentum after a brief overbought period while the PA has remained in a strong downtrend. Short setup potential is evident but not certain.
I'm a cat not a financial advisor.

EURUSD: Will Go Up! Long!
My dear friends,
Today we will analyse EURUSD together☺️
The price is near a wide key level
and the pair is approaching a significant decision level of 1.17201 Therefore, a strong bullish reaction here could determine the next move up.We will watch for a confirmation candle, and then target the next key level of 1.17348.Recommend Stop-loss is beyond the current level.
❤️Sending you lots of Love and Hugs❤️

AUDUSD Engineered to Drop?🧠MJTrading:
📸 Viewing Tip:
🛠️ Some layout elements may shift depending on your screen size.
🔗 View the fixed high-resolution chart here:
🔻 OANDA:AUDUSD – Tagged the Top | Smart Money Eyes Lower Levels??
📍 Perfect Respect of Channel Structure
AUDUSD has just kissed the upper boundary of a long-standing ascending channel, showing sharp rejection — a sign that premium pricing might now shift toward discount levels.
📈 The aggressive push into the highs likely aimed to clear buy stops — fulfilling smart money objectives before a potential reversal.
📉 And here’s the subtle clue:
Just below the last bullish candle lies a thin slide — a structural weakness.
If price breaks and closes below that full body bearish candle (Below 0.66000), the market could slip fast, unleashing a momentum-driven drop into the first liquidity zone (0.6520s).
🧠 For smart money lovers, this is the classic:
Sweep → Trap → Slide
📏 And for fans of parallelism, the chart’s geometry offers a rare beauty — lines in harmony, structure in rhythm, and opportunity in alignment.
🔍 What to Watch For:
Break below 0.66000 (last candle body) = entry signal
0.6520–0.6540: first liquidity zone
0.6400–0.6300: deeper cleanout, if bearish pressure sustains
Inset: DXY bouncing from long-term demand supports bearish thesis
Manage your risk wisely...
For Lower time frame traders:
Psychology Always Matters:
(Click on the pictures for caption and concepts)
#AUDUSD #SmartMoney #LiquiditySweep #ChannelTrading #ChartDesigner #MJTrading #PriceAction #Forex

NZDUSD - EURUSDHi TRADERS, while we are looking to trade NZDUSD mkt wave to the upside on the 4h chart let's not think that "it may" be the same as to EURUSD, because the DOUBLE TOP PATTERN that was formed from January 4th through May 21st 2021 and then breaks to the downside have just came to retest supply zone aera on JUNE 30th 2025, and sell off a little. And this week JULY 21st 2025, buyers push price to that same W/D supply zone that also can be called SOPPRT RESISTANCE PIVOT POINT AERAS after a long period of FOUR YEARS, for the first time . My humble opinion

EURUSD at Make-or-Break Zone: Time to Short?EURUSD – Key Data Out Today, Short Setup Confirmed?
Today, several important economic indexes were released for both the Euro(EUR) and the Dollar(USD) . Let’s break them down in a simple way:
Eurozone PMI Data: Mixed to Weak
France:
Manufacturing PMI: 48.4 (slightly lower than forecast)
Services PMI : 49.7 (flat, but below 50 = contraction)
Germany:
Manufacturing PMI: 49.2 (weaker than expected)
Services PMI : 50.1(slightly expansionary)
Eurozone Overall:
Manufacturing PMI: 49.8 (still below 50)
Services PMI : 51.2 (slightly stronger than forecast)
ECB left the Main Refinancing Rate unchanged at 2.15% , which was widely expected.
U.S. Data( TVC:DXY ): Strong and Surprising
Unemployment Claims: 217K (better than expected 227K)
Manufacturing PMI: 49.5 (below forecast of 52.7 – a negative surprise)
Services PMI: 55.2 (well above forecast and previous – bullish for USD)
Interpretation :
The Eurozone's growth remains sluggish, especially in France and Germany.
Despite a drop in U.S. manufacturing, the services sector remains strong, and unemployment data confirms labor market resilience.
This mixed picture slightly tilts the balance in favor of the U.S. dollar, especially as the ECB remains on hold while the Fed may still consider being restrictive.
Bias: Short EURUSD ( FX:EURUSD )
Fundamentals support a Short position in EURUSD, in line with the current technical setup.
---------------------------------
Now let's take a look at the EURUSD chart on the 4-hour time frame to find the best Short position .
EURUSD is currently trading in an Ascending Channel and at a Heavy Resistance zone($1.1845-$1.1602) .
Also, in terms of Elliott wave theory , it seems that EURUSD is completing a microwave 5 of the main wave 5 .
One of the most important supports ahead for EURUSD could be the 100_SMA(4-hour TF) .
If the currently 4-hour candlestick forms a Shooting Star Candlestick Pattern , it is a better sign for EURUSD to fall .
Also, we can see the Regular Divergence(RD-) between Consecutive Peaks .
I expect EURUSD to decline to at least $1.169 AFTER breaking the lower line of the ascending channel .
Second Target: Support zone($1.1642-$1.158) and Monthly Pivot Point.
Note: Stop Loss(SL)= $1.1850
Please respect each other's ideas and express them politely if you agree or disagree.
Euro/U.S. Dollar Analyze (EURUSD), 4-hour time frame.
Be sure to follow the updated ideas.
Do not forget to put a Stop loss for your positions (For every position you want to open).
Please follow your strategy and updates; this is just my Idea, and I will gladly see your ideas in this post.
Please do not forget the ✅' like '✅ button 🙏😊 & Share it with your friends; thanks, and Trade safe.

SHORT EURNZDUpdate on eurnzd setup as i predicted it would sell. after breaking out of rising wedge, an opportunity presents itself to short targetting 1.00 fib level as tp 1. all the best

GBP/JPY SYMMETRICAL TRIANGLESYMMETRICAL TRIANGLE Completion: A potential breakout scenario for GBP/JPY involves the currency pair moving sharply out of a symmetrical triangle pattern. If the pair breaks above the upper trendline, it could signal a bullish move, with traders targeting higher resistance levels. Conversely, a break below the lower trendline may indicate a bearish trend, prompting a search for support levels.

Eurousd techinical analysis.Eurousd techinical analysis next move posibale at h1 time frame not finchinal advice.

eurusd sell tradeThe Relative Strength Index (RSI) is showing a downward trend, indicating weakening momentum. Additionally, the Moving Average Convergence Divergence (MACD) is showing a bearish crossover, further supporting the potential for a downward move

usdchf buy tradeThe Relative Strength Index (RSI) is showing an upward trend, indicating increasing momentum. Additionally, the Moving Average Convergence Divergence (MACD) is showing a bullish crossover, further supporting the potential for an upward move
GBPCHFGBPCHF price is near the main support zone 1.07101-1.06714. If the price cannot break through the 1.06714 level, it is expected that the price will rebound. Consider buying the red zone.
🔥Trading futures, forex, CFDs and stocks carries a risk of loss.
Please consider carefully whether such trading is suitable for you.
>>GooD Luck 😊
❤️ Like and subscribe to never miss a new idea!

CHECK GBPJPY SIGNAL UPDATE GO READ CAPTAINEntry Point: Around 198.650 TO 198.550
Take Profit 1: 199.050
Take Profit 2: 199.500
Last Target: 199.900
Stop Loss: 198.050

GBPCAD: Growth & Bullish Continuation
The price of GBPCAD will most likely increase soon enough, due to the demand beginning to exceed supply which we can see by looking at the chart of the pair.
Disclosure: I am part of Trade Nation's Influencer program and receive a monthly fee for using their TradingView charts in my analysis.
❤️ Please, support our work with like & comment! ❤️
