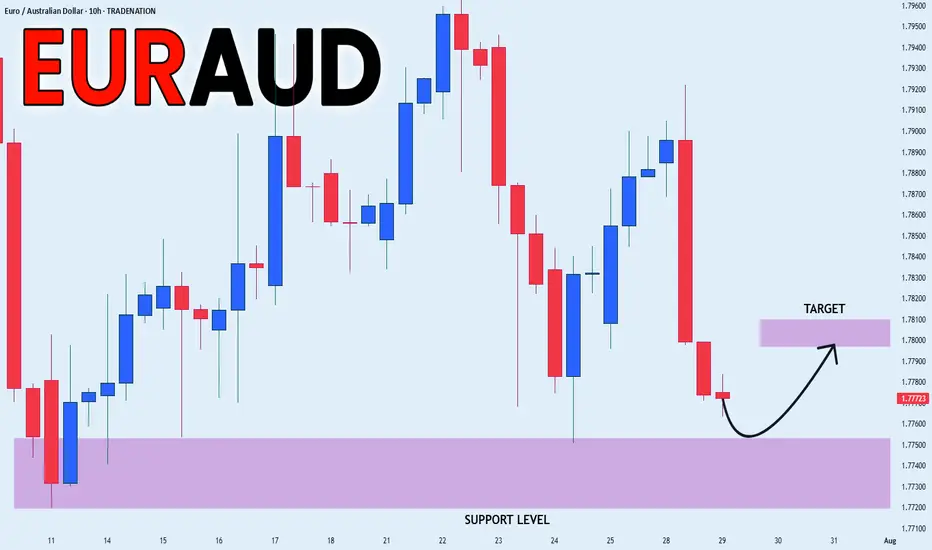
EUR_AUD LOCAL GROWTH AHEAD|LONG|
✅EUR_AUD will soon retest a key support level of 1.7750
So I think that the pair will make a rebound
And go up to retest the supply level above at 1.7800
LONG🚀
✅Like and subscribe to never miss a new idea!✅
Disclosure: I am part of Trade Nation's Influencer program and receive a monthly fee for using their TradingView charts in my analysis.
Forex market
GBP/USD Outlook Analyse TechniqueThe daily structure remains bullish, but price is currently retracing deeper, likely targeting unfilled areas
On the 4H timeframe, price has:
Formed a valid demand zone
Left an imbalance just above that demand
Engineered liquidity below the zone, increasing the probability of a sweep
📍 Strategy:
Wait for price to mitigate the 4H demand zone and sweep the liquidity beneath
Then, drop to lower timeframes (M5–M15 for the confirmation entry FX:GBPUSD ) and look for:
CHoCH (Change of Character)
Internal BOS
Bullish order flow for a safe entry

EUR-NZD Will Grow! Buy!
Hello,Traders!
EUR-NZD keeps falling
Down and we are bearish
Biased mid-term but there is
A horizontal support level
Below at 1.9370 so after
The retest we might expect
A local bullish correction
Buy!
Comment and subscribe to help us grow!
Check out other forecasts below too!
Disclosure: I am part of Trade Nation's Influencer program and receive a monthly fee for using their TradingView charts in my analysis.

GBP_CAD RISKY SETUP|LONG|
✅GBP_CAD is going down to retest
A horizontal support of 1.8320
Which makes me locally bullish biased
And I think that we will see a rebound
And a move up from the level
Towards the target above at 1.8380
LONG🚀
✅Like and subscribe to never miss a new idea!✅
Disclosure: I am part of Trade Nation's Influencer program and receive a monthly fee for using their TradingView charts in my analysis.

GBPUSD SELLIs trading not beautiful? I hope we can say that both in our wins and losses. Back to business, this is just a continuation of the sells.
As you can see, major support has been broken on the H4 chart, and a retest is incoming. A complete retest would be room for an entry to the next low—best of luck guys.

AUD-NZD Rebound Ahead! Buy!
Hello,Traders!
AUD-NZD made a retest
Of the wide horizontal support
Level again at 1.0909 and we
Are already seeing a bullish
Reaction so a local bullish
Rebound can be expected
Buy!
Comment and subscribe to help us grow!
Check out other forecasts below too!
Disclosure: I am part of Trade Nation's Influencer program and receive a monthly fee for using their TradingView charts in my analysis.

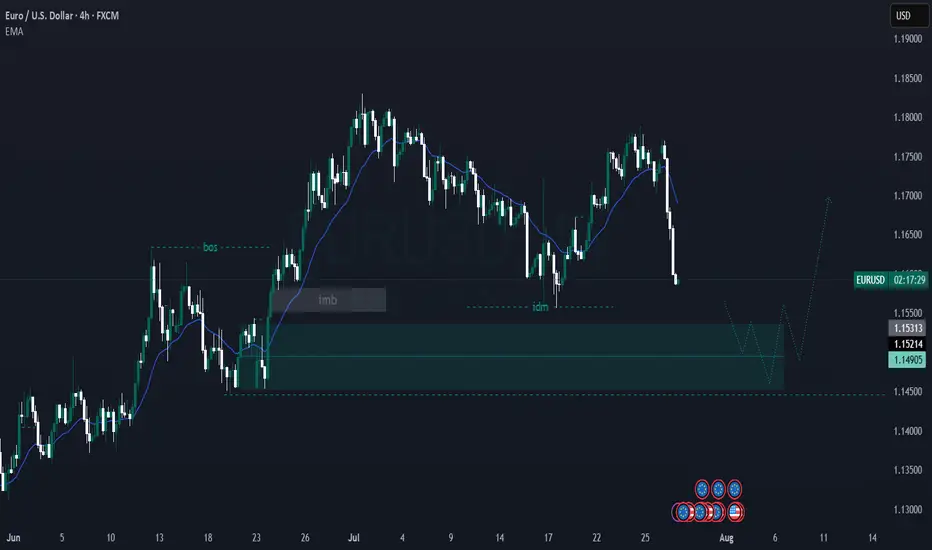
EUR/USD – 4H Technical Analysis AnticipatingPrice is currently in a bullish structure, printing consecutive Breaks of Structure (BOS) to the upside, confirming strong bullish momentum FX:EURUSD FX:EURUSD
On the 4H timeframe, price has:
Left behind an imbalance, signaling inefficiency in price delivery
Formed an unmitigated demand zone (internal OB) that aligns with bullish order flow
We now wait for price to return to this zone for a potential mitigation
📍 Plan of Action:
Monitor the mitigation area
Drop down to the 15-minute timeframe
Look for LTF (lower timeframe) confirmation: CHoCH, BOS, and internal structure shift before entering
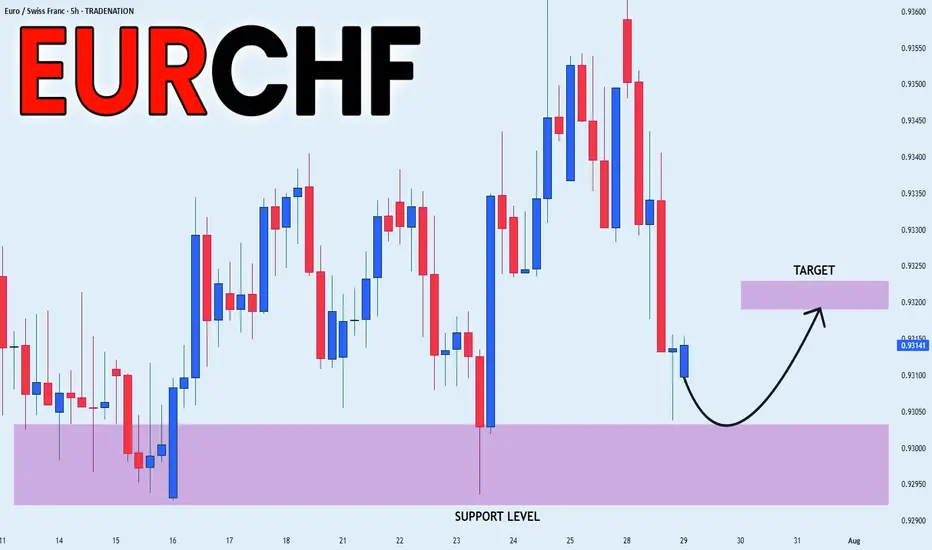
EUR_CHF RISKY LONG|
✅EUR_CHF is set to retest a
Strong support level below at 0.9300
After trading in a local downtrend for some time
Which makes a bullish rebound a likely scenario
With the target being a local resistance above at 0.9320
LONG🚀
✅Like and subscribe to never miss a new idea!✅
Disclosure: I am part of Trade Nation's Influencer program and receive a monthly fee for using their TradingView charts in my analysis.
NZDUSDT Long Looking to enter NZD/USD around 0.59250 at the Order Block due to a liquidity inducement zone and potential Market Structure Shift (MSS).

USD_CHF SHORT FROM RESISTANCE|
✅USD_CHF has been growing recently
And the pair seems locally overbought
So as the pair is approaching
A horizontal resistance of 0.8064
Price decline is to be expected
SHORT🔥
✅Like and subscribe to never miss a new idea!✅
Disclosure: I am part of Trade Nation's Influencer program and receive a monthly fee for using their TradingView charts in my analysis.

USD-JPY Is Overbought! Sell!
Hello,Traders!
USD-JPY is trading in a
Strong uptrend and the pair
Will soon hit a horizontal
Resistance of 149.200
So after the retest a
Local bearish pullback
Is to be expected
Sell!
Comment and subscribe to help us grow!
Check out other forecasts below too!
Disclosure: I am part of Trade Nation's Influencer program and receive a monthly fee for using their TradingView charts in my analysis.

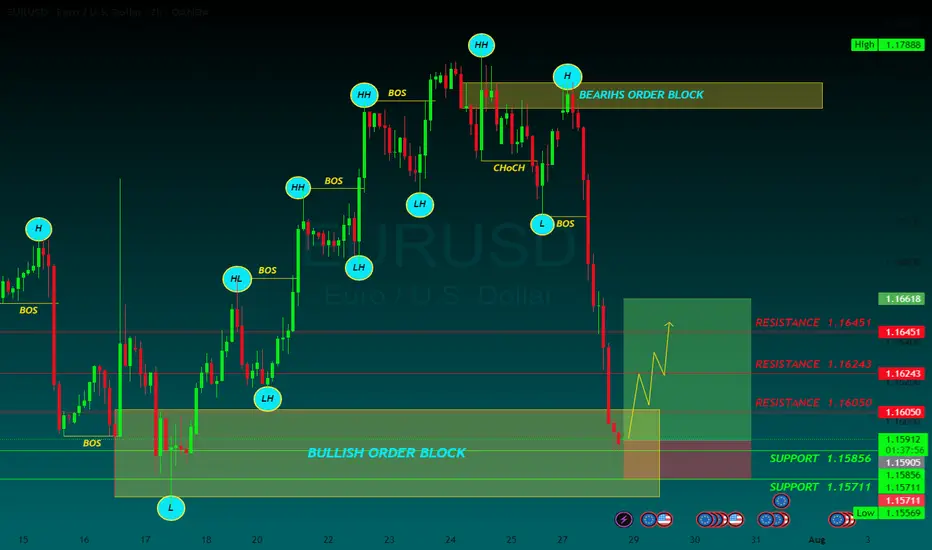
EURUSD BUYThe US Dollar (USD) gapped lower at the weekly opening amid optimism fueling demand for high-yielding assets, following news that the United States (US) and the European Union (EU) reached a trade deal.
The US and the EU agreed a 15% tariff on most European goods entering the US, much higher than the average 4.8% exporters face these days. No rates will apply to EU exports in important sectors, including aircraft parts, some chemicals, semiconductor equipment and some agricultural products.
The EU response to the headline was uneven. European Central Bank (ECB) policymaker Peter Kazimir said on Monday that the trade deal reduces uncertainty, but it is unclear for now how it impacts inflation. However, the French prime minister, François Bayrou, said the EU has capitulated to Donald Trump’s threats, adding it is a “dark day” for the EU. The trade focus now shifts to the US-China as officials from both countries resume talks in Stockholm.
The EUR/USD pair peaked at 1.1771 during Asian trading hours, but changed course early in Europe, with the USD surging across the FX board, resulting in the pair shedding over 100 pips.
The macroeconomic calendar had nothing relevant to offer at the beginning of the week, but will be flooded with first-tier releases, including US employment-related data ahead of the Nonfarm Payrolls report on Friday, the preliminary estimates of the Q2 Gross Domestic Product (GDP) for the US and the EU, and inflation updates. On top of that, the Federal Reserve (Fed) will announce its decision on monetary policy on Wednesday.
RESISTANCE 1.16050
RESISTANCE 1.16243
RESISTANCE 1.16451
SUPPORT 1.15856
SUPPORT 1.15711
Eurusd retraces1st target is low channel 1 line (1,1543).
Red line is magnet... (1,1684-92)
Oscilation between theese two lines....
Expect slow corrective pattern (>1.1610,1,16411,1692)

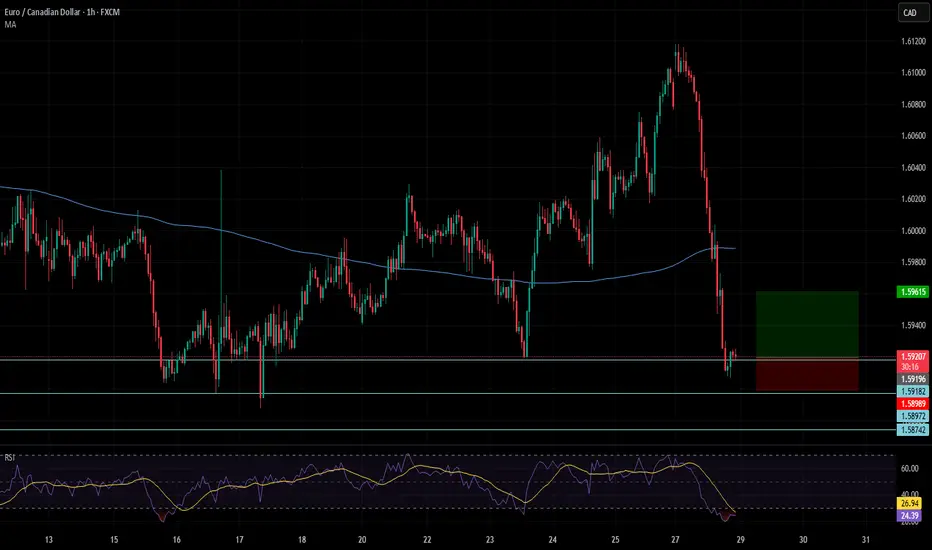
EURCAD 1H longEURCAD 1 H made a beatiful sharp drop, now stalling arround some good support levels.
When such a drop happens with no pullback formed yet I'm happy to buy the way down.
Because the pullback has to come soon buyers step in at the support levels.
My plan is simple I open a manual grid at the support levels I draw and aim for a 2R profit
Current grid 3 levels
1 market order
2 buy limits
Tp 2R
extra confirmation RSI is oversold
Countdown to Powell’s rate decision: What to watch WednesdayFederal Reserve Chair Jerome Powell is under mounting pressure from President Donald Trump to begin cutting interest rates.
Markets and analysts overwhelmingly expect the Fed to hold rates steady this Wednesday.
But what if the political heat is becoming too much to bear, and Powell and the Fed board advocate for a cut this week? Some Fed governors, Chris Waller and Michelle Bowman , have already signaled support for an early cut.
FX pairs to watch
USD/JPY:
This pair remains highly sensitive to yield differentials and broader risk sentiment. However, any hawkish resistance or emphasis on data dependency may keep the pair supported, especially if risk appetite holds.
EUR/USD:
The euro has shown relative strength in recent sessions, but the pair has been hit by the announcement of the trade deal struck between the EU and US. If the Fed clearly signals it's not ready to ease, the USD could regain even ground.
Should we place a sell limit or not?We can take a position based on the range strategy.
Note: When you have proper risk management, you can enter positions easily and with peace of mind.
Candle Close July 2025I made a post about a draw to sell side. Objective met today. unexpected for a Monday but all good. We could continue lower but it's likely we get a pull back or consolidation considering this is the last week of the month thus a candle close for July 2025. let's watch. I'm gonna stay out for the rest of the week. toodles

GBP_USD BEARISH BREAKOUT|SHORT|
✅GBP_USD is going down currently
As the pair broke the key structure level of 1.3380
Which is now a resistance, and after the pullback
And retest, I think the price will go further down
SHORT🔥
✅Like and subscribe to never miss a new idea!✅
Disclosure: I am part of Trade Nation's Influencer program and receive a monthly fee for using their TradingView charts in my analysis.

EUR-USD Support Ahead! Buy!
Hello,Traders!
EUR-USD is making a massive
Bearish correction and the pair
Is already locally oversold
So after it hits a horizontal
Support level below at 1.1568
We will be expecting a local
Bullish rebound
Buy!
Comment and subscribe to help us grow!
Check out other forecasts below too!
Disclosure: I am part of Trade Nation's Influencer program and receive a monthly fee for using their TradingView charts in my analysis.

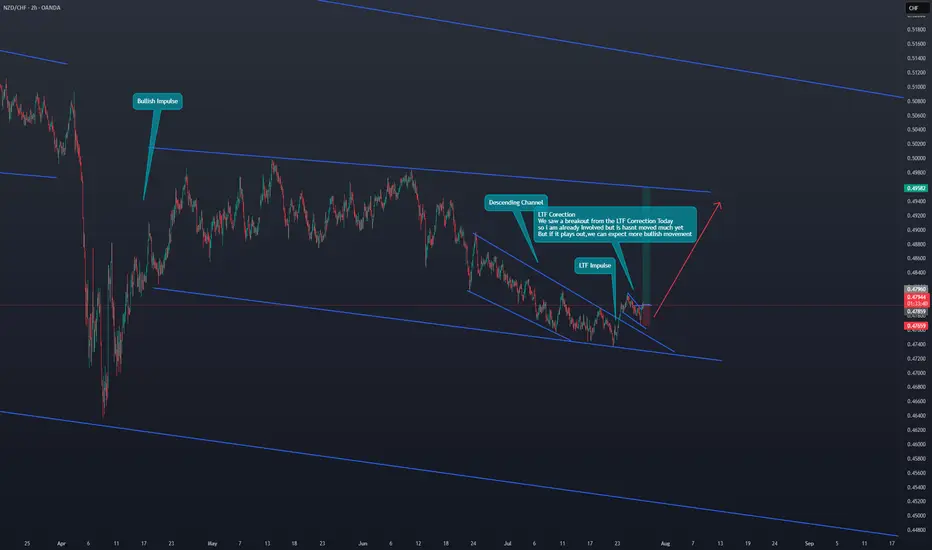
NZD/CHF Bullish move to expectWe saw a breakout from the LTF Correction Today
so i am already Involved but is hasnt moved much yet.
But if it plays out,we can expect more bullish movement

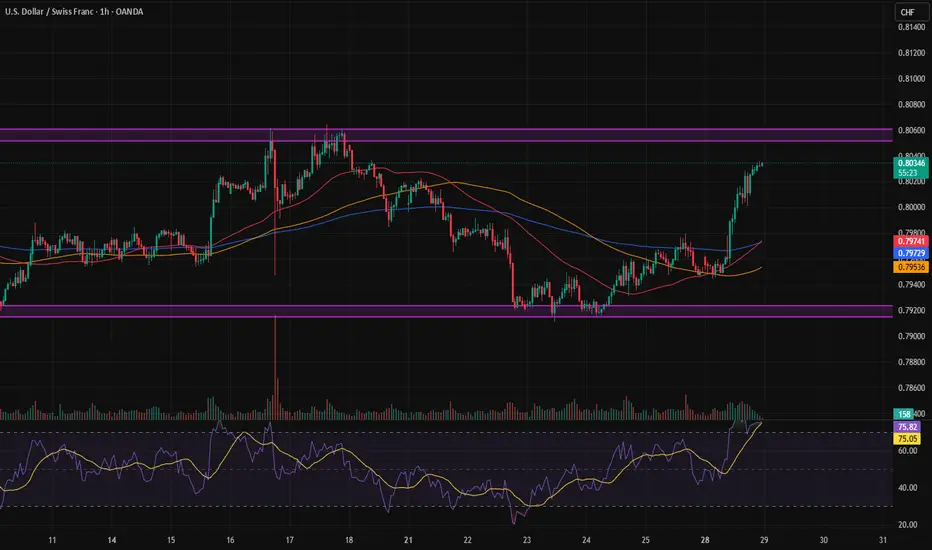
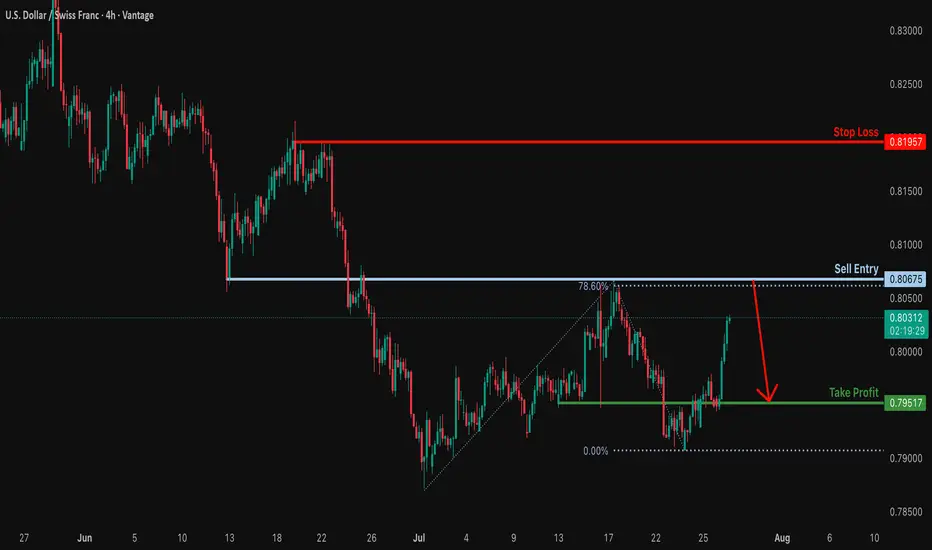
Heading into overlap resistance?The USD/CHF is rising towards the resistance level, which is an overlap resistance that aligns with the 78.6% Fibonacci projection and could potentially reverse from this level to our take-profit.
Entry: 0.8067
Why we like it:
There is an overlap resistance that aligns with the 78.6% Fibonacci projection.
Stop loss: 0.8195
Why we like it:
There is a swing high resistance.
Take profit: 0.7951
Why we like it:
There is a pullback support.
Enjoying your TradingView experience? Review us!
Please be advised that the information presented on TradingView is provided to Vantage (‘Vantage Global Limited’, ‘we’) by a third-party provider (‘Everest Fortune Group’). Please be reminded that you are solely responsible for the trading decisions on your account. There is a very high degree of risk involved in trading. Any information and/or content is intended entirely for research, educational and informational purposes only and does not constitute investment or consultation advice or investment strategy. The information is not tailored to the investment needs of any specific person and therefore does not involve a consideration of any of the investment objectives, financial situation or needs of any viewer that may receive it. Kindly also note that past performance is not a reliable indicator of future results. Actual results may differ materially from those anticipated in forward-looking or past performance statements. We assume no liability as to the accuracy or completeness of any of the information and/or content provided herein and the Company cannot be held responsible for any omission, mistake nor for any loss or damage including without limitation to any loss of profit which may arise from reliance on any information supplied by Everest Fortune Group.
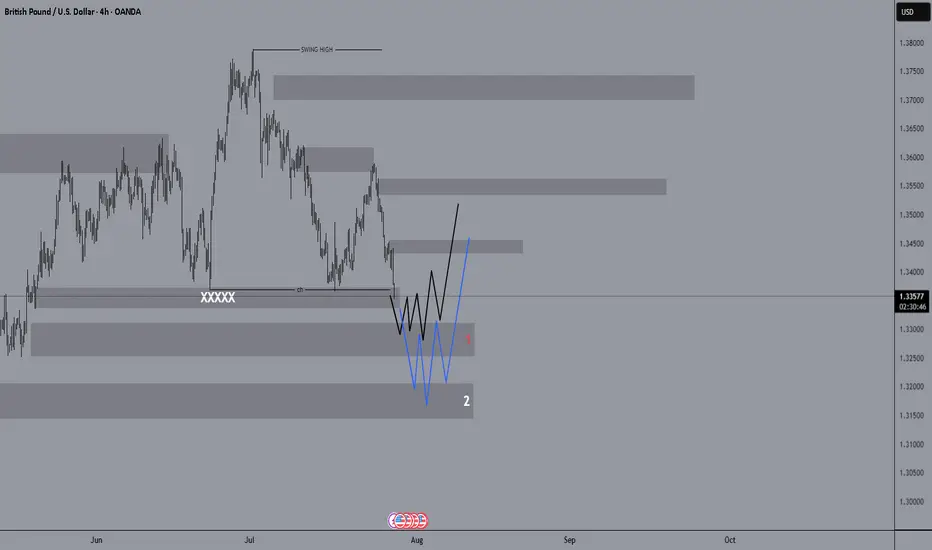
It could be a profitable deal.Hello friends, I hope you have started the week well.
I expect that after the corrections that have occurred, the price will make an upward move from areas 1 and 2, but this move is not a new ceiling because there is a possibility of a market reversal on the daily timeframe, but you should wait for the candles to close.
In the indicated areas, you can look for confirmation on lower timeframes to take a buy trade.
(You can name any currency pair you are interested in in the comments, and our team will share its opinion on that currency pair with you.)
Follow our page to see more analysis.