EURUSD H1 correction?My vision where go price on Elliot waves.
Now we on bullish trend but it can change to bearish.
Wave 5 is not finnish yet what will be next correction or we break zone 1.138-1.14 and price go upper.
Wave Indicator shows momentum slowing down, hinting at a potential reversal.
Price has peaked and is stalling around 1.13649, suggesting resistance.
Support/Resistance Levels
Resistance: 1.1380 region .
Support: Around 1.122, which is:
A key Fibonacci level.
Likely target for the end of wave C in the correction.
Fundamental Analysis
ECB monetary policy: If the ECB signals dovishness (rate cuts or economic concerns), EUR weakens.
Eurozone inflation: Higher inflation can support EUR via hawkish ECB tone.
German economic data: Weak data = EUR bearish.
U.S. Side (USD)
Federal Reserve policy: If Fed holds rates higher for longer, USD strengthens.
U.S. inflation, jobs data: Strong numbers support the dollar.
Forex market

EURNZD My Opinion! BUY!
My dear followers,
I analysed this chart on EURNZD and concluded the following:
The market is trading on 1.8990 pivot level.
Bias - Bullish
Technical Indicators: Both Super Trend & Pivot HL indicate a highly probable Bullish continuation.
Target - 1.9043
About Used Indicators:
A super-trend indicator is plotted on either above or below the closing price to signal a buy or sell. The indicator changes color, based on whether or not you should be buying. If the super-trend indicator moves below the closing price, the indicator turns green, and it signals an entry point or points to buy.
Disclosure: I am part of Trade Nation's Influencer program and receive a monthly fee for using their TradingView charts in my analysis.
———————————
WISH YOU ALL LUCK

CHECK EURJPY SIGNAL READ CAPTAIN (eurjpy) sell zone
(trade satup)
entry point (163.550) to (163.500) 📊
first target (163.300)
2nd target (162.950) 📊
last target (162.600) 📊
stop loss (163.800)❌

CHECK EURUSD SIGNAL AND READ CAPTION(eurusd) sell zone
(trade satup)
entry point (1.13470) to (1.13400) 📊
first target (1.13260)
2nd target (1.13080) 📊
last target (1.12800) 📊
stop loss (1.13650)❌

CHECK GBPJPY SIGNAL READ CAPTAIN(gbpjpy) sell zone
(trade satup)
entry point (194.500) to (194.400) 📊
first target (194.100)
2nd target (193.700) 📊
last target (193.300) 📊
stop loss (194.900)❌

Usdcad I had this position this morning we have a good counter trend trade is a high probability trade am on a buy too on usdcad

USDJPY LONG /// 1:1 RRHello. Im bullish on USDJPY. RR is 1:! for this trade. It should play in a day or few days. GL

EURCHF INTRADAY Bearish below 0.9430 The pair is in a bearish trend, with recent price action showing a bounce (oversold rally) that was rejected near 0.9430, a key resistance level from previous consolidation.
This rejection suggests sellers are still in control.
Key Levels to Watch:
Resistance: 0.9430 (key level), then 0.9500 and 0.9600 if broken.
Support: 0.9155, followed by 0.9100 and 0.9050.
Trading Outlook:
Bearish scenario: If price fails to break above 0.9430, expect a move lower toward 0.9300, with extended downside to 0.9200 and 0.9130 over time.
Bullish scenario: A daily close above 0.9430 would invalidate the bearish view and could lead to a move toward 0.9500 and possibly 0.9600.
Conclusion: EUR/CHF remains bearish unless price breaks and holds above 0.9430. Traders may look for short opportunities below resistance or switch to a bullish bias on a confirmed breakout.
This communication is for informational purposes only and should not be viewed as any form of recommendation as to a particular course of action or as investment advice. It is not intended as an offer or solicitation for the purchase or sale of any financial instrument or as an official confirmation of any transaction. Opinions, estimates and assumptions expressed herein are made as of the date of this communication and are subject to change without notice. This communication has been prepared based upon information, including market prices, data and other information, believed to be reliable; however, Trade Nation does not warrant its completeness or accuracy. All market prices and market data contained in or attached to this communication are indicative and subject to change without notice.

CHECK EURUSD SIGNAL READ CAPTAINeurusd signal technical analysis satup 👇🏼
(eurusd ) sell zone
( TRADE SATUP)
ENTRY POINT (1.13600) to (1.13550) 📊
FIRST TP (1.13350)
2ND TARGET (1.13100) 📊
LAST TARGET (1.12800) 📊
STOP LOOS (194.800)❌
FALLOW RISK MANAGMENT

EURUSD 30M CHART PATTERNThis EUR/USD 30-minute chart shows a bullish trade setup:
Entry point: Around 1.1347 (current market price).
Take profit: Near 1.1430.
Stop loss: Just below the recent low, around 1.1322.
The setup indicates a long position based on a bounce from an ascending trendline, suggesting potential bullish continuation. The risk-to-reward ratio looks favorable—roughly 1:2 or higher.
Let me know if you want an analysis of the setup (technical justification, indicators, news context), or help placing this trade.

The blue Monday signal update The market went as anticipated..but it takes years of practice to understand price action..you can not just trade with basic knowledge

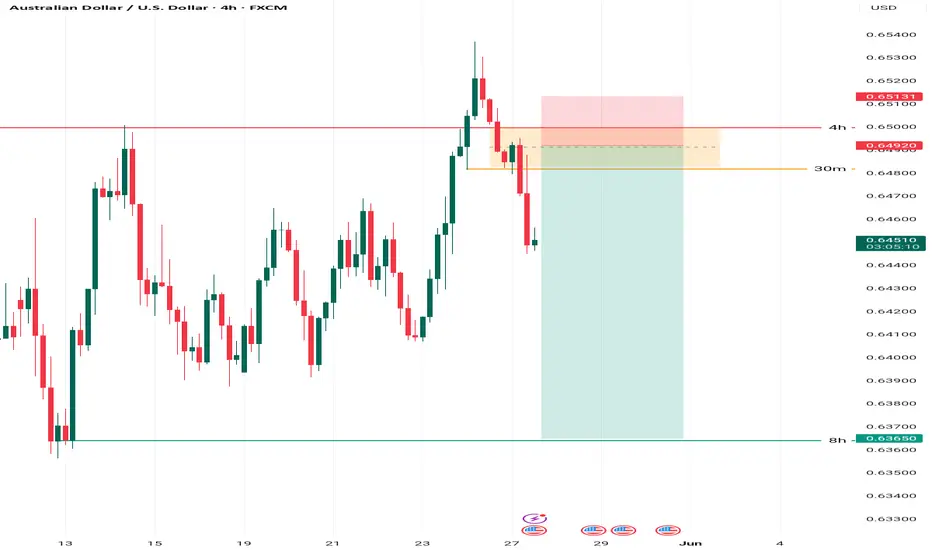
AUDUSD has experienced a failed breakout on the 4-hourConsidering the price's attempt to break the 4-hour resistance and its failure, along with confirmation of a decline on the 30-minute timeframe, we expect the price to drop to the 8-hour low.
The risk-to-reward ratio will be around 1:6. However, please ensure to maintain a 2% risk of your account balance and do not risk more than that. Always take responsibility for your trades.
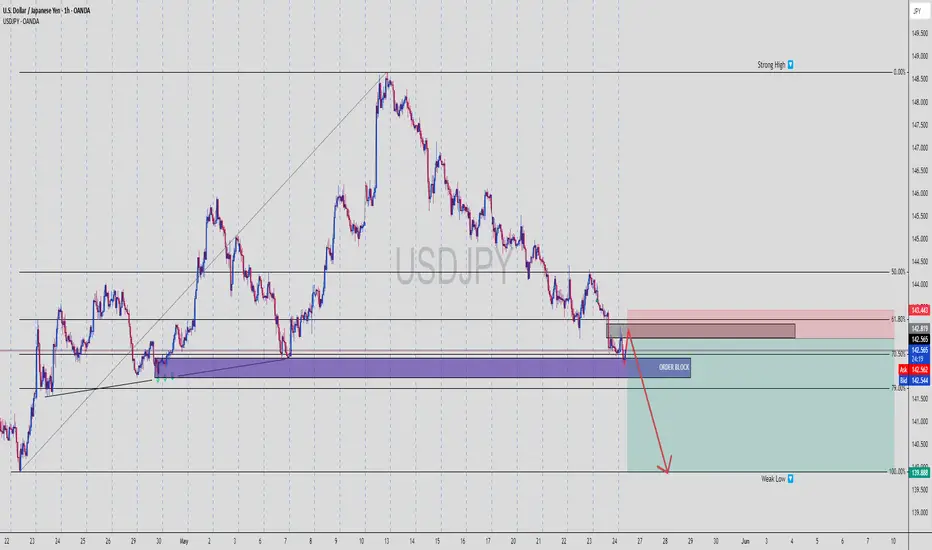
USDJPY | FVG + OB + Weak Low Target = Textbook SMC Setup📊 USDJPY | 1H Bearish Play – Smart Money In Control
We’re seeing a classic setup where price retraces into a bearish zone of confluence and prepares for a selloff toward internal liquidity. Check the breakdown:
🔻 1. Structure Shift Confirmed
Price broke structure on the downside after forming a lower high
Current move is a retracement into discount OB zone
Clear rejection is forming, signaling short momentum incoming
🟪 2. Zone Confluence
📌 Order Block (OB): Sitting just under the 61.8% Fib
📌 Fair Value Gap (FVG): Mitigated perfectly
📌 Fib Retracement: Price reacts between 61.8% and 70.5% — classic Smart Money play
📌 Previous Demand Turned Supply: This level is now acting as a rejection zone
This is stacked confluence — just how Smart Money likes to move.
💣 3. Entry Strategy
Entry Zone: 142.55 (midpoint of the OB reaction area)
Stop Loss: Above 143.443 (above OB + liquidity wick)
Take Profit: 139.888 (weak low, previous liquidity resting point)
⚖️ 4. Risk-to-Reward Ratio (RRR)
🎯 TP = 139.888
📍 Entry = 142.550
🔐 SL = 143.443
✅ RRR ≈ 1:3.5
A great example of high-probability short setup using pure Smart Money logic.
📉 5. Why This Works
Retail traders will try to long at this zone hoping for a breakout
Smart Money uses this zone to engineer liquidity
They tap into the FVG/OB, then target internal liquidity and weak lows
Clean, controlled sell-off expected down to 139.888
🧠 SMC Insights
This chart is all about liquidity engineering:
Push up into OB
Reject at premium pricing
Drive down to weak low to collect stops
Possibly reverse or continue trend from there
💬 Comment “FVG TAP + OB = 🔥” if you spotted this setup early
💾 Save it before the drop happens
📤 Share with a fellow SMC trader who needs this breakdown
USDJPY – Same Channel, Same PlanOur last short played out perfectly off this upper rail.
Price just tagged the trend-line again; structure and momentum haven’t changed
Bias: Sell the retest while the channel holds
Target: 142.30 (mid-channel support)
Invalidation: 143.80 close above the rail
If the ceiling cracks, we stand aside—otherwise I’m looking for another push to 142s.

USDCHF LONG FORECAST Q2 W22 D27 Y25👀 USDCHF LONG FORECAST Q2 W22 D27 Y25
Professional Risk Managers👋
Welcome back to another FRGNT chart update📈
Diving into some Forex setups using predominantly higher time frame order blocks alongside intraday confirmation & breaks of structure.
Let’s see what price action is telling us today! 🔥
💡Here are some trade confluences📝
✅Weekly order block rejection
✅Daily order block rejection
✅15’ order block
✅Intraday bullish breaks of structure
🔑 Remember, to participate in trading comes always with a degree of risk, therefore as professional risk managers it remains vital that we stick to our risk management plan as well as our trading strategies.
📈The rest, we leave to the balance of probabilities.
💡Fail to plan. Plan to fail.
🏆It has always been that simple.
❤️Good luck with your trading journey, I shall see you at the very top.
🎯Trade consistent, FRGNT X

Fundamental Market Analysis for May 27, 2025 USDJPYThe Japanese yen (JPY) is attracting fresh buyers in Tuesday's Asian session following the release of strong inflation data. Additionally, comments from Bank of Japan Governor Kazuo Ueda left the door open for further policy tightening by the central bank. This is in sharp contrast to expectations that the Federal Reserve (Fed) will continue to cut interest rates this year, and is proving to be a key factor that is providing a nice lift for the yen.
In addition, persistent geopolitical risks related to the protracted war between Russia and Ukraine and conflicts in the Middle East are contributing to the yen's safe haven status. The US dollar (USD), on the other hand, remains near its lowest level since April 22 amid concerns over the deteriorating US fiscal situation. This contributes to the USD/JPY pair's fall to 142.000, or more than a one-month low, and supports the prospects for further losses.
Trading recommendation: SELL 143.300, SL 143.900, TP 142.000

SNAP SHORT USDCAD SHORT FORECAST Q2 W22 D27 Y25🔥👀USDCAD SHORT FORECAST Q2 W22 D27 Y25
Professional Risk Managers👋
Welcome back to another FRGNT chart update📈
Diving into some Forex setups using predominantly higher time frame order blocks alongside confirmation breaks of structure.
💡Here are some trade confluences📝
✅4H Order block
✅4H 50 EMA
✅Intraday bearish breaks of structure
✅15’ order block identified
🔑 Remember, to participate in trading comes always with a degree of risk, therefore as professional risk managers it remains vital that we stick to our risk management plan as well as our trading strategies.
📈The rest, we leave to the balance of probabilities.
💡Fail to plan. Plan to fail.
🏆It has always been that simple.
❤️Good luck with your trading journey, I shall see you at the very top.
🎯Trade consistent, FRGNT X

EURUSD INTRADAY uptrend supported at 1.1300Trend Overview:
EUR/USD continues to exhibit a bullish price structure, supported by a rising trendline and higher lows. Recent intraday action reflects a corrective pullback, suggesting a temporary pause within the broader uptrend.
Key Technical Levels:
Support: 1.1300 (primary), followed by 1.1235 and 1.1180
Resistance: 1.1430 (initial), then 1.1470 and 1.1500
Technical Outlook:
A pullback toward 1.1300, which coincides with the previous consolidation zone, may present a bullish continuation setup. A confirmed bounce from this level could open the path toward 1.1430, with 1.1470 and 1.1500 as potential longer-term targets.
However, a daily close below 1.1300 would indicate a breakdown of near-term bullish momentum. This scenario would increase the likelihood of a deeper correction toward 1.1235, and possibly 1.1180.
Conclusion:
The outlook for EUR/USD remains constructively bullish, contingent on the 1.1300 support holding. A bounce from this level would reinforce the uptrend. Conversely, a decisive break below 1.1300 would shift the short-term bias to bearish, suggesting further downside toward the 1.1200 area.
This communication is for informational purposes only and should not be viewed as any form of recommendation as to a particular course of action or as investment advice. It is not intended as an offer or solicitation for the purchase or sale of any financial instrument or as an official confirmation of any transaction. Opinions, estimates and assumptions expressed herein are made as of the date of this communication and are subject to change without notice. This communication has been prepared based upon information, including market prices, data and other information, believed to be reliable; however, Trade Nation does not warrant its completeness or accuracy. All market prices and market data contained in or attached to this communication are indicative and subject to change without notice.

GJ-Tue-27/05/25 TDA-4hFVG respected, possible upside continue!Analysis done directly on the chart
Follow for more, possible live trades update!
Consolidation, structure, breakout
Again
Consolidation, structure, breakout
Market is fractal, it repeats itself again
and again. But to understand it deeply,
it's not easy at all.
Not financial advice, DYOR.
Market Flow Strategy
Mister Y


EUR/USD Rejected From Major Supply – Is a Bigger Drop Brewing?EUR/USD is showing signs of distribution around the key supply zone at 1.14380. Price failed to break above twice, forming a possible lower high, signaling that smart money might be preparing for a deeper move down.
Key Levels to Watch:
Supply Zone: 1.14380 – heavy selling pressure
First Target: 1.08667 – strong historical support
Final Target: 1.03215 – major demand zone (watch for bullish reaction here)
Market Drivers:
Upcoming high-impact U.S. events (marked below the chart) could fuel a bearish reversal, especially if USD strength returns.
Possible Trade Setup:
Sell Entry: Below 1.13400 (confirmation after rejection)
SL: Above 1.14000
TP1: 1.08667
TP2: 1.03215
Bias:
Bearish – Unless we see a strong breakout above 1.144, sellers remain in control.
---
Is EUR/USD headed for a sharp drop, or will bulls defend the 1.13s?
Comment your setup and let’s discuss!
#EURUSD #ForexAnalysis #LuxAlgo #TechnicalAnalysis #SupplyAndDemand #ForexSignals #BearishBias #TradingView

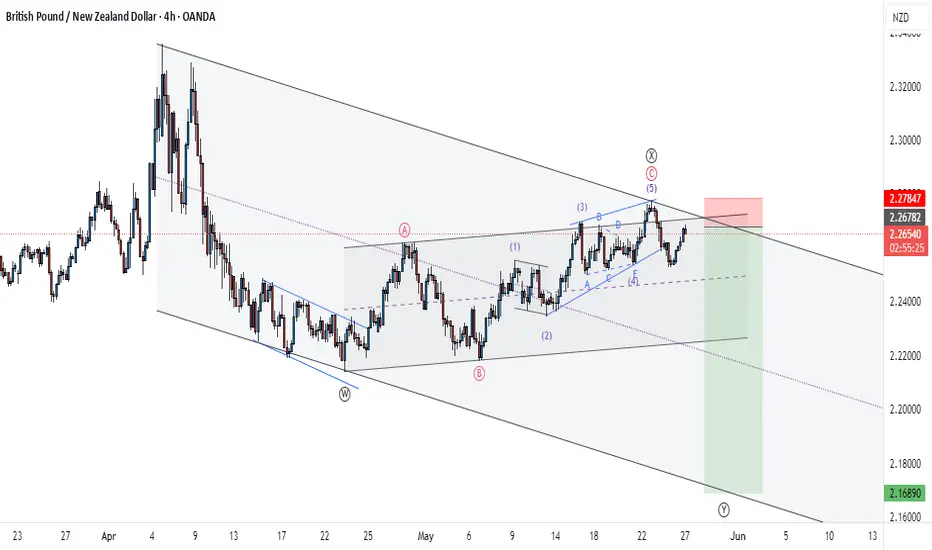
Potential BullsLooks like the market is on a correction phase and done with leg W and X, we`re now looking to complete with leg Y downstairs. It`s a famous pattern in the Elliott wave world.