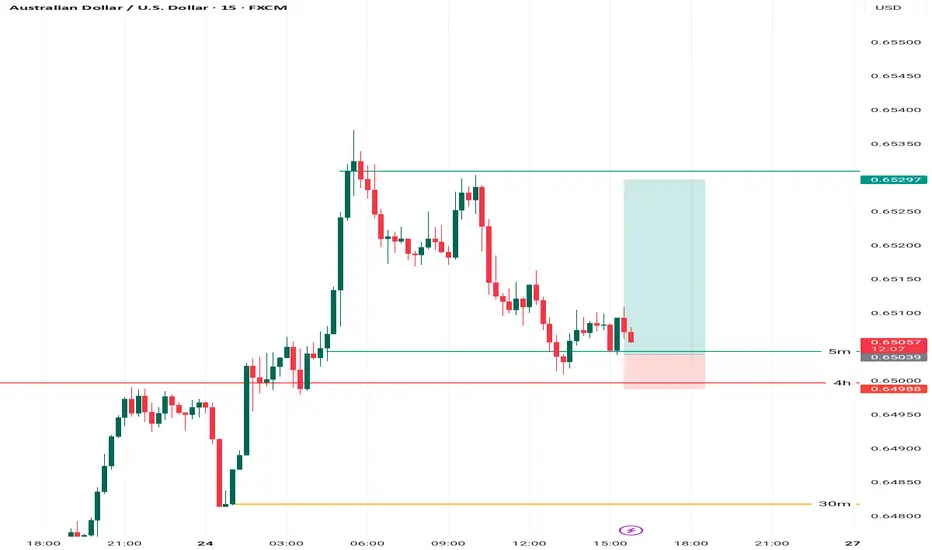
AUDUSD pullback on the m15AUDUSD - with a pullback on the M15 timeframe, and confirmation on the 1-minute timeframe, we expect it to rise to its previous high. This setup offers a very good risk/reward ratio of 1:5.
Please note in the description that you should not risk more than 2% of your account and take full responsibility for your trades."
Forex market
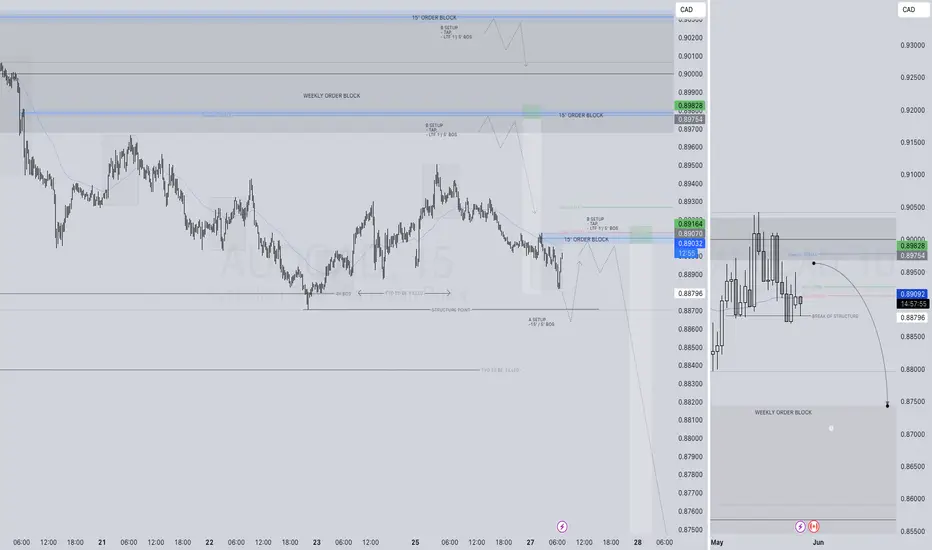
Qml Advanced liquidity....Same structure at the bottom is being generated again on the opposite side to push the price to the down side .

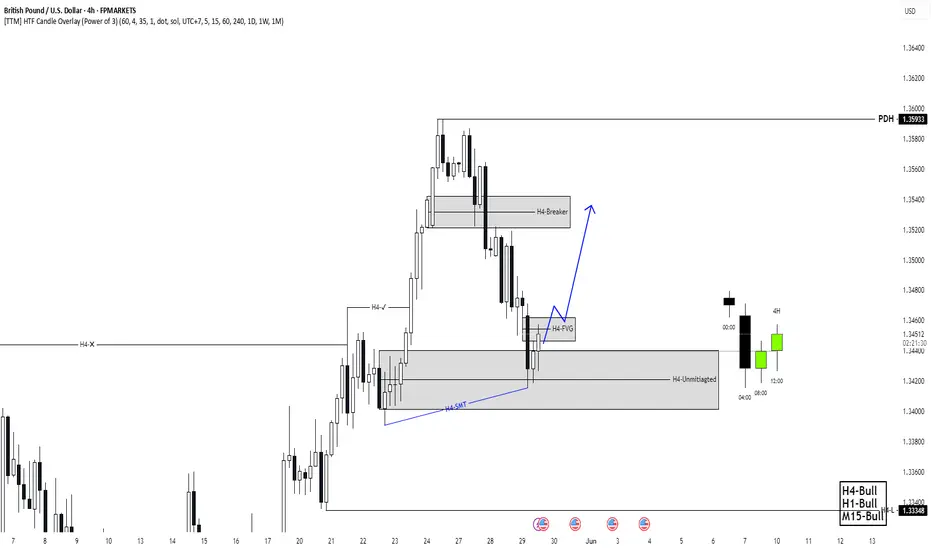
GBPUSD Trade IdeaThe GBPUSD pair is showing a strong bullish trend on the 4-hour chart. However, the price currently looks overextended. This suggests the market may be due for a corrective pullback.
I’m watching for a pullback into a discounted zone near the fair value gap.
If the price moves back into this zone, I’ll look for a bullish break of market structure as a signal to enter long.
This plan emphasizes patience and the importance of waiting for a favorable entry rather than chasing an extended move. As always, this is my personal strategy and not financial advice. Proper risk management and discretion are essential.

GBPNZD: A NICE OPPORTUNITY TO GO LONG HERE.I'm going long, there's been a sweep of the previous low indicating a grab of liquidity to the downside and a break of structure to the upside indicating a continuation of the bullish trend. Price has created an internal liquidity to take out early buyers while preparing for a take off to the upside.


GBPUSD TECHNICAL REVERSAL SHORT FORECAST Q2 W22 D27 Y25GBPUSD TECHNICAL REVERSAL SHORT FORECAST Q2 W22 D27 Y25
🔥👀TECHNICAL REVERSAL HOT PICK
Professional Risk Managers👋
Welcome back to another FRGNT chart update📈
Diving into some Forex setups using predominantly higher time frame order blocks alongside confirmation breaks of structure.
Let’s see what price action is telling us today!
💡Here are some trade confluences📝
✅Weekly order block
✅15' order block
✅Intraday bearish breaks of structure
✅Tokyo ranges to be filled
🔑 Remember, to participate in trading comes always with a degree of risk, therefore as professional risk managers it remains vital that we stick to our risk management plan as well as our trading strategies.
📈The rest, we leave to the balance of probabilities.
💡Fail to plan. Plan to fail.
🏆It has always been that simple.
❤️Good luck with your trading journey, I shall see you at the very top.
🎯Trade consistent, FRGNT X

Trendline liquidity Bos + fvg
After the market has taken out the trendline liquidity it will break with a long candle and most of the time it determines the direction of the market

GBPUSD sell after hit FVG 1.35618GBPUSD sell after hit FVG 1.35618 Going to fibretracemen buy again my strategy analysis is free for you😊

VALID POI'S AUDCAD SHORT FORECAST Q2 W22 D27 Y25🔥VALID POI'S AUDCAD SHORT FORECAST Q2 W22 D27 Y25
Professional Risk Managers👋
Welcome back to another FRGNT chart update📈
Diving into some Forex setups using predominantly higher time frame order blocks alongside intraday confirmation breaks of structure.
💡Here are some trade confluences📝
✅Weekly 50 EMA
✅Weekly order block rejection
✅Daily order block rejection
✅15’ order block identification
🔑 Remember, to participate in trading comes always with a degree of risk, therefore as professional risk managers it remains vital that we stick to our risk management plan as well as our trading strategies.
📈The rest, we leave to the balance of probabilities.
💡Fail to plan. Plan to fail.
🏆It has always been that simple.
❤️Good luck with your trading journey, I shall see you at the very top.
🎯Trade consistent, FRGNT X
EURJPY BUYAfter a downward movement price found support and bounced to the upside with impulse movement. after that the price created a correction and broke it. Therefore i expect the price move further to the upside.
Entry: 162.97
Tp: 164.49
Sl: 162.22
RR: 2:1
#forex #eurjpy #technicalanalysis

USDCHF | 21.05.2025BUY 0.82200 | STOP 0.81000 | TAKE 0.83800 | Constructively, the price of this pair is testing a local decline, but it is likely that the price will not be able to seriously consolidate under the level of 0.82000. Based on the chart indicators, a price reversal towards 0.83800 and further confident upward movement after correction near the medium-term lows of this year is likely.

EUR/AUD 8H Analysis - Bullish Breakout Brewing📍 Structure Shift
Price has broken out of a descending wedge, hinting at a bullish reversal after a prolonged downtrend. This pattern often signals a liquidity sweep followed by a rally — which aligns with current market behavior.
📍 Key Confluences
Bullish Liquidity Trendline respected with multiple touches and strong rejection candles.
Medium Demand Zone has been tested and held, showing signs of institutional accumulation.
71% Fibonacci Retracement from the most recent leg has been tagged and respected — prime zone for reversals.
Break above a medium resistance level now flipping into support.
📍 Volume Analysis
Spike in buying volume near the 71% fib and demand zone – another tick for bullish strength.
📍 Buy-Side Liquidity Above
Clean equal highs and unmitigated zones above. Market likely targeting these areas next.
📈 Bias: Strong Buy
As long as price holds above the broken wedge and the bullish trendline, EUR/AUD has strong potential to rally toward the buy-side liquidity zone marked at the top.
🎯 Next Target:
Liquidity sweep zone above highs
Then into the upper supply zone for reaction or reversal

STEAL THIS TRADE! GBP/JPY Long Setup(Thief Trader’s Secret Plan)💰 Thief Trader’s GBP/JPY Heist Alert – Stealthy Long Setup Loading!
🌍 Greetings, Profit Raiders!
Hola, Konnichiwa, Ni Hao, Privyet, Hallo, Bonjour!
📢 Attention Market Bandits & Chart Pirates—the GBP/JPY Beast is ripe for plunder! Time to execute the next Thief Trader Masterplan.
🎯 Entry Zone – Loot the Dip!
Current price = Open vault. Fire longs now or snipe pullbacks (15M/30M charts recent swing low level).
Pro Thief Move: Stack buy limits near swing lows/highs. Chart alerts = your secret weapon. 🔫
🛑 Stop Loss – Guard the Treasure!
Swing Thieves: Hide SL below 4H swing low (~190.000).
Day Raiders: Adjust SL to your risk size & order count. No free rides!
🎯 Profit Target – Escape with the Gold!
Take the 200.000 bag or exit early if momentum fades.
🔪 Scalpers vs. Swingers – Choose Your Weapon!
Scalpers (Quick Strikes): Longs only. No distractions.
Swing Traders (Patient Hunters): Trail stops & lock in gains.
🌪️ Market Pulse – Bullish Winds Blowing!
Price battling MA Resistance? No panic. Bulls still rule thanks to:
Fundamentals + Macro Trends
COT Data + Sentiment Shift
Quant Scores & Intermarket Alignments
(Check Linkss for the full heist blueprint.)
⚠️ News Trap Warning!
Upcoming high-impact events? Freeze trades or tighten stops. Trailing SL = your escape route.
🚨 Join the Thief Trading Crew!
Like 👍 or Boost 🚀 this idea to fuel our next raid.
Thief Trader Tactics = Daily Market Domination. Your support keeps the heists alive! 💰❤️
🤑 Stay Locked In – The Next Big Score is Coming…
Timing is everything. Watch the charts. Strike hard. Exit smarter.

$GBPUSD #IDEA#GBPUSD #IDEA BAse on higher TF is my bullish idea and i will wait until it from something in bullish in Smaller Tf for confirm my IDEA
GBP/JPY 4H Chart Analysis – Bullish Channel Setup📈 Trend:
Price is moving in an ascending channel
🔵 Support line below
🔴 Resistance line above
---
Key Zones & Levels:
📍 Demand Zone (Buy Area):
Between 191.753 – 194.016
Price might bounce here before continuing up
🔵 Likely pullback expected here
🎯 Target Point:
202.500
🚀 If price respects the demand zone, this is the upside target
🟢 Entry Point:
Around 193.964 – 194.016
Optimal buying zone before the projected rise
❌ Stop Loss:
Below 191.700
🛑 Placed to minimize losses if price breaks down
---
Indicators:
📉 EMA (70):
Currently at 192.816
✅ Acting as dynamic support
---
Trade Plan Summary:
🔄 Wait for a retracement into the Demand Zone
🛒 Enter long near 193.964
⛔ Stop loss at 191.700
🎯 Target at 202.500


HOT PICK OF THE DAY EURGBP SHORT FORECAST Q2 W22 D29 Y25🔥👀TECHNICAL HOT PICK OF THE DAY ALONGSIDE HTF 50 EMA
EURGBP SHORT FORECAST Q2 W22 D29 Y25
Professional Risk Managers👋
Welcome back to another FRGNT chart update📈
Diving into some Forex setups using predominantly higher time frame order blocks alongside confirmation breaks of structure.
Let’s see what price action is telling us today!
💡Here are some trade confluences📝
✅Weekly order block
✅15' order block
✅Intraday bearish breaks of structure
✅Tokyo ranges to be filled
🔑 Remember, to participate in trading comes always with a degree of risk, therefore as professional risk managers it remains vital that we stick to our risk management plan as well as our trading strategies.
📈The rest, we leave to the balance of probabilities.
💡Fail to plan. Plan to fail.
🏆It has always been that simple.
❤️Good luck with your trading journey, I shall see you at the very top.
🎯Trade consistent, FRGNT X

EUR/USD short: IEEPA; You're fired...Hello traders
I have been sitting on my hands since my last post. Thanks to @InternalTraderNYC to exercise patience. No trades, no harm. But keeping an eagle eye on the daily market chaos.
I know this may come across as "told you so" but whatever I post is always with the goal of bouncing ideas and insights off my fellow trading warriors.
I mentioned the IEEPA and the Court of International Trade as a reminder that there are legal avenues to contest the tariffs in this idea
I had been following any and all developments after the 14 state lawsuit that challenged the validity of using the IEEPA as a pretext to impose the tariffs.
Although I was dubious about any mechanism/court/legislation/congressional action that could moderate the tariffs, the Court of International Trade, based in Manhattan, NY has spoken.
The USD rallied as a result for, oh, so many reasons.
The FOMC interest rate is still the highest of the G7.
Trump's Big Beautiful Bill was already on thin ice with the House because it was predicated on increasing our insane national debt because "tariffs" would pay for the tax cuts for the 1%.
The bond market is already showing signs of US borrowing power becoming cheaper.
There is finally an adult in the room: The Court of International Trade.
Musk has officially departed the employ of the United States Government after criticizing Trump's Big Beautiful Bill. No one knows what happened behind closed doors but what we all know is that no one is allowed to contradict or criticize DJT...
At this point, I'll gloat. :)) I mentioned in one of my Ideas that Musk will be the first to depart the Trump inner circle. Only so much room for two of the biggest three narcissists on the planet. Yup, Putin is number 3.
The FOMC mentioned the "R" word in their minutes that were published today: Recession possibility stemming from trade policy.
Let's see what the US Senate does with this bill.
Stay tuned folks and watch the developments. This mess is far from over. It is all but guaranteed that this will head to the US Supreme Court.
As for trades, I am inserting a link to my previous Christmas Tree chart layout.
www.tradingview.com
The most important take away is that the 10Y T-bill is already cheaper for a higher yield.
Best of luck!!!

GBP/USD 30M CHART PATTERNThis chart for GBP/USD on the 30-minute timeframe shows a falling wedge pattern, which is typically a bullish reversal pattern. Here's a breakdown of what the chart suggests:
---
🔍 Technical Analysis Summary:
Pattern: Falling Wedge
Timeframe: 30 minutes
Current Price: ~1.34300
Support Zone: ~1.33709
Resistance/Target Zone: ~1.35940
---
🟢 Bullish Setup:
Entry Point: Around the breakout from the wedge (right where the price exits the wedge upwards).
Target (Take Profit): Near 1.35940 — the previous high and a logical resistance level.
Stop Loss: Slightly below the wedge’s lower boundary, around 1.33709 — protecting against a false breakout.
---
📈 Forecast:
If the price breaks above the wedge with volume, a bullish breakout is expected.
The blue projected line shows a likely path of higher highs and higher lows leading to the take profit zone.
The red trendline might act as new support after the breakout.
---
⚠ Risk Management Tips:
Use a risk/reward ratio of at least 1:2.
Watch for confirmation of the breakout (e.g., candle close above wedge and increased volume).
Be cautious of false breakouts during low-volume trading periods.
Would you like me to help write a trading plan or script based on this chart setup?

CONFLUENCE KEY GBPUSD SHORT FORECAST Q2 W22 D29 Y25GBPUSD SHORT FORECAST Q2 W22 D29 Y25
🔥👀QUICK SCOPE TECHNICAL REVERSAL HOT PICK
Professional Risk Managers👋
Welcome back to another FRGNT chart update📈
Diving into some Forex setups using predominantly higher time frame order blocks alongside confirmation breaks of structure.
Let’s see what price action is telling us today!
💡Here are some trade confluences📝
✅Weekly order block
✅15' order block
✅1 hour order block
✅Tokyo ranges to be filled
🔑 Remember, to participate in trading comes always with a degree of risk, therefore as professional risk managers it remains vital that we stick to our risk management plan as well as our trading strategies.
📈The rest, we leave to the balance of probabilities.
💡Fail to plan. Plan to fail.
🏆It has always been that simple.
❤️Good luck with your trading journey, I shall see you at the very top.
🎯Trade consistent, FRGNT X

What Is Naked Forex Trading, and How Do Traders Use It?What Is Naked Forex Trading, and How Do Traders Use It?
Traders rely on various tools and techniques to trade the forex market. Naked forex trading is one of the oldest and most popular trading approaches among currency traders. This article delves into the details of naked trading, providing insights into its implementation and distinguishing features that set it apart from other analysis techniques.
Understanding Naked Forex Trading
Naked trading is a trading style that involves analysing markets using a clean price chart, meaning one without technical indicators. Traders who use this method make decisions based on real-time price movements and their trading instincts.
Naked trading has its roots in the early days of trading, long before the advent of sophisticated technical analysis tools and indicators. Early traders relied solely on price action and market behaviour to make trading decisions. By stripping away the complexity of modern trading tools, naked trading aims to return to the fundamental principles of trading, emphasising the importance of understanding market psychology and price dynamics.
Core Principles of Naked Forex Trading
Naked forex trading is based on the following principles:
- Price action analysis is the foundation of naked trading, focusing on the examination of asset price movements without the help of technical indicators. Traders rely on bar, line, or Japanese candlestick charts to identify patterns, trends, and key support and resistance levels. By concentrating on real-time price movements, traders aim to make their trading decisions based on how prices behave at specific levels.
- Naked trading emphasises simplicity and clarity as it removes the clutter of numerous trading tools. This approach helps traders maintain a clear view of the market, making it potentially easier to identify trading opportunities. The simplification also reduces cognitive load, enabling traders to focus on the most critical market movements.
- Trader instinct, often referred to as "gut feeling" or "trader's intuition," plays a significant role in naked trading. This instinct is honed over time through experience and the extensive observation of price movements and market behaviour.
Key Techniques and Tools
Mastering price action analysis is crucial in naked trading. These are the four key tools for those who use naked trading.
Candlestick Patterns
Candlestick patterns play a crucial role in naked trading strategy by providing visual representations of price movements over a specified period. Traders look for different price formations to analyse potential market reversals, continuations, or indecisions. Common candlestick patterns include doji, engulfing patterns, hammer, shooting star, and spinning top. Each offers insights into market sentiment and potential future price movements.
Chart Patterns
Chart patterns on price charts indicate potential trend reversals or continuations. Traders using naked trading techniques rely on chart patterns like flags, rounding top/bottom, diamonds, and rectangles to identify key levels where the price is likely to react. These patterns help traders anticipate market movements and plan entry and exit points accordingly.
Support and Resistance Levels
Support and resistance levels are fundamental concepts in naked trading, representing levels the price struggled to break above (resistance) or hold above (support). Traders identify these levels on price charts to anticipate potential price reversals or breakouts. Support and resistance levels are crucial for setting profit targets, placing stop-loss orders, and managing risk.
Trendlines and Channels
Trendlines and channels are used by naked traders to visualise the direction and strength of a trend. Trendlines connect successive higher lows (uptrend) or lower highs (downtrend) on a price chart, helping traders identify trend reversals or confirm trend continuations. Channels are formed by drawing parallel lines to connect highs and lows, creating a channel in which the price typically moves.
Advantages of Naked Forex Trading
Naked trading has many advantages; therefore, it’s still used by traders around the globe. Here are the key benefits of naked forex trading:
- Enhanced Focus and Simplicity: This approach removes market clutter as it offers enhanced focus by eliminating complex technical indicators. Without the distraction of multiple indicators that provide lagging signals, traders may respond more effectively to changes in price movements.
- Improved Market Understanding: By relying on naked trading tools, traders may better understand market behaviour and psychology. Observing price action directly on charts potentially enhances traders' ability to interpret market sentiment, identify key support and resistance levels, and anticipate potential trend reversals or continuations. This hands-on approach fosters a deeper understanding of the nuances of the market and improves trading skills over time.
- Flexibility and Adaptability: Traders are not constrained by specific indicator signals or rigid trading rules. Instead, they can adjust their approach based on real-time price action and evolving market dynamics. This flexibility allows them to take advantage of emerging opportunities and adapt their strategies to potentially mitigate risks.
Challenges and Limitations
Although naked trading can be effective, it has limitations that a trader considers before relying on this approach.
- Learning Curve: As naked forex trading relies heavily on interpreting price action without the assistance of technical indicators, traders may need to dedicate considerable time and effort to mastering candlestick patterns, chart analysis, and understanding market psychology. Developing the skill to interpret price movements accurately demands persistence and consistent practice.
- Emotional Discipline: A notable challenge of naked trading is the absence of clear buy or sell signals provided by indicators, which can lead to heightened emotional responses to market fluctuations. Traders must maintain discipline by adhering to their trading plans, implementing risk management strategies, and avoiding impulsive decisions.
- Market Noise: Navigating market noise is another hurdle in naked trading. Market noise refers to random price fluctuations that obscure meaningful price patterns. Traders need the patience and experience to distinguish between significant price movements and temporary fluctuations.
Practical Application of Naked Forex Trading
Setting up a trading plan is essential for implementing naked forex trading. Traders might use the following rules:
- Define Your Trading Goals: Determine your financial objectives, risk tolerance, and period of trading.
- Select Currency Pairs: Choose currency pairs that align with your trading strategy and offer sufficient liquidity.
- Identify Key Trading Times: Determine optimal times to trade based on market volatility and your availability.
- Establish Entry and Exit Rules: Define criteria for entering trades based on price action signals, such as candlestick patterns or support/resistance levels. Similarly, rules for exiting trades should be established to potentially lock in returns or cut losses.
- Risk Management: Implement risk management strategies, including setting stop-loss orders and calculating position sizes based on your risk tolerance and account size.
- Review and Adapt: Regularly review your plan to assess its effectiveness and make necessary adjustments based on evolving market conditions and personal trading performance.
Real-Life Examples and Case Studies
Real-life examples and case studies illustrate how naked forex trading principles are applied in practice:
Example 1: Trading Support and Resistance
A trader identifies a currency pair approaching a key support level on the daily chart. They wait for a bullish reversal candlestick pattern, such as dragonfly doji, to form near the support level. They enter a long trade with a stop-loss below the support level and a profit target at the next resistance level.
Example 2: Trend Confirmation
A trader observes a currency pair in a strong downtrend on the hourly chart. They wait for a pullback to a trendline and look for a bearish engulfing pattern to confirm the continuation of the downtrend. They enter a sell trade with a tight stop-loss above the trendline. However, it is difficult to determine the profit target as there are no swing lows nearby.
The Bottom Line
When they understand the naked trading forex strategy, traders may use it in other markets, including stocks and cryptocurrencies*. However, it's important to note that any analysis does not guarantee effective trading, and other factors should be considered alongside chart analysis. Risk management and a proper mindset are essential for long-term consistency.
FAQs
What Is Naked Trading in Forex?
Naked, or price action trading, is a forex trading approach that involves analysing the market using a clean price chart without any technical indicators. Traders relying on this method make decisions based on real-time price movements and their trading instincts rather than past performance. The strategy emphasises identifying key support and resistance levels, trend reversals, and price corrections purely through the observation of bar, line, or candlestick charts.
Can I Trade Without Chart Patterns?
Yes, trading without chart patterns may be possible using alternative methods such as indicator-based strategies, quantitative models, fundamental analysis, or sentiment analysis. These approaches allow traders to analyse the markets based on technical indicators, mathematical algorithms, economic data, or market sentiment.
What Is a Chart Pattern in a Price Action Strategy?
A chart pattern in a price action strategy refers to the specific formations and shapes created by the price movements of an asset, which traders use to analyse future market behaviour. These patterns emerge due to the collective actions of buyers and sellers and can indicate potential trend reversals or continuations. Some common chart patterns include triangles suggesting a consolidation before a breakout, Quasimodo indicating a potential trend reversal, and flags signalling the continuation of an existing trend.
What Is the 5-3-1 Trading Strategy?
The 5-3-1 trading strategy is a disciplined approach designed to help traders focus and improve their trading skills. It involves trading just five currency pairs to reduce complexity and enhance expertise in those markets. Traders then use only three specific strategies to master and consistently apply. Finally, they select one trading timeframe to maintain consistency and avoid confusion.
*Important: At FXOpen UK, Cryptocurrency trading via CFDs is only available to our Professional clients. They are not available for trading by Retail clients. To find out more information about how this may affect you, please get in touch with our team.
This article represents the opinion of the Companies operating under the FXOpen brand only. It is not to be construed as an offer, solicitation, or recommendation with respect to products and services provided by the Companies operating under the FXOpen brand, nor is it to be considered financial advice.

POI = LIQUIDITY AUDCAD SHORT FORECAST Q2 W22 D29 Y25
AUDCAD SHORT FORECAST Q2 W22 D29 Y25
POI = LIQUIDITY = Let's print money!
Professional Risk Managers👋
Welcome back to another FRGNT chart update📈
Diving into some Forex setups using predominantly higher time frame order blocks alongside intraday confirmation breaks of structure.
💡Here are some trade confluences📝
✅Weekly 50 EMA
✅Weekly order block rejection
✅Daily order block rejection
✅15’ order block identification
🔑 Remember, to participate in trading comes always with a degree of risk, therefore as professional risk managers it remains vital that we stick to our risk management plan as well as our trading strategies.
📈The rest, we leave to the balance of probabilities.
💡Fail to plan. Plan to fail.
🏆It has always been that simple.
❤️Good luck with your trading journey, I shall see you at the very top.
🎯Trade consistent, FRGNT X

AWAIT BOS FIRST!! USDCAD SHORT FORECAST Q2 W22 D29 Y25
🔥👀USDCAD SHORT FORECAST Q2 W22 D29 Y25
Professional Risk Managers👋
Welcome back to another FRGNT chart update📈
Diving into some Forex setups using predominantly higher time frame order blocks alongside confirmation breaks of structure.
💡Here are some trade confluences📝
✅Daily Order block
✅HTF 50 EMA
✅Intraday bearish breaks of structure to be identified
✅15’ order block identified
🔑 Remember, to participate in trading comes always with a degree of risk, therefore as professional risk managers it remains vital that we stick to our risk management plan as well as our trading strategies.
📈The rest, we leave to the balance of probabilities.
💡Fail to plan. Plan to fail.
🏆It has always been that simple.
❤️Good luck with your trading journey, I shall see you at the very top.
🎯Trade consistent, FRGNT X
