Best Practice: Prepare, Assess, Plan Then TradeTraders are often eager to jump straight into the next trading session but this may not always be the best option to chose. It can be more beneficial to follow a regular pre-trading routine to note down important scheduled events, establish current trends, as well as meaningful support and resistance price levels, and importantly this doesn’t have to be time consuming.
This is not meant to be that trading ‘holy grail’ but more of an addition to your existing trading process or plan. Having a regular routine to establish important levels, indicator set-ups and price trends to be aware of during your trading day may help you make trading decisions in a more effective way.
This pre trading routine can also be helpful for traders that take longer term positions, as it’s still important to consider the longer-term weekly perspectives as well.
This routine can be carried out at the weekend and then monitored and, where necessary, modified during the week as price action develops for the particular CFD(s) you are trading.
1. Keep Informed of Important Data Releases
If there are several CFD’s you regularly trade and tend to stick with, make sure you have as much information about those assets as possible before you start trading.
Consider utilising the Pepperstone trading calendar to help keep you informed of any economic releases/company earnings data that might impact the CFD you are trading before the week/session starts.
Once you know the scheduled events ahead, you can ask yourself,
Could these impact my trading?
Could the market reaction to this new information increase the volatility of the CFD I am about to trade or already have a position in?
How may this impact my risk?
Knowing what it is expected by the market before a particular important economic data release, such as US Non-farm Payrolls, can help you assess positioning going into the release, gauge market reaction to the data, and then be prepared for any potential price sentiment change and/or increased volatility.
2. Be Aware of Potential Support and Resistance Levels
Ahead of your trading day, consider running through the Pepperstone charts of the CFD’s you are considering trading and make a note of 3 support and resistance levels, that you identify as being meaningful. To help you we have set out an example Trading Template below.
Daily: Level: Reason: Current Trend: Current Thoughts:
Support
1st:
2nd:
3rd
Resistance
1st
2nd
3rd
Keep this next to your trading screen, so you are aware of particular levels that may act as support and resistance, if prices move in that direction. This can help you to improve trade entry or assist you with the placement of a stop loss or take profit order.
If these levels are broken at any time, you can update the template with any new support/resistance levels during the trading period.
3. Be Aware of the Daily Trends – Focus on Bollinger Bands
Using the direction of the daily Bollinger mid-average can be helpful to gauge the direction of the daily trend.
If the,
Mid-average is moving up = price uptrend
Mid-average is moving down = price downtrend
Mid-average is flat = possible price sideways range
The daily and weekly perspectives are the most important to be aware of, so it can be beneficial to analyse the charts from the longest timeframe into the shortest as this allows you to build a better understanding of the dominant trends.
You can also note these trends on the Trading Template, so it’s available to you when you are trading.
4. Follow the Same Process for All Other Timeframes - 4 Hour, 1 Hour, Even Shorter if it Suits Your Trading.
You can carry out the routine outlined in point 3, for any timeframes you are trading.
Things to note,
Are there any new trends suggested within a shorter term perspective by the Bollinger mid-average?
If the direction of a shorter term mid-average has changed, it may be an indication of either a change or resumption of a longer term price trend.
If this trend change also looks to be resuming within the longer term perspectives, this could be a more important signal, as the resumption of an existing longer term trend may mean a more extended move in that direction.
Be aware, confirmation of a price trend change within a longer term perspective might mean it could take longer and offer less trading opportunities, as initially price moves may be less aggressive in nature.
5. Where, Within the Various Timeframes is Price in Relation to the Bollinger Bands?
As we have highlighted in a previous commentary (please take a look our past posts), Bollinger Bands can highlight increasing price volatility within a trend.
Things to note regarding Bollinger Bands,
Are the upper or lower bands being touched by prices within any of the timeframes?
Within a sideways range (flat mid-average) this might suggest price has reached either a support or resistance level, with potential for a reversal.
While being touched, are the upper and lower bands starting to widen which indicates increasing price volatility, or contract, which indicates decreasing price volatility?
Remember - widening bands within a confirmed trend highlight increasing volatility, suggesting the current price move might continue for longer than you may anticipate, while contracting bands, point to decreasing volatility, which may lead to a reduction in a particular CFDs price movement.
Do the timeframes align?
If they do it may suggest a stronger trading opportunity is evident. CFDs within trending markets seeing increasing volatility tend to offer greater potential than those that aren’t.
In this scenario it maybe worthwhile considering only trading with the trend, not trying to pick bottoms or tops of markets, or if you do, consider a more cautious approach to your trading by reducing the size of your position and risk.
The material provided here has not been prepared in accordance with legal requirements designed to promote the independence of investment research and as such is considered to be a marketing communication. Whilst it is not subject to any prohibition on dealing ahead of the dissemination of investment research, we will not seek to take any advantage before providing it to our clients.
Pepperstone doesn’t represent that the material provided here is accurate, current or complete, and therefore shouldn’t be relied upon as such. The information, whether from a third party or not, isn’t to be considered as a recommendation; or an offer to buy or sell; or the solicitation of an offer to buy or sell any security, financial product or instrument; or to participate in any particular trading strategy. It does not take into account readers’ financial situation or investment objectives. We advise any readers of this content to seek their own advice. Without the approval of Pepperstone, reproduction or redistribution of this information isn’t permitted.
Forex market

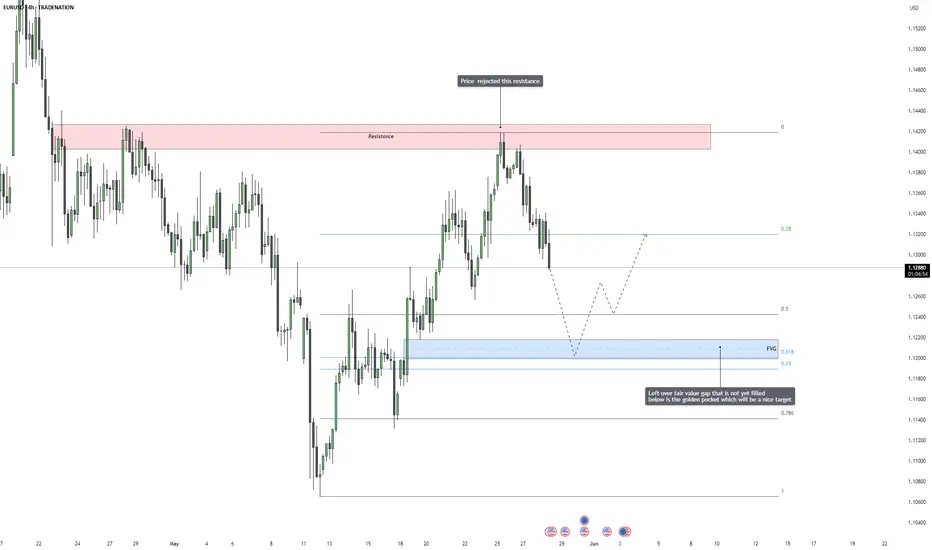
EURUSD – Bearish Reversal in Motion, Fair Value Gap Draws Price EURUSD has recently reacted strongly to a major resistance zone, where price previously stalled and reversed in the past. After running into this area again, we saw a sharp and immediate rejection, which confirms the presence of aggressive selling pressure. This rejection was not just a weak pullback, but a strong displacement candle that shows real intent from institutional participants.
This kind of price action is typically a sign that the market has found a short-term top, and will now look to rebalance lower, especially if there are inefficiencies left behind during the last move up. With the rejection now confirmed and price starting to rotate lower, the odds increase that we see a deeper retracement in the coming sessions.
Resistance Reaction and Liquidity Story
The price reached into a well-defined supply area and rejected cleanly. This level was likely filled with buy-side liquidity from breakout traders and late longs, which institutions needed in order to fill their sell orders. After sweeping above the previous highs and triggering breakout entries, price snapped back below, creating a shift in short-term structure.
That move also created a market imbalance, a price inefficiency that the market tends to come back and correct. With bullish liquidity absorbed at the highs, price is now looking for sell-side liquidity, which can typically be found below the previous higher lows and inside unfilled value areas.
Fair Value Gap and Fibonacci Confluence
Below the current market, we have a clean fair value gap that was left behind during the most recent impulsive bullish move. What makes this area even more attractive is that it overlaps perfectly with the golden pocket zone, the 0.618 to 0.65 Fibonacci retracement level. This confluence creates a high-probability target area, not just because of the imbalance, but also because this level acts as a common retracement zone where institutional traders often look to reaccumulate or exit short-term positions.
This area is also likely to hold resting liquidity from traders who placed stop losses under recent higher lows. All these factors combined make the fair value gap plus golden pocket area a natural draw for price, the market tends to gravitate toward these zones when there’s unfinished business left behind.
Expectations and Potential Development
Going forward, I expect price to continue bleeding lower in a controlled fashion, possibly forming minor lower highs along the way. Once the fair value gap is reached and filled, we could see signs of support or accumulation, depending on the context at the time. It’s important not to blindly long from that area, but instead wait for a market reaction, ideally a shift in structure on the lower timeframes, to signal that buyers are stepping back in.
If the market holds that area and confirms support, it could launch a new leg higher. However, if the fair value gap fails and price continues to break down, it would signal that this move is not just a retracement but possibly the start of a larger bearish leg.
Conclusion
The rejection from resistance has opened the door for a deeper retracement. With a clear fair value gap and Fibonacci golden pocket below, the market now has a logical destination to correct toward. This level offers a clean narrative for continuation lower, and it aligns with both price action structure and algorithmic models. Patience is key now, the best opportunities come when price delivers into clean zones like this one.
Disclosure: I am part of Trade Nation's Influencer program and receive a monthly fee for using their TradingView charts in my analysis.
___________________________________
Thanks for your support!
If you found this idea helpful or learned something new, drop a like 👍 and leave a comment, I’d love to hear your thoughts! 🚀
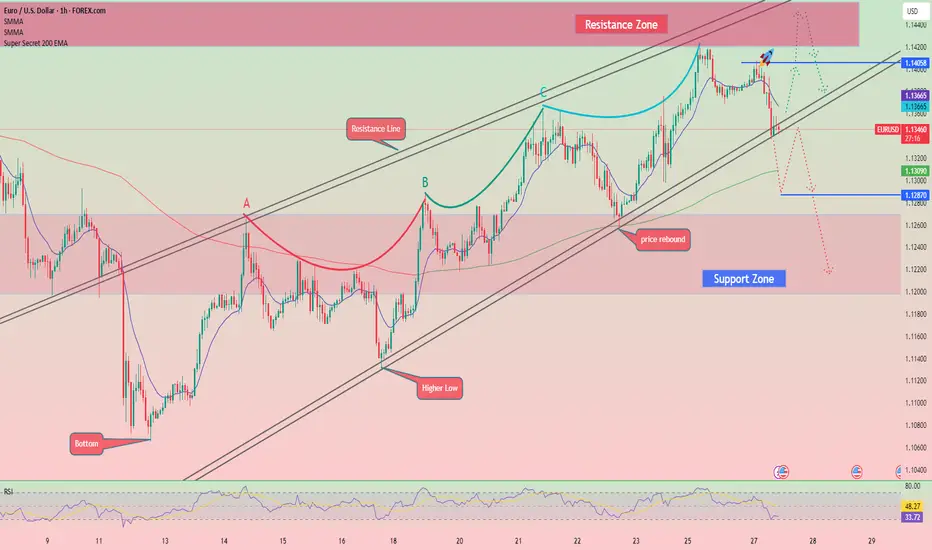
EURO - Price can rise a little and then start to declineHi guys, this is my overview for EURUSD, feel free to check it and write your feedback in comments👊
Some time ago, price entered a falling channel, where it broke through $1.1310 level at once, but soon broke it again.
Price traded near this level for some time, after which it reached resistance line and continued to decline.
Then price broke $1.1310 level and dropped to $1.1065 level, after which it turned around and started to grow within the channel.
In the rising channel, Euro broke $1.1140 level and continued to grow, but later made a correction to this level.
After this, price continued to grow and later broke $1.1310 level, then rose to the resistance line of the channel.
I expect that Euro will rise to resistance line and then start to decline to the $1.1310 support level.
If this post is useful to you, you can support me with like/boost and advice in comments❤️
Disclaimer: As part of ThinkMarkets’ Influencer Program, I am sponsored to share and publish their charts in my analysis.

GBP/USD Ready to Explode or Collapse? All Eyes on 1.3600British Pound (CFTC - CME)
Commercial traders increased their long positions by +1,839 contracts and short positions by +3,597. Net exposure remains negative, but the significant short increase suggests active hedging and risk management.
Non-Commercial traders (speculators) reduced their longs by -1,396 and increased their shorts by +1,827, signaling weakening sentiment toward the GBP.
Open Interest rose modestly by +465 → showing renewed engagement, though there’s clear divergence between Commercial and Non-Commercial positioning.
Implication: Net pressure remains bearish, but there's evidence of short saturation from Commercials, possibly hinting at a consolidation phase or reversal ahead.
USD Index (ICE Futures)
Non-Commercials increased both longs (+2,044) and shorts (+1,975), signaling indecision.
Commercials slightly increased long exposure (+689), while shorts remained mostly flat (-114).
Implication: The dollar shows cautious strengthening, but with no strong directional conviction. A period of ranging price action is likely.
2. Retail Sentiment
67% of retail traders are short GBP/USD, with only 33% long.
Volume favors short positions as well: 7,727 lots vs. 3,866 long.
Implication: From a contrarian perspective, the excessive short bias among retail traders supports a short-term bullish scenario, possibly driven by a short squeeze or liquidity run.
3. Historical Seasonality
May shows a historically bearish tendency:
10-Year Avg: -2.22%
5-Year Avg: -1.60%
2-Year Avg: -0.65%
Implication: Seasonal bias remains negative, but should be interpreted alongside COT and sentiment data to avoid misleading signals.
4. Technical Analysis
Price is currently trading inside a weekly resistance zone between 1.3513 and 1.3600, following a strong bounce from a dynamic support.
A previous structure break failed to follow through → bull trap was avoided.
The weekly RSI is rising from neutral levels, suggesting momentum is shifting upward.
Previous demand zones around 1.3176 and 1.3047 held well.
Implication: A potential breakout is forming, but it occurs near a key technical level. Without strong volume or fundamentals, the area may trigger a sell reaction.
5. Market Depth
There is a heavy cluster of short orders above current price, while long orders appear scattered and less aggressive.
This creates a liquidity magnet effect, which may lead to bullish spikes towards 1.3550–1.3600 before any meaningful distribution.
Implication: Potential upside extension in the short-term to hunt stops, followed by a bearish reaction.
🎯 Operational Outlook
Main Bias: Neutral-to-Bullish short-term, Bearish (Seasonal) mid-term
Key levels to watch:
Resistance: 1.3550–1.3600
Support zone: Ascending trendline and 1.3340–1.3176
Likely Scenarios:
Price may spike toward 1.3550 to clear liquidity before facing rejection.
A confirmed weekly close above 1.3610 opens the door to 1.3750.
A drop below 1.3340 confirms structural reversal and bearish continuation.

Potential BearsThe market looks to be in a wave 4 of a Submicro wave and has pulled back at a satisfying 38.2% Fib Level, the next move is downstairs to complete wave 5 of the same degree. We could catch some fish here.
This is solely our trading insight and not an investment advice.
Follow us for more Insights and Contents

USDCHF – Awaiting Breakout Ahead of FOMC: Key Levels in Focus USDCHF – Awaiting Breakout Ahead of FOMC: Key Levels in Focus
📌 MARKET OVERVIEW
USDCHF is currently consolidating within a tight range after a technical rebound from the 0.8226 support zone. The price is testing a confluence area at the descending trendline and the 200 EMA on the H2 chart, indicating indecision between bulls and bears as we head into the high-impact FOMC event.
🔍 TECHNICAL ANALYSIS – H2 CHART
Overall Trend: Sideways corrective move within a broader downtrend channel. Price is approaching critical resistance at the EMA200 and the channel’s upper boundary.
EMAs in focus: EMA13 (black), EMA34 (orange), EMA89 (red).
Fibonacci Retracement: Price is hovering around the 0.5 fib zone (0.8298), a neutral level for potential reaction.
🎯 Key Levels & Trade Scenarios:
Major Resistance Zone: 0.8330 – 0.8368 → aligned with the 0.618 Fibonacci retracement and previous structural high.
Key Support Zone: 0.8226 → strong demand area. A break below this could expose deeper downside or set up a false break trap.
📌 Most Likely Path:
Price could dip back to 0.8226 before launching a bullish recovery targeting 0.8330 – 0.8368.
A clean breakout above 0.8368 with momentum and volume could invalidate the bearish bias and shift the trend mid-term.
🌍 MACRO & FUNDAMENTAL CONTEXT
FOMC IN FOCUS: The Federal Reserve is expected to hold rates steady at the upcoming meeting. However, market attention will be on Powell’s tone. A hawkish stance could fuel further USD strength, propelling USDCHF toward resistance zones.
SNB (Swiss National Bank) maintains a neutral tone with slight disinflationary concerns, offering limited support for the CHF and strengthening the USDCHF upside case.
US Treasury Yields are showing signs of recovery, adding bullish pressure to USD pairs.
📌 TRADING STRATEGY:
Watch for bullish reaction at 0.8226 – potential long setup if RSI divergence appears.
Short-term targets: 0.8330 → 0.8368.
Breakout Strategy: If price clears 0.8368 with conviction, shift bias to bullish continuation and monitor for FVG or trendline breakout alignment.
📣 Stay sharp for increased volatility around FOMC. Position sizing and discipline are key in macro-heavy weeks like this.

The Great Erosion: Why I Hedge With BitcoinBy Coach Miranda Miner
Look at this chart. It doesn’t scream. It doesn’t panic. It simply tells the truth.
Over the past decade, major fiat currencies have quietly lost their purchasing power. The Chinese Yuan has been debased by 61%, the US Dollar by 46%, the Euro by 38%, the British Pound by 34%, and even the Japanese Yen, often praised for its stability, has fallen 29%. And yet, central banks speak as if things are under control.
They tell us inflation is “transitory.” They say rate hikes are temporary. They promise normalization. But as we’ve seen, normalization often means sacrificing the value of your hard-earned money.
This is not a conspiracy. This is macroeconomic policy at work.
The Reality Behind Currency Debasement
Since the global financial crisis of 2008, central banks like the Federal Reserve (the Fed) have resorted to unprecedented monetary policy tools—quantitative easing, low interest rates, and now liquidity injections whenever markets tremble. The Fed’s balance sheet ballooned from under $1 trillion pre-crisis to nearly $9 trillion at its peak.
Each time the Fed prints more dollars to buy assets and prop up markets, the money supply increases. When this happens without a corresponding increase in goods and services, what do you get? Inflation.
And when inflation accelerates beyond control, currency debasement follows. Your dollars buy less. Your savings silently shrink.
It’s not just the Fed. The European Central Bank, Bank of England, and People’s Bank of China have followed similar paths. Governments and their central banks are running deficits and solving them by diluting the very currency people save in.
Don’t Just Trust Banks—Understand Incentives
Let me ask you a simple question: Do you think your bank cares more about your financial freedom, or about their own bottom line?
Look at the recent collapses: Silicon Valley Bank, Credit Suisse, and Signature Bank. We were told the system was stable. Then it cracked—overnight.
Even NYSE:JPM , NYSE:BAC , and NYSE:WFC —the biggest banks—are still at the mercy of regulatory changes, interest rate whiplashes, and geopolitical shocks. Don’t forget: banks are leveraged institutions. They lend more than they own.
Meanwhile, you earn 1-2% on your savings while inflation eats away 6-8% per year. That’s a guaranteed loss.
The Bitcoin Hedge: Scarcity in a World of Printing
Now compare that with Bitcoin ( CRYPTOCAP:BTC ).
Bitcoin has a fixed supply: 21 million coins, ever. No Fed. No central authority. No backroom stimulus deal. Its supply is encoded and transparent. Every four years, the Bitcoin halving cuts the rate of new issuance, making BTC more scarce over time.
In April 2024, we witnessed the most recent halving. The mining reward dropped from 6.25 to 3.125 BTC per block. In economic terms, the supply shock began fueling upward price pressure—exactly as it did in 2012, 2016, and 2020.
Meanwhile, institutional demand surged. After the SEC approved spot Bitcoin ETFs in January 2024, trillions of dollars were unlocked. Funds like BlackRock’s IBIT, Fidelity’s FBTC, and ARK Invest’s ARKB have been aggressively accumulating Bitcoin.
In fact, by January 2025, ETFs acquired 51,500 BTC in a single week. During that same period, only 13,850 BTC were mined. That’s a 3.7x supply squeeze.
Let that sink in.
Bitcoin is the Antithesis of Fiat
Bitcoin is not a gamble. It is insurance against the failure of the fiat system.
For traders like us, it’s a strategic asset. For long-term investors, it’s a savings technology. For people in unstable economies—think Argentina, Lebanon, Turkey—Bitcoin is freedom.
Even in the Philippines, I see it. OFWs sending money home are starting to learn about Bitcoin on the Lightning Network, bypassing remittance fees from NYSE:WU or $ML.
As Coach Miranda Miner, I always teach: Discipline. Risk Management. Malasakit.
This is not about being anti-bank. This is about being pro-freedom.
Retail and Institutional Alignment
For the first time, retail traders and Wall Street giants are eyeing the same asset. That alignment is rare.
NASDAQ:TSLA holds over 10,000 BTC.
NASDAQ:MSTR (MicroStrategy) holds more than 300,000 BTC and continues to raise capital just to buy more.
El Salvador, a sovereign nation, now holds Bitcoin in a strategic reserve. Their president even uses geothermal volcano energy to mine BTC sustainably.
This is no longer fringe. This is mainstream adoption in motion.
But What About Volatility?
Yes, Bitcoin is volatile. That’s true. But let’s flip the script.
If something is volatile but trending upward in the long run—like Bitcoin—doesn’t it make sense to accumulate wisely?
Versus keeping wealth in a stable asset—like fiat—that consistently loses value. That’s slow bleeding. It’s not volatility. It’s erosion.
A Strategic Framework for 2025
Here’s what I advise fellow traders and investors:
Hedge your fiat exposure. Don’t keep all your assets in cash or peso.
Use dollar-cost averaging ( GETTEX:DCA ) to buy CRYPTOCAP:BTC regularly.
Allocate responsibly. You don’t need to go all-in. Even 5–10% exposure can protect your portfolio.
Track macro events. Monitor Fed rate decisions, CPI prints, and ETF flows.
Avoid hype. Study fundamentals. Bitcoin rewards research, not impulse.
The Takeaway
The currencies we grew up trusting have quietly betrayed us.
This isn’t fear-mongering. This is risk awareness.
If you believe in working hard, you should also believe in protecting that hard work. And Bitcoin offers that shield—not because it’s perfect, but because it’s mathematically incorruptible.
You owe it to yourself to understand the shift happening before your eyes.
So yes, I hedge with $BTC. Because in a world of ever-weakening paper, digital scarcity is power.
—Coach Miranda MinerCEO, Global Miranda Miner GroupDiscipline. Risk Management. Malasakit.

Buy JPYAfter reaching the order block, there is a possibility to buy up to the Tokyo high after 5 minutes and the session's low in the high-volume area from yesterday.

GJ shortI’m short from this level at 195.45. Resistance moved sideways and finally intercepted the main trend line of resistance. Price has been rejecting this level. Final TP as of now is 184.9. With the 3 & 6 month candles closing that may change.

AUDUSDPotential Long opportunity
- overall bullish trend
- Rejected then retested 1hr/4hr Demand zone
- Bullish candle sticks
- Double bottom pattern formed

KIWI/USD 4 HR./ CORRECTIVE WAVE B IS LIKELY OVER!1). Price is very likely heading towards the fair Market value @ .5900. 2). Risk Assets are weak today on US$ strength! 3). BANKS ARE SELLING! 4). Volume is dropping. 5). Trendline intersecting with target fib. level 50%.

Trading Signal for EUR/USD buy above 1.1335 or sell below 1.1418Early in the American session, the euro is trading around 1.1342, undergoing a technical correction after reaching a high of 1.1418 during the European session.
The euro reached price levels seen at the end of April, and we believe it could continue to fall in the coming hours, REACHING THE 21sma at 1.1335.
On the H4 chart, we can see that the euro has formed an uptrend channel since May 11. It is likely that after a technical correction, EUR/USD could rebound around 1.1335, which will be seen as a buying opportunity with targets at the 7/8 Murry level at 1.1418.
GBP/JPY) Bullish pullback analysis Read The ChaptianSMC trading point update
Tchnical analysis for GBP/JPY (British Pound / Japanese Yen) on the 4-hour timeframe. Here’s a breakdown of the trading idea and structure:
---
Key Technical Elements:
1. Support Zones:
Orderblock Zone (small yellow box near 192.15): Price is currently hovering around this area, which acts as a demand zone.
Main Support Level (larger yellow zone around 190.00): A deeper pullback may test this level if the orderblock fails.
2. EMA 200 (192.167):
Price is fluctuating around the 200 EMA, showing indecision.
A strong bounce above this moving average could indicate bullish momentum resuming.
3. RSI Indicator:
RSI is neutral (~47.80), leaving room for upside movement without being overbought.
4. Projected Price Path:
Two potential bullish scenarios:
A bounce from the orderblock leads straight to a rally.
A deeper dip into the support level forms a double bottom or liquidity grab, followed by a strong reversal.
5. Target Point:
The projection shows price rising to 196.368, which is a prior high and significant resistance.
---
Trade Idea Summary:
Bias: Bullish
Entry Zone:
Primary: Around 192.15 (orderblock)
Secondary (deeper entry): Around 190.00 (support level)
Confirmation: Bullish engulfing candle or strong wick rejection near entry + price reclaiming 200 EMA
Target: 196.368
Invalidation: Break and close below 189.80 (support zone violated)
Mr SMC Trading point
---
Risk Management & Notes:
Good R:R potential if entering near support with a stop below 189.80.
Watch for confirmation before entry — especially if price dips to the lower support.
Macroeconomic events (UK or Japan central bank decisions) could impact volatility.
Pales support boost 🚀 analysis follow)

USD/JPY confirming a bullish shift in market structure.y Smart Money Concepts Highlighted:
🔄 Break of Structure (BOS):
BOS is marked near the top (~147.5), confirming a bullish shift in market structure.
Indicates the market took out a prior swing high, confirming demand is in control temporarily.
💧 Liquidity Sweep:
The term "Liquidity Sweeps" appears in the indicator (LuxAlgo).
The downward wicks before the rally likely indicate stop hunts/liquidity grabs below support.
🟩 Fair Value Gap (FVG):
A zone highlighted during the drop (~144–145), suggesting an inefficiency in price that institutional traders may want to rebalance.
FVGs often act as magnets for price and potential reversal or continuation zones.
🟦 Order Block (OB):
OB marked after the FVG zone—used as a potential demand zone.
Price previously reacted to it and now may revisit before further moves.
---
🧱 Support & Resistance Zones:
Support Zone: Clearly marked near 141.5–142, where price bounced.
Resistance/Target Zone: Large green box from 147 to ~151.2, implying a bullish target zone.
---
🎯 Trade Idea or Forecast (Implied):
Price has bounced off the support.
Expectation: A move back into the OB/FVG zone, followed by a potential bullish breakout toward 151+
Stop Loss Zone (in red): Below 143.123 – protecting against invalidation of the bullish setup.
Projected Take Profit Zone (in green): Between 147 and 151.268, based on supply zones and market imbalance fills.
---
📈 Entry Concept (Implied Strategy):
Bullish bias after structure break.
Entry zone: Around current price or after minor pullback.
SL (Stop Loss): Below last structural low.
TP (Take Profit): 147–151.26 (targeting mitigation of prior inefficiencies or liquidity)
---
✅ Summary Like a Pro:
> "The USD/JPY 4H chart shows a liquidity-driven bullish setup following a confirmed BOS. After sweeping liquidity below support, price has reacted from a demand zone aligning with a fair value gap and order block. The setup suggests a long opportunity targeting the 147–151.26 resistance zone, with stop placement below 143.12 for optimal risk-reward. This aligns with Smart Money behavior and institutional order flow."

EURGBP breakout down trend bullish strong now from demand zone🚨 EUR/GBP Trade Setup – Bullish Breakout Alert! 🚨
Pair: EUR/GBP
Timeframe: 30-Minute (M30)
📈 EUR/GBP has officially broken out of its downtrend, confirming a bullish reversal on the 30-minute chart. We're now watching price action closely around the demand zone @ 0.83800 – ideal entry level for long positions.
💡 Technical Targets:
🎯 1st Target: 0.84100
🎯 2nd Target: 0.84300
🎯 3rd Target: 0.84600
🔒 Risk Management:
Always trade with a well-placed stop-loss just below the demand zone. Monitor price action for confirmation before entering.
Let’s ride the trend with smart entries and precise targets. 📊💰
— Livia 🤍📉📊
#ForexTrading #EURGBP #TechnicalAnalysis #BreakoutStrategy #SmartMoney #FXSignals #LiviaTrades

EUR/USD Technical Outlook (Read Caption)📈 EUR/USD Technical Outlook
🗓️ Date: May 28, 2025
🕒 Timeframe: Likely 4H
💵 Current Price: 1.13387
📍 Chart Zones & Market Structure
🟣 Support Zone (1.1280 – 1.1310)
🟢 Buyers Active!
✅ Strong demand visible with multiple bullish rejections (marked by green arrows).
🛡️ Market respects this zone – accumulation possible.
🧲 Acts as a springboard for upward moves.
🔴 Resistance Zone (1.1420 – 1.1450)
🔻 Sell Pressure High!
Repeated rejection at this level (red arrows 📉).
🚫 Strong resistance; previous highs couldn’t sustain.
⚠️ Price may pause or reverse here again.
📊 Price Action Pattern
📐 W-Pattern / Double Bottom Formation
The chart outlines a potential W-shaped recovery from support.
🔄 Suggests possible bullish reversal if neckline breaks around 1.1380.
🎯 Target post-breakout aligns with resistance zone (1.1420+).
🔮 Bullish Scenario (Blue Arrow)
💡 Plan: Break + Retest at 1.1380 = 🚀 Long Opportunity
📈 Target: 1.1420–1.1450 zone
📦 Entry confirmation: Bullish engulfing or strong breakout candle
🛑 SL: Below 1.1310
🧠 What to Watch
🔔 Key Economic Events Coming (🎯🇺🇸 & 🇪🇺 icons):
High volatility expected — align trades with fundamentals.
📅 News catalysts can validate or invalidate the technical setup.
🧭 Professional Tip
📌 "Structure first, signals second"
Let the price react at key zones before entering.
Patience + Reaction = Precision Trades 🧠📊
✅ Conclusion
The market is in a neutral-to-bullish phase, trading between well-defined support and resistance. With a clean structure forming and economic events lining up, it’s a great moment to stay alert, plan your entries, and execute only with clear confirmation. 🎯📉📈

GBPJPY up trend and resistance breakout bullish strong now📈 GBPJPY Trade Alert – Strong Bullish Momentum!
Timeframe: 1H
Trend: Uptrend 🔼
Status: Resistance Breakout Confirmed 💥
OANDA:GBPJPY has broken through key resistance at 194.200, confirming a bullish continuation pattern. Price is now retracing back to the breakout zone — a textbook retest-entry opportunity for swing and intraday traders. 🧠
🔹 Entry Zone: 194.200 (Previous Resistance Turned Support)
🔹 Technical Target #1: 196.200
🔹 Trend Bias: Bullish
🔹 Confirmation: Breakout + Retest Setup
🔹 Risk Management: SL just below 193.800 (structure support)
📊 This setup aligns with momentum and market structure — watch for bullish candlestick confirmation before entering. Patience pays!
Trade smart,
Livia 😉✨
#GBPJPY #ForexSetup #BreakoutRetest #PriceAction #ForexSignals

EU D1 TimeframeOn daily, the pair has formed a flag which is a continuation pattern. The flag is wave 4, and should be selling to complete wave 5 for the next bullish move.

NZDUSD: Bullish Move From Key LevelI observe a solid bullish signal on 📈NZDUSD following a test of significant support,
The price formed an ascending triangle pattern and broke above its neckline.
I anticipate that it will soon reach the 0.6034 level.

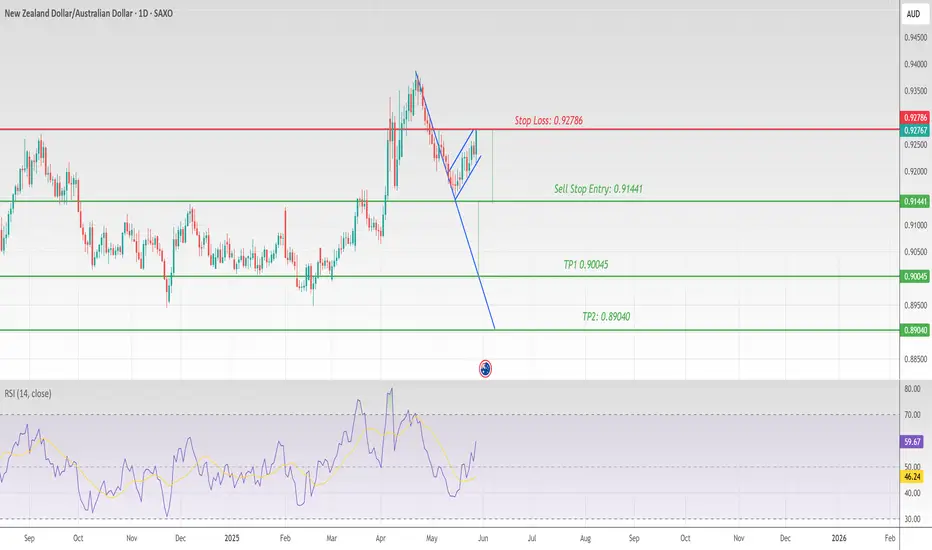
NZDAUD 1 Daily Chart Bearish Flag Continuation PatternNZDAUD 1 Daily Chart Bearish Flag Continuation Pattern
Stop Loss: 0.92786
Sell Stop Entry: 0.91441
TP1 0.90045
TP2: 0.89040
No Divergence
USDJPY Breakout the down trend bullish strong now📈 FX:USDJPY Technical Update
Timeframe: 1H
By Livia 💹
FX:USDJPY has officially broken out of the downtrend, confirmed by a strong bullish candle — momentum is on the buyers' side.
✅ Entry Zone: Support retest at 144.000
🎯 Targets:
• TP1: 145.500
• TP2: 148.300
🔍 Price action and structure support continuation to the upside. Wait for clean confirmation on the retest before entering for maximum probability.
Trade smart. Risk managed.
#Forex #USDJPY #PriceAction #Breakout #TradingSetup #LiviaFX

USD/JPY) Bullish reversal analysis Read The ChaptianMr SMC Trading point update
Technical analysis for the USD/JPY (U.S. Dollar / Japanese Yen) on the 4-hour timeframe. Here's a detailed breakdown of the idea and strategy:
---
Key Components of the Chart:
1. Strong Support Zone:
The yellow zone is labeled as a “big support level of pullback”, around the 142.00 – 141.20 range.
Price has historically bounced from this zone, suggesting demand and buyer interest.
2. Bullish Structure Setup:
Price is forming a double bottom or potential reversal pattern in the support zone.
A downtrend line is clearly marked, and a break above this trendline would signal bullish continuation.
3. EMA 200 (at 145.020):
The EMA is currently acting as dynamic resistance.
A breakout above the EMA would confirm further bullish momentum.
4. RSI Indicator:
RSI is currently below 30, indicating the market is oversold – a common precursor to a bullish reversal.
5. Target Levels:
Target 1: 145.803 – likely the first resistance level or EMA retest.
Target 2: 148.587 – a prior high and strong resistance area.
6. Projection:
Price is expected to bounce from support, break the trendline, retest, and then rally to higher levels.
---
Trade Idea Summary:
Bias: Bullish
Entry Zone: Near 142.00 – 141.20 (support zone)
Confirmation: Break above the descending trendline + bullish RSI divergence
Targets:
TP1: 145.803
TP2: 148.587
Invalidation: Break and close below 141.00 (support zone broken)
Mr SMC Trading point
---
Risk Management Suggestion:
Use a tight stop-loss below the support zone, considering it's the key reversal area. Also, keep an eye on fundamental factors such as U.S. and Japan interest rate decisions or key economic events (indicated by the icons on the chart).
Pales support boost 🚀 analysis follow)

EURUSD: Bearish Continuation & Short Trade
EURUSD
- Classic bearish formation
- Our team expects fall
SUGGESTED TRADE:
Swing Trade
Sell EURUSD
Entry Level - 1.1312
Sl - 1.1356
Tp - 1.1223
Our Risk - 1%
Start protection of your profits from lower levels
Disclosure: I am part of Trade Nation's Influencer program and receive a monthly fee for using their TradingView charts in my analysis.
❤️ Please, support our work with like & comment! ❤️
