EUR/GBP Thief Trade: Swipe Profits Before Overbought Trap!🦹♂️ EUR/GBP "THE CHUNNEL HEIST" – BULLISH LOOT IN PROGRESS! 🚨💰
(Thief Trading Strategy – Escape Before the Cops Arrive!)
🎯 DEAR MARKET PIRATES & PROFIT SNATCHERS,
Based on our 🔥Thief Trading Style Analysis🔥, we’re executing a bullish heist on EUR/GBP ("The Chunnel"). The vault is wide open—time to swipe the loot before the high-risk resistance police barricade (aka overbought trap) shuts us down!
📜 THE MASTER PLAN:
✔ Entry (📈): "The Bullish Vault is Unlocked!"
Buy Limit Orders (15-30min TF) near recent swing lows/highs.
Thief’s DCA Trick: Layer entries like a pro robber—multiple limit orders for max loot.
✔ Stop Loss (🛑): "Hide Your Stash Wisely!"
SL at nearest 4H candle wick (0.86500)—adjust based on your risk appetite & lot size.
Remember: A good thief always has an escape route!
✔ Target (🎯): 0.88500 (or escape earlier if the cops get suspicious!)
🔎 SCALPERS & SWING BANDITS – LISTEN UP!
Scalpers: Stick to LONG-ONLY heists! Use trailing SL to protect profits.
Swing Thieves: If you’re low on cash, join the slow robbery—DCA & hold!
📡 WHY THIS HEIST IS HOT:
Bullish momentum in play (but BEWARE of overbought traps!).
Fundamental Drivers: Check COT Reports, Macro Data, & Sentiment.
🚨 TRADING ALERT: NEWS = POLICE RAID RISK!
Avoid new trades during high-impact news.
Trailing SL = Your Getaway Car! Lock profits before volatility strikes.
💥 BOOST THIS HEIST – STRENGTHEN THE GANG!
👉 Smash the LIKE & BOOST button to fuel our next market robbery!
👉 Follow for more heists—profit awaits! 🚀💰
🦹♂️ Stay Sharp, Stay Ruthless… See You on the Next Heist!
Forex market


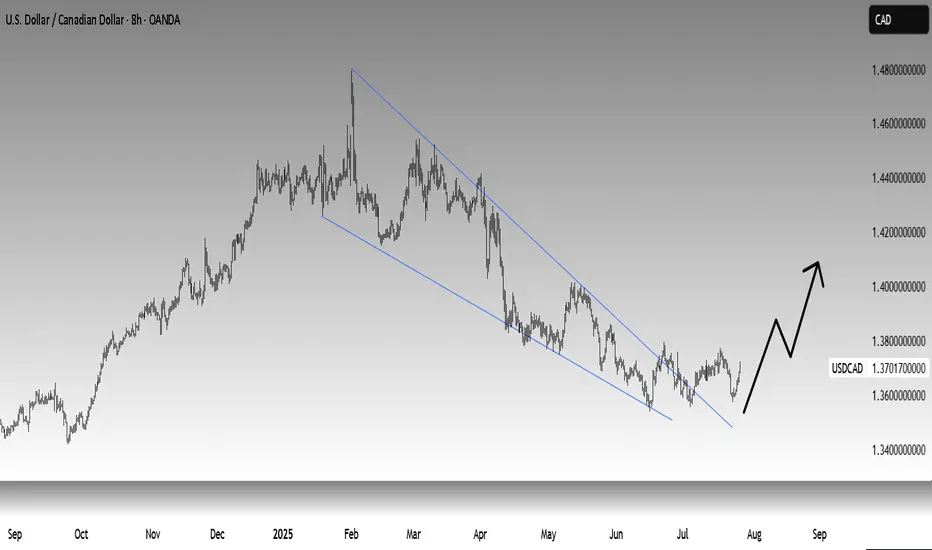
USDCAD – Bullish OutlookThe US Dollar continues to show strength against the Canadian Dollar. Price closed firmly at 1.3700, signaling strong bullish momentum and potential continuation.
📈 Trade Idea: Long USDCAD
🔹 Entry: 1.3700
🔹 Targets:
First Target: 1.3800
Second Target: 1.3900
Extended Target: 1.4000+
Strong USD fundamentals, coupled with technical strength on higher timeframes, support further upside in this pair. Watching for bullish follow-through and potential breakout above recent resistance.
EURUSD Bullish Break of Structure after the liquidity sweepAs long as confirmation comes in the demand zone, this is a solid bullish setup.

USD/JPY - Potential TargetsDear Friends in Trading,
How I see it,
Let me know if anything is unclear.
Keynote:
My personal point of view is that the greenback will be like a
train @ full throttle (BULLISH) for the second half of 2025.
Specifically, from the 1st of August...
I sincerely hope my point of view offers a valued insight
Thank you for taking the time study my analysis.

EURUSD 1HConsidering that the one-hour timeframe trend for the EURUSD symbol has turned bullish and liquidity has been collected at the last low, after a price correction in lower timeframes and observing a suitable candlestick setup, one can enter a buy trade and follow the price at least up to 1.18310.

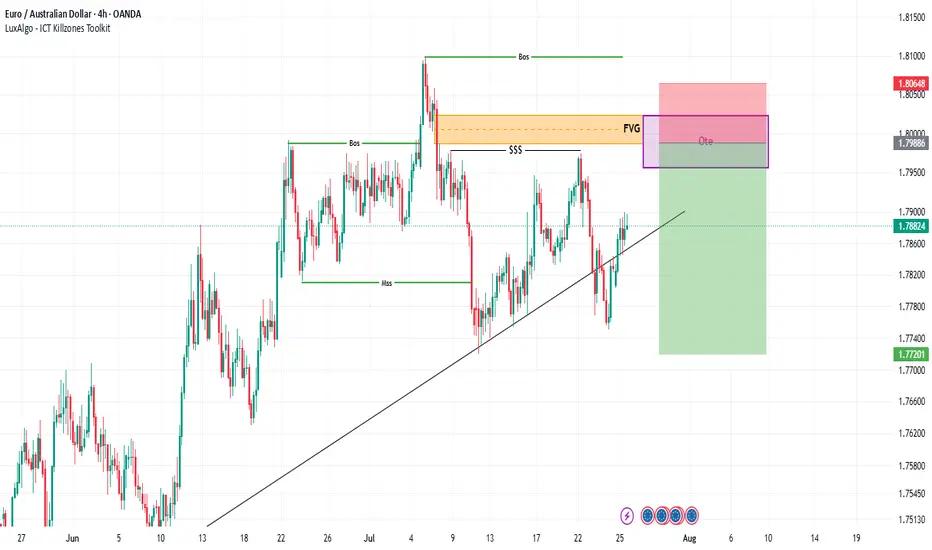
EUR/AUD: Triangle Breakout Opportunity^EURAUD is currently trading at 1.7878, forming a well-defined symmetrical triangle pattern after a strong uptrend that began in early 2023. The pair has maintained a bullish structure with higher lows along a clear trendline since mid-2022, culminating in a powerful breakout in March 2025.
Technical Analysis
Triangle Formation: Since April 2025, price has consolidated in a symmetrical triangle, with converging trendlines indicating compression before the next directional move.
Support Zone: The 1.77 area has proven to be reliable support throughout June-July 2025, with multiple successful tests.
Resistance Level: The 1.80 level has capped upward movement since April, creating the upper boundary of our triangle pattern.
Momentum Indicators: The recent higher lows suggest underlying bullish pressure building within the triangle formation.
Trading Strategy
Given the overall uptrend and triangle formation, this setup offers a compelling trading opportunity:
Bullish Trade Setup
Entry: Buy at current market price (1.7878) or on a pullback to 1.7780
Stop Loss: Place below the triangle support at 1.7680
First Target: 1.8050 (triangle resistance)
Second Target: 1.8300 (measured move from triangle height)
Risk-Reward: Approximately 1:2.5 for the full move
Alternative Approach
Breakout Entry: Buy on a break above 1.8000 with a stop below 1.7780
Breakout Target: 1.8300-1.8400
Rationale
The symmetrical triangle forming at the upper range of a strong uptrend typically resolves in the direction of the prevailing trend. With ^EURAUD showing resilience at support levels and maintaining its position above the long-term trendline, the probability favors an upside resolution.
The March 2025 breakout demonstrated significant bullish momentum, and the current consolidation appears to be a pause rather than a reversal. The multiple tests of support at 1.77 without breaking lower further strengthens the bullish case.
Key Levels to Watch
Breakout Confirmation: Daily close above 1.8000
Support Breakdown Alert: Daily close below 1.7700
Major Support: Long-term trendline around 1.7000
Upside Potential: Previous high at 1.8550 (April 2025)
^EURAUD presents a classic triangle consolidation within an uptrend, offering a favorable risk-reward opportunity. The technical structure suggests accumulation rather than distribution, with price likely to resolve higher in alignment with the longer-term bullish trend.
Traders should monitor the 1.80 resistance level closely, as a decisive break above this level could trigger a significant move higher, potentially targeting the April 2025 highs.

EURUSD BUYSEU is bullish. It has been consistently making HHs & HLs. I’d look for price to push towards the daily resistance @ 1.83000 then I’d look for price to push towards 1.19000.

GBPUSD SHORTSPrice closed the week bearish. There’s a daily head and shoulders pattern as well. Looking for price to continue bearish towards daily support. I’d like for price to retrace and create a LH before looking to get back into shorts.

Lower Timeframe Analysis on EUR/JPYIn this trade, I intend to open a long position.
Looking at the lower timeframes (15-minute chart), I see a potential buying opportunity. After reaching the area near the 173.609 level, the pair reversed down to around 172.978, and then bounced back up. This movement may indicate the start of a reversal followed by a pullback.
Moving on to the higher timeframes (daily and weekly), the bullish candles are showing some strength, and the following technical indicators:
* 45-period Exponential Moving Average
* 70 and 95-period Simple Moving Averages
* Parabolic SAR
Are moving in line with the intended direction and objective, which may suggest a continuation of the upward trend.
That said, it's important to remember that despite this technical analysis, it's crucial to monitor economic data, news, and other fundamental factors that could affect this pair, since this assessment focuses solely on the technical side.
The long position tool displayed on the chart is just an additional aid to help support the entry decision.

CAD_JPY WILL GO UP|LONG|
✅CAD_JPY will soon retest a key support level of 107.500
So I think that the pair will make a rebound
And go up to retest the supply level above at 108.100
LONG🚀
✅Like and subscribe to never miss a new idea!✅
Disclosure: I am part of Trade Nation's Influencer program and receive a monthly fee for using their TradingView charts in my analysis.

GBPAUD--SHORT--27_07_25--breaking of ascending trendline
--move towards monthly resistance around 2.026 ( bold dashed horizantal line)

EURNZD ShortAfter a recent Market Structure Shift (MSS) signaling a bearish direction, I'm looking to short at 1.95692. The supply zone aligns perfectly with the 61.8% retracement level, and there's a potential liquidity/inducement level forming, adding confluence to the trade.

NZDCAD Long Now!📌 Instrument & Timeframe
NZD/CAD – 4H timeframe
Overall trend across multiple timeframes is noted as bullish (W, D, 12H, 6H, 4H all bullish).
📈 Market Structure
Price previously moved within a descending channel (drawn by two black trendlines) but has broken out to the upside.
After the breakout, price retraced back near a key area (just above the 200 EMA / red line) and is forming a smaller bull flag or descending wedge, indicating a potential continuation.
🔥 Area of Interest
Weekly AOI (Area of Interest) marked around 0.8180 – 0.8200 zone has acted as strong support.
Price reacted bullishly from that AOI, confirming buyers stepped in.
✅ Trade Bias
All higher timeframes (W, D, 12H, 6H, 4H) are bullish, so the bias is long.

EUR/JPY is Approaching a Key Supply Zone, Possible ShortWe initially anticipated a reversal around the 173.000 supply zone. It’s important to note that the Bank of Japan is currently facing a serious issue in the bond market — there have been several sessions with no bids for Japanese government debt. This is a troubling development and likely means the central bank will step in to purchase bonds soon.
That said, price closed above the 173.000 level on Friday, signaling further bullish momentum. The next key area of interest is the 175.000 level — a significant supply zone we are monitoring closely. If price reacts and pulls back from this level, we’ll be analyzing the yen across other major pairs, as well as keeping a close eye on the euro.

GBP/USD Holds Trendline Support as USD Shows StrengthThe US dollar showed some strength against the British pound during Thursday and Friday session, reflecting overall USD resilience.
Despite the prevailing uptrend, it's possible that GBP/USD may begin to consolidate, given how extended the pound's bullish run has been.
Currently, price is holding above a rising trendline, with additional support near the 1.3350 level. That trendline could play a key role if price pulls back further.
This pair often acts as a gauge for broader USD strength, considering the pound's relative strength. A decisive break above the 1.3600 level could open the door for a move toward 1.3750 in the sessions ahead.

bearish ideaThe trend is bearish after the structure break. I’m waiting for the price to return to the imbalance on the 4-hour timeframe, and I will not sell until liquidity is swept above and there is a reaction to the imbalance.
CADJPY TRADE RECAPLooking Into This Trade That I shared To You Yesterday. I Just Want To Explain The Reason Behind This Trade And I Hope It Is Going To Add Something In Your Trading

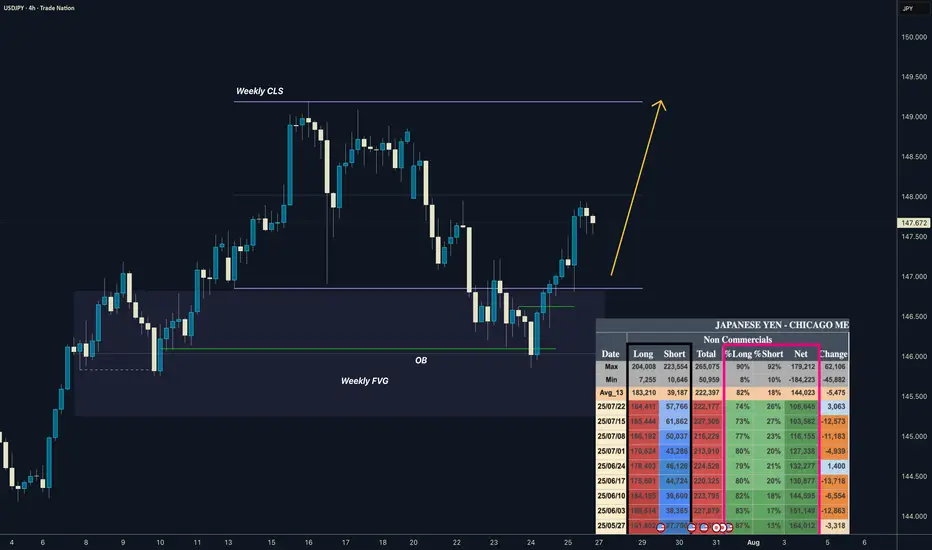
USDJPY I Weekly CLS I Model 1 / 2 I COT Bullish ASFYo Market Warriors ⚔️
Fresh Crypto Analysis— if you’ve been riding with me, you already know:
🎯My system is 100% mechanical. No emotions. No trend lines. No subjective guessing. Working all timeframes. Just precision, structure, and sniper entries.
🧠 What’s CLS?
It’s the real smart money. The invisible hand behind $7T/day — banks, algos, central players.
📍Model 1:
HTF bias based on the daily and weekly candles closes,
Wait for CLS candle to be created and manipulated. Switch to correct LTF and spot CIOD. Enter and target 50% of the CLS candle.
For high probability include Dealing Ranges, Weekly Profiles and CLS Timing.
Analysis done on the Tradenation Charts
Disclosure: I am part of Trade Nation's Influencer program and receive a monthly fee for using their TradingView charts in my analysis.
Trading is like a sport. If you consistently practice you can learn it.
COT Data
we can see reduced longs exposure and increasing shorts on JPY contract which is clear signs of bullishness confirmed by decreasing Net positions.
“Adapt what is useful. Reject whats useless and add whats is specifically yours.”
David Perk aka Dave FX Hunter
💬 Comment any Coin I ll give you my quick view
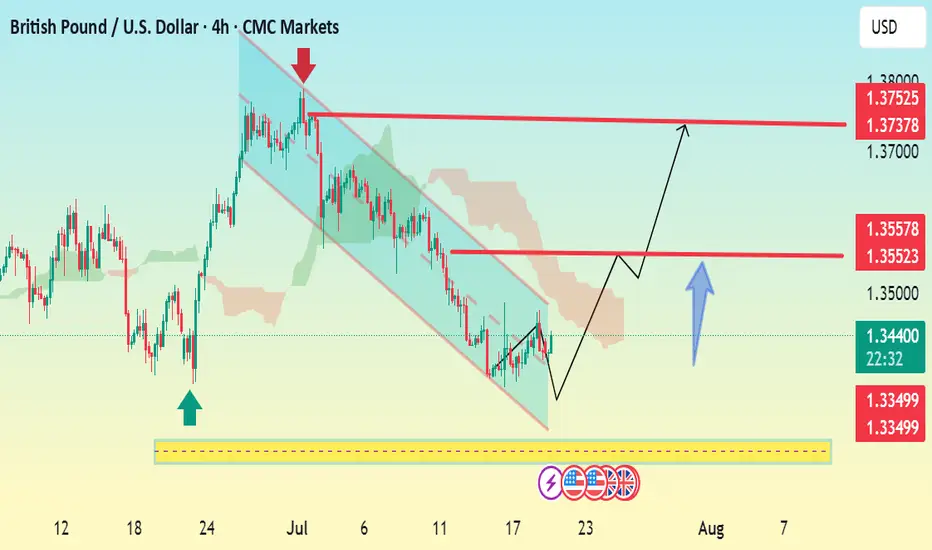
GBP/USD 4H Bullish Reversal Setup Analysis:The chart shows GBP/USD breaking out of a descending channel, signaling a potential bullish reversal.
Price has bounced from a strong support zone (highlighted in yellow), with bullish momentum building.
The breakout is backed by a higher low structure, which often precedes an uptrend continuation.
Key Levels:
Support: 1.3349
First Resistance / TP1: 1.3552–1.3557
Final Target / TP2: 1.3737–1.3752
Outlook:
If price holds above 1.3439 and breaks 1.3552 with volume, the next leg toward 1.3750 is likely.
Watch for retests of the breakout level for confirmation before entering long.
📈 Bias: Bullish above 1.3439
🕐 Timeframe: 4H chart
Let me know if you want SL (stop loss) and entry suggestions too.
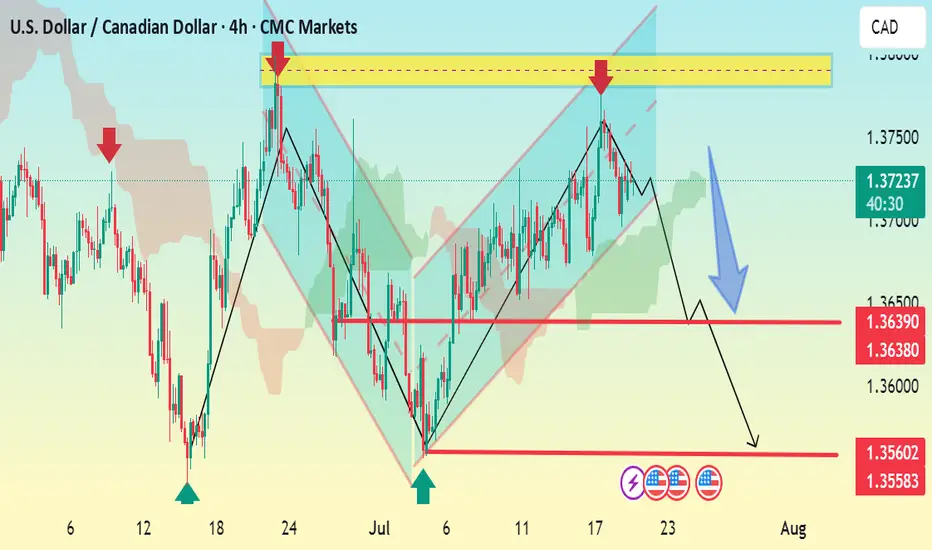
USDCAD 4H Bearish SetupThe USDCAD chart shows a clear bearish breakdown from the ascending channel. Price has broken below support near 1.3720, confirming a shift in structure.
Key Analysis:
Bearish Momentum: Break below the channel and current market structure signals downside pressure.
Immediate Resistance: 1.3725–1.3745 zone (yellow area) where price previously rejected.
Support Levels:
1.3639 / 1.3638: Short-term support — possible temporary bounce area.
1.3560: Main target — previous demand zone.
Trade Idea:
Sell below 1.3720
TP1: 1.3639
TP2: 1.3560
SL: Above 1.3750 (above resistance zone)
Summary:
Bias remains bearish as long as the price stays below 1.3725–1.3750 resistance zone. Confirmation of further downside expected on break below 1.3638.
Let me know if you want this as a signal format or turned into an image.
EUR_JPY WILL GROW|LONG|
✅EUR_JPY will keep growing
Because the pair is in the uptrend
And recently broke the key level of 173.200
So we will be expecting
Bullish continuation
LONG🚀
✅Like and subscribe to never miss a new idea!✅
Disclosure: I am part of Trade Nation's Influencer program and receive a monthly fee for using their TradingView charts in my analysis.

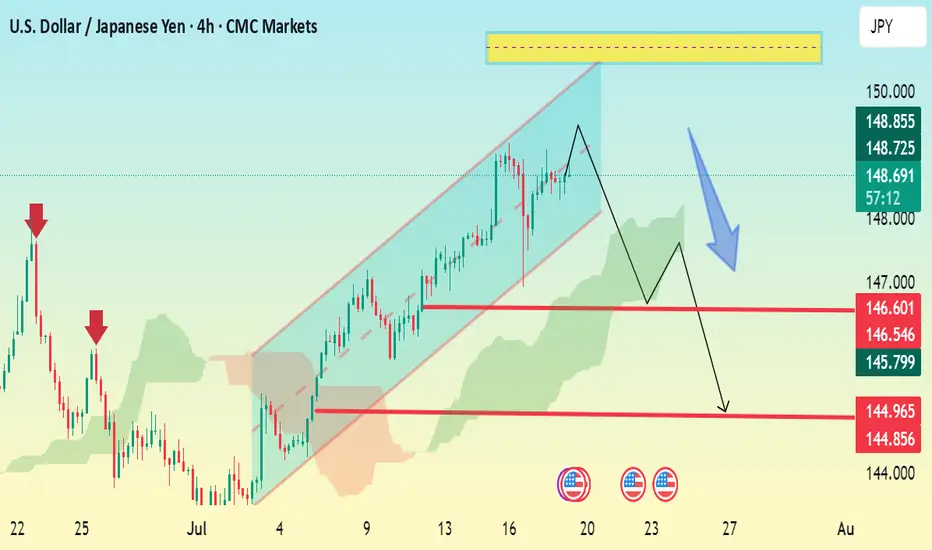
USD/JPY 4H Bearish Setup – Channel Breakdown ExpectedThe chart shows USD/JPY in a rising channel with a projected bearish reversal setup forming. Here’s a breakdown:
🔹 Current Price: 148.83
🔹 Pattern Observed:
The pair is trading inside a rising channel.
A potential double top or lower high formation near the top of the channel suggests weakening bullish momentum.
Price may break down through the channel support.
🔻 Bearish Scenario (as shown by the blue arrow):
1. Initial drop expected to the support zone around:
146.60 – 146.54
Minor consolidation possible at this level.
2. If broken, next target zone is:
144.96 – 144.85
🔑 Key Levels:
Resistance Zone: 149.80–150.00 (highlighted in yellow)
Support Levels:
First: 146.60
Second: 144.96
✅ Bearish Confirmation:
A 4H candle close below 146.60 would confirm the bearish move.
Watch Ichimoku cloud — if price breaks and closes below the cloud, it will strengthen the downtrend.