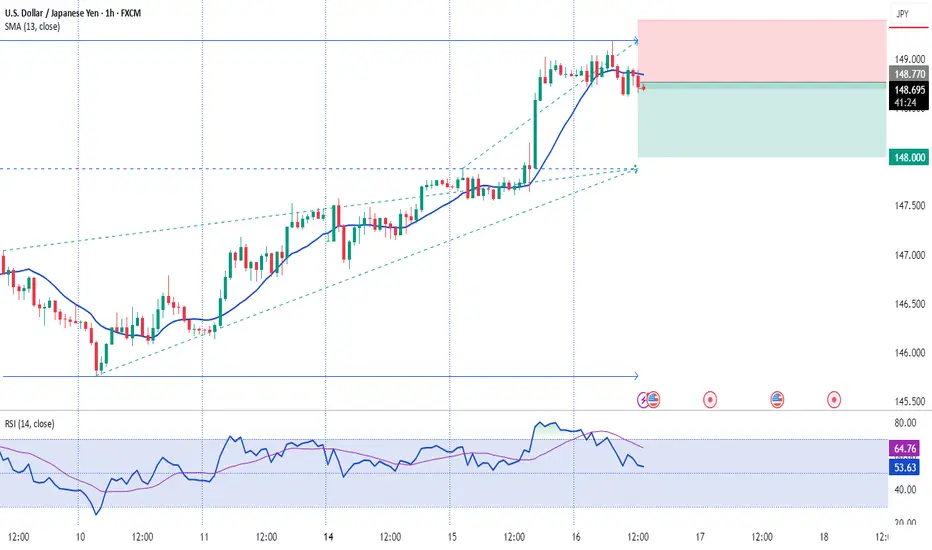
16.07.2025 #USDJPYSELL 148.770 | STOP 149.400 | TAKE 148.000 | ⏳ Close the trade in profit or move Stop Loss to breakeven after the price passes +25 pips.
Forex market
EURCAD – Two Key Levels, One Solid PlanOn this pair, we have two important levels:
🟡 The first level might act as a trap (stop hunting).
So don’t rush to buy — wait for confirmation.
🟢 The second level offers a safer buy opportunity.
As always, our plan stays firm —
we don’t tell the market what to do, we follow it.
🔻 If a clean break and valid pullback occurs on the first level,
a short trade toward the lower level is possible.
⚠️ This pullback short scenario is only valid until price reaches the lower level.
If price hits the lower level and starts moving up,
any short position becomes much riskier.
Discipline > Prediction.

7.16 GBP/JPY LOSSSome days you go through things like this, when the markets make big moves it is great if you are on the right side and sucks if you are not. We have a limit to our exposure in the markets and ALWAYS follow our bankroll management plan. Price hit our stop on this one — no hesitation, no regrets. The setup met all the VMS criteria, but the market had other plans. This happens, and it’s built into the process. No revenge trades. No chasing. Just alignment and discipline. That’s how we grow.

7.16 EUR/AUD LOSS“Losses come, but the rules don’t change.
VMS gave me the setup. The market said no.
That’s trading. I’m still aligned. Still watching. Still learning.”
Losses are part of the trading atmosphere, this is the reason when trading you MUST have a solid plan for risk management.

EUR USD shortThis is not my original idea. I took some advice and looked at other ideas, so I decided to come up with a short one. Let's see what happens.
Please note: This is for educational purposes only and not a trading signal. These ideas are shared purely for back testing and to exchange views. The goal is to inspire ideas and encourage discussion. If you notice anything wrong, feel free to share your thoughts. In the end, to learn is to share !

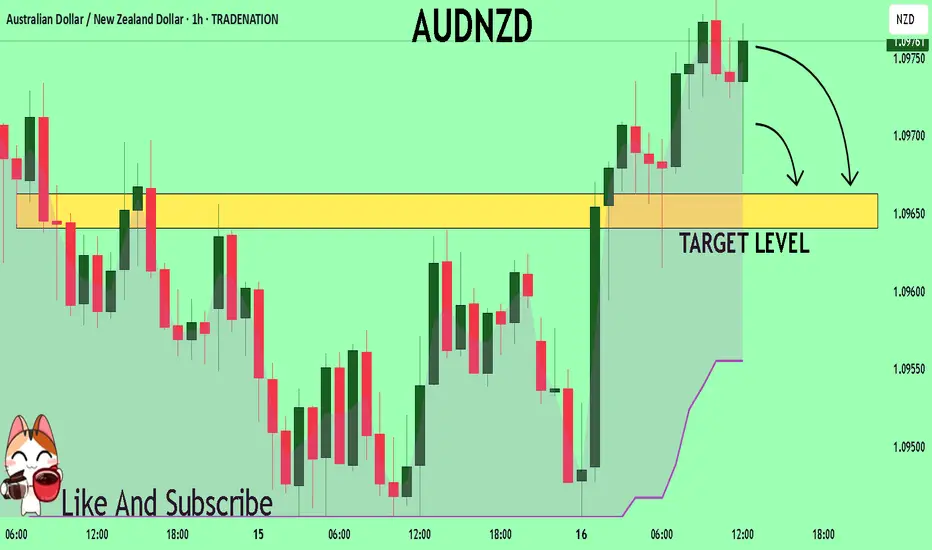
AUDNZD Local Long!
HI,Traders !
#AUDNZD made a bullish
Breakout of the key horizontal
Level of 1.09105 which is now a
Support and the pair is going down
To retest the level from where
We will be expecting a
Further bullish move up !
Comment and subscribe to help us grow !

ger30 longLike I previously said, it's a very simple and repetitive approach to the markets
identifying the daily trend
identifying the 4h level
final: entering after entry patterns on the smaller time frame

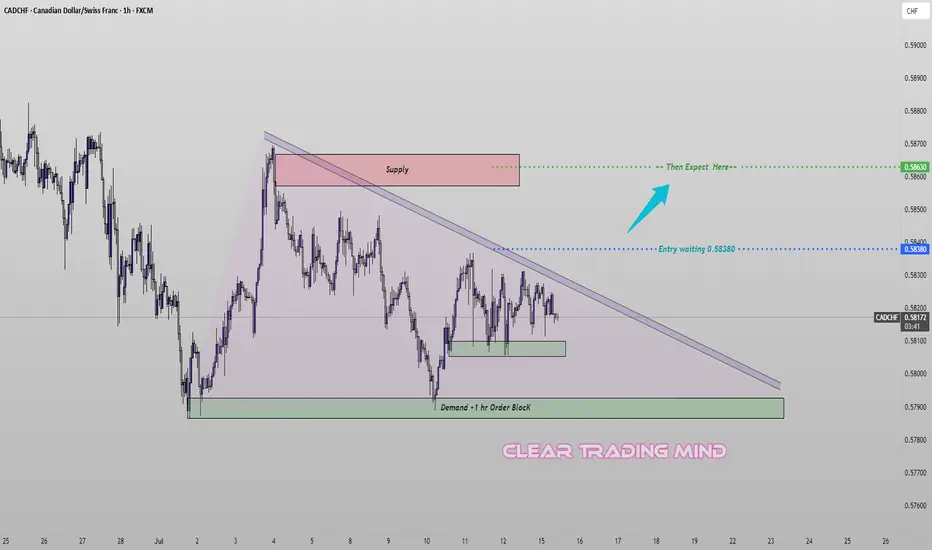
CADCHF Squeeze Between OB and Trendline – Big Move Coming?CADCHF is compressing within a descending triangle structure, showing signs of bullish intent as it continues to reject a key demand + 1H order block area.
🔹 Trade Idea:
I’m watching for a bullish breakout above 0.58380, which will also confirm a trendline breakout from the descending triangle. Until then, I remain on the sidelines.
🔹 Key Technical Factors:
- Price consolidating inside a descending triangle, squeezing between lower highs and a consistent demand zone
- Repeated rejections from the green demand zone suggest buyers are defending the level strongly
- A clean order block (1H) is aligned with the bottom of this structure, adding confluence for a bullish move
- Above 0.58380 breakout may trigger momentum toward 0.58630, near the supply zone
🔹 Trade Plan:
+ Buy above: 0.58380 (on breakout + close above trendline)
+ First Target: 0.58630 (next resistance/supply area)
* Invalid if: price breaks and holds below the demand zone
⚠️ Note: Entry is only valid on confirmed breakout. Until then, patience and watchfulness around structure edges are key.
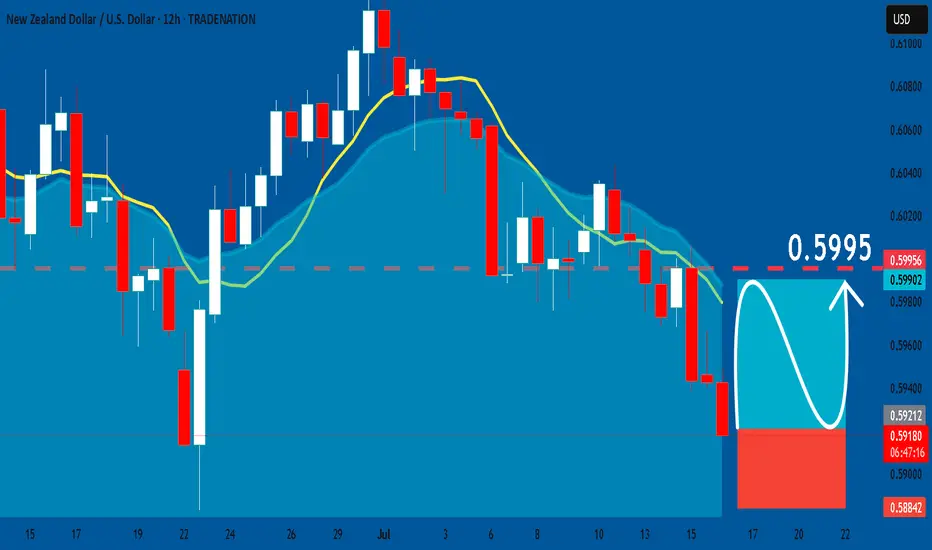
NZDUSD: Bullish Continuation & Long Signal
NZDUSD
- Classic bullish setup
- Our team expects bullish continuation
SUGGESTED TRADE:
Swing Trade
Long NZDUSD
Entry Point - 0.5922
Stop Loss - 0.5884
Take Profit - 0.5995
Our Risk - 1%
Start protection of your profits from lower levels
Disclosure: I am part of Trade Nation's Influencer program and receive a monthly fee for using their TradingView charts in my analysis.
❤️ Please, support our work with like & comment! ❤️
7.16 WATCH USD/CHF 4H CHARTThis one came onto the radar yesterday, we want to see a pullback into the strong S/R zone, then see ALL of the indicators line up...(engulfing candle, volume, momentum, 50 EMA) to tell us this market is ready to go up. Keep watching for now.

7.16 WATCHING EUR/GBP 4H CHARTThis market made a recent new high to confirm the uptrend, now we want to see it pullback into the S/R, make an engulfing candle up, momentum to be low pointing up and volume to be strong up..........also, all of this MUST happen in the morning sessions. We are watching this one.

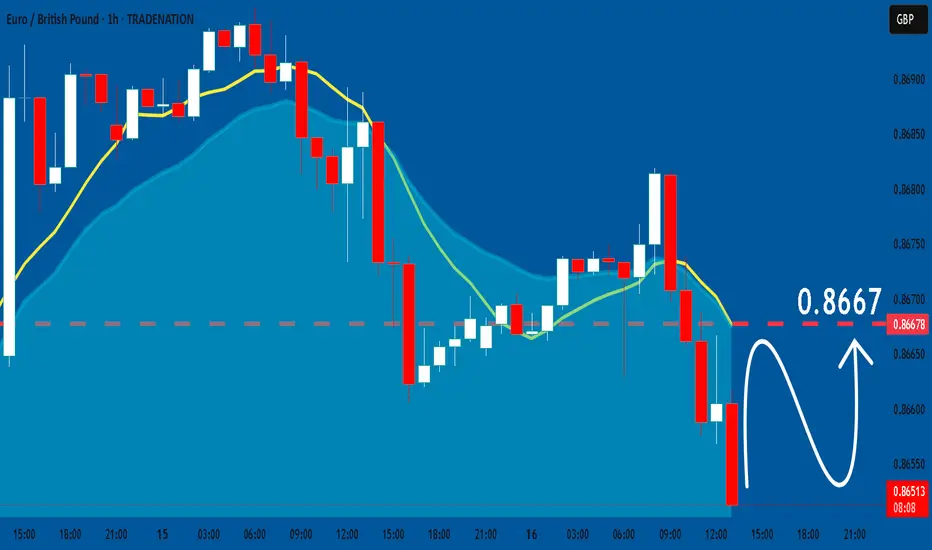
EURGBP: Expecting Bullish Movement! Here is Why:
The charts are full of distraction, disturbance and are a graveyard of fear and greed which shall not cloud our judgement on the current state of affairs in the EURGBP pair price action which suggests a high likelihood of a coming move up.
Disclosure: I am part of Trade Nation's Influencer program and receive a monthly fee for using their TradingView charts in my analysis.
❤️ Please, support our work with like & comment! ❤️
EURUSD: The Market Is Looking Down! Short!
My dear friends,
Today we will analyse EURUSD together☺️
The in-trend continuation seems likely as the current long-term trend appears to be strong, and price is holding below a key level of 1.15850 So a bearish continuation seems plausible, targeting the next low. We should enter on confirmation, and place a stop-loss beyond the recent swing level.
❤️Sending you lots of Love and Hugs❤️

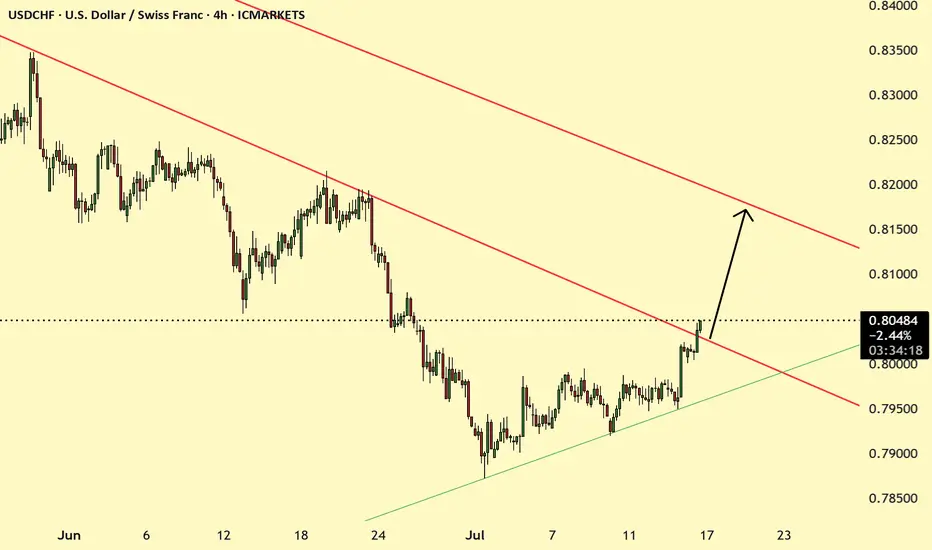
USDCHF break of Resistance USDCHF has recently brokend the resistance trendline is likely to go up. After the yesterday news the bullish movement of USD will continue
7.16 EUR/AUD LIVE TRADE UPDATE DAY 2We took this trade on Tuesday morning and we are now waiting for price action to move down. It tested the Support and resistance levels and got rejected which is a good sign that it should be heading back down.

CADCHF possible Bearish Scenario The CADCHf is bearish mode and recently forming a symmetrical triangle like pattern and Within this also forming another sub triangle. let us see how it behaves to these trendlines.

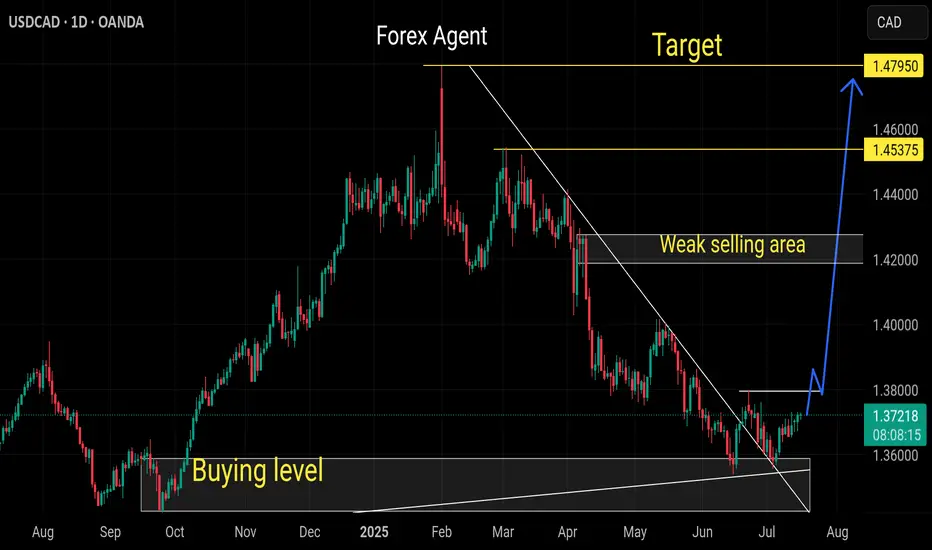
Strong buy usdcadA strong buy wave coming
Monthly already oversold pair
Daily sell trend already breaks giving a signals for buyers
As usd gonna strong among all Cross pairs
GBPCHF TRADE IDEA We seem to be pulling back on GBPCHF
We anticipate a pullback to our Fibonacci level for a continuation trade to the downside on GBPCHF.
Let's see how the market does it's thing
AUDNZD Under Pressure! SELL!
My dear followers,
This is my opinion on the AUDNZD next move:
The asset is approaching an important pivot point 1.0975
Bias - Bearish
Technical Indicators: Supper Trend generates a clear short signal while Pivot Point HL is currently determining the overall Bearish trend of the market.
Goal - 1.0966
About Used Indicators:
For more efficient signals, super-trend is used in combination with other indicators like Pivot Points.
Disclosure: I am part of Trade Nation's Influencer program and receive a monthly fee for using their TradingView charts in my analysis.
———————————
WISH YOU ALL LUCK
Usdcad strong buyStrong buy expected
Weekly and monthly too oversold pair
Daily down trend breaks already which giving the good signs for buyers
Strong bullish correction expected

NZDCAD SHORT Market structure bearish on HTFs DH
Entry at both Weekly and Daily AOi
Weekly Rejection at AOi
Daily Rejection at AOi
Previous Structure point Daily
Around Psychological Level 0.82000
H4 EMA retest
H4 Candlestick rejection
Rejection from Previous structure
Levels 2.66
Entry 100%
REMEMBER : Trading is a Game Of Probability
: Manage Your Risk
: Be Patient
: Every Moment Is Unique
: Rinse, Wash, Repeat!
: Christ is King.

EUR/USD 4 HOURS BEARISH ANALYSISThe image depicts a computer screen displaying a trading platform, specifically the Euro/U.S. Dollar currency pair on a 4-hour chart from FXCM. The chart features a black background with a blue trend line and a blue shaded area, indicating an upward trend. The price action is represented by red and green bars, with the current price at 1.17283.

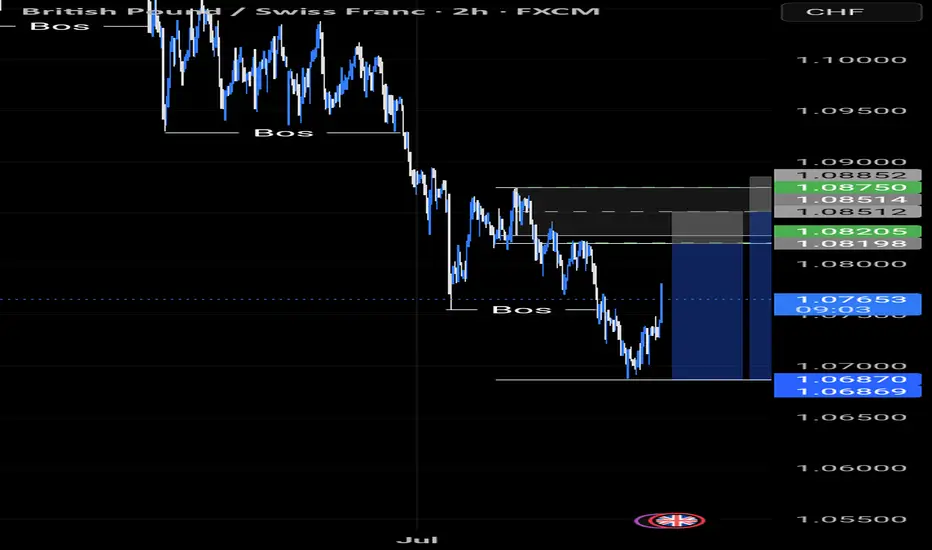
GBP/JPY 2HOURS BULISH ANALYSISThe image shows a computer screen displaying a trading platform with a candlestick chart for the GBP/USD currency pair. The chart is displayed on a black background, with pink and blue bars representing price movements. A green and pink rectangle is visible on the left side of the screen, possibly indicating a trade or order. The overall atmosphere suggests that someone is actively trading or analyzing the market using this platform.
