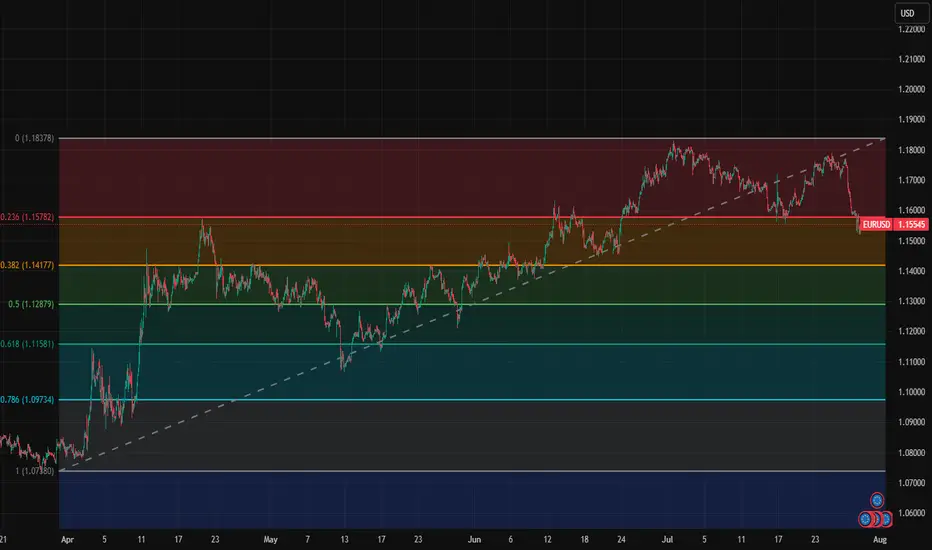
EurUsd short term key levelsThese are short term key levels for intra day and swing trading on 1h chart.
1.0718
1.0973
1.1158
1.1288
1.1418
1.1578
1.1838
Forex market
USDCAD Update: Don’t Sleep on This Uptrend’s First LegYo traders, Skeptic from Skeptic Lab here! 🚀 USDCAD’s serving a hot long trigger for pattern traders chasing the first leg of a big uptrend! We’ve got an ascending triangle breakout on the daily, with bullish candles stacking up, hinting at a return to the weekly bullish trend. Too early to confirm, but the momentum’s fire.
📈 Today’s FOMC meeting’s got everyone buzzing—will Powell cut, hold, or drop resignation hints? Check the full setup in the video, but with crazy news like Federal Funds Rate
, s tick to high-probability trades, keep risk low, and no FOMO or revenge trading! Drop your thoughts, boost if it vibes <3

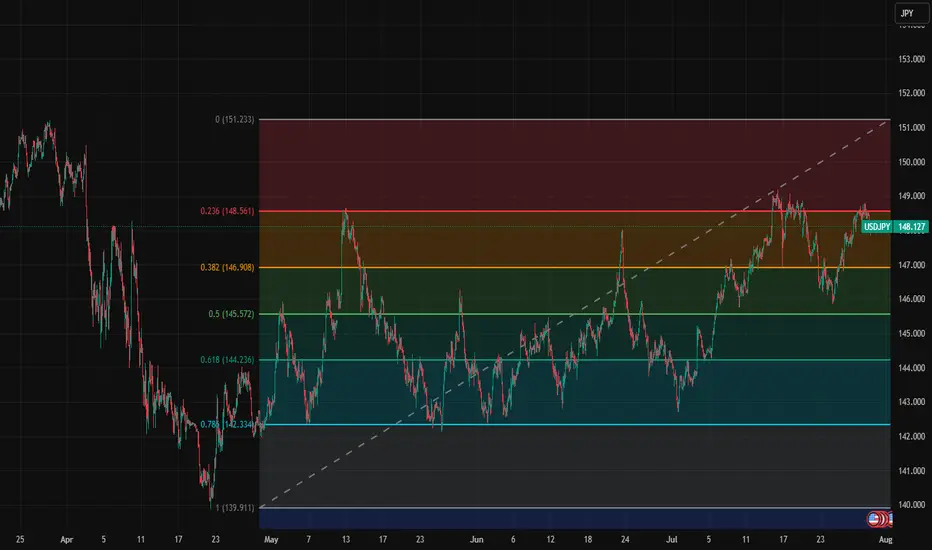
USDJPY short term key levelsThese are short term key levels on 1h chart for intra day and swing trading.
139.91
142.33
144.23
145.57
146.91
148.56
151.233
EURUSD ahead of the FEDEURUSD remains below the 1,1600 level following the trade agreement between the US and the European Union.
Today, all eyes are on the FED’s decision regarding interest rates.
Watch for a reaction around the support zone, as it may present an opportunity for the trend to continue.
However, it's advisable to reduce risk and hold off on new entries until after the news is released.

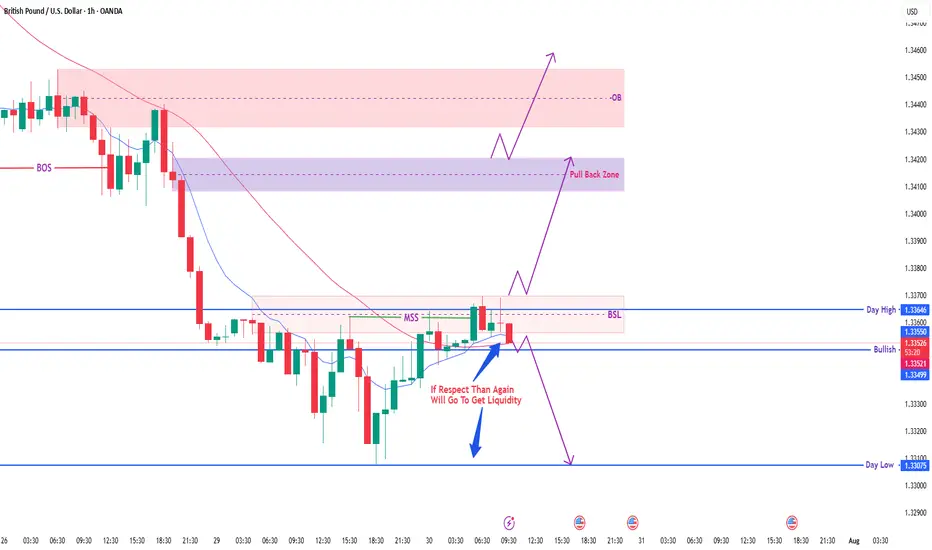
GBP/USD – Bullish Liquidity Grab Setup | 1H Chart AnalysisPrice is currently consolidating after a strong bearish move and has shown signs of a potential reversal. Here's the breakdown:
🔹 MSS (Market Structure Shift) has occurred, indicating a possible trend reversal
🔹 Price is forming higher lows with internal liquidity build-up beneath BSL (Buy Side Liquidity)
🔹 Expecting a short-term liquidity grab below BSL, followed by a bullish push into the Pullback Zone
🔹 Key Zones to Watch:
• Bullish Reaction Zone: 1.3335–1.3345
• Pullback Target: 1.3400–1.3420
• Full Take Profit: 1.3440+ (Order Block Zone)
🧠 Scenarios:
1️⃣ If price respects current minor demand zone, it may sweep BSL and head to Pullback Zone
2️⃣ Failure to hold may revisit Day Low (1.33075) for deeper liquidity grab before a bounce
Bias: Bullish (after liquidity sweep)
Invalidation: Break below Weak Low
Shorts ConfirmationPrepare to sell! Be Ready! Its preparing a move like eurusd, we try to make a similiar down push, this patern is ready to drain al that liquidity downstairs

AUDUSD Analysis – Bullish Structure Still IntactAUDUSD is trading within a clear ascending channel on the H4 chart. After dropping from the FVG zone around 0.65800, price has reacted well to the lower boundary support near 0.64650.
Currently, price action suggests the potential formation of a short-term bottom. If this level holds and the pair rebounds, the next target could be the red FVG zone near 0.65400.
Recent Supporting News:
U.S. consumer confidence slightly weakened, causing the dollar to cool off — offering technical rebound support for AUD.
Trading Strategy:
Prefer short-term Buys near 0.64650 if a confirmed bounce appears, with target around 0.65400. Be cautious if price breaks below the ascending channel.
Do you think AUD will continue to rise within this bullish channel?

GBPJPY – Bearish pressure returns near ascending channel supportGBPJPY is trading close to the lower trendline of the ascending channel, with the 197.400 zone acting as a key support. A breakdown below this level could trigger stronger bearish momentum.
On the news front, Japan’s CPI remains solid, strengthening the yen. Meanwhile, the British pound is under pressure after recent consumer spending data showed signs of weakness, raising concerns over the UK’s economic outlook.
Strategy: If the price breaks below 197.400 and fails to bounce back, consider SELL setups in line with the bearish trend. If it rebounds, watch the reaction around the 199.100 zone for signs of recovery confirmation.

Daily AnalysisWe continue following our trade setup from Monday and looked into valid entries for the day

USD/CAD(20250730)Today's AnalysisMarket News:
According to a Reuters/Ipsos poll, Trump's approval rating has fallen to 40%, the lowest level since his second term.
Technical Analysis:
Today's Buy/Sell Levels:
1.3762
Support and Resistance Levels:
1.3820
1.3798
1.3784
1.3739
1.3725
1.3704
Trading Strategy:
If the price breaks above 1.3784, consider a buy entry, with the first target price at 1.3798. If the price breaks below 1.3762, consider a sell entry, with the first target price at 1.3739.

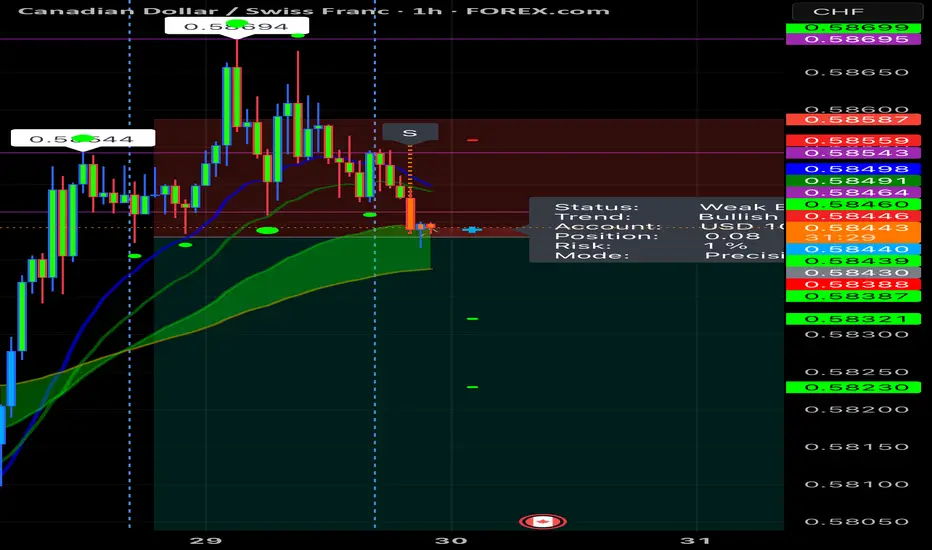
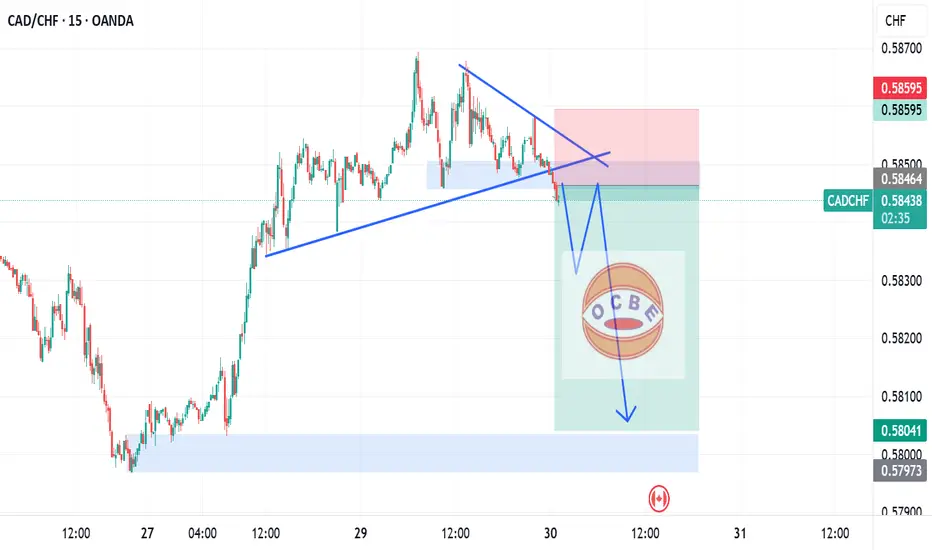
CADCHF short move
Price had broken the support level and hence am expecting more downward movement in price.
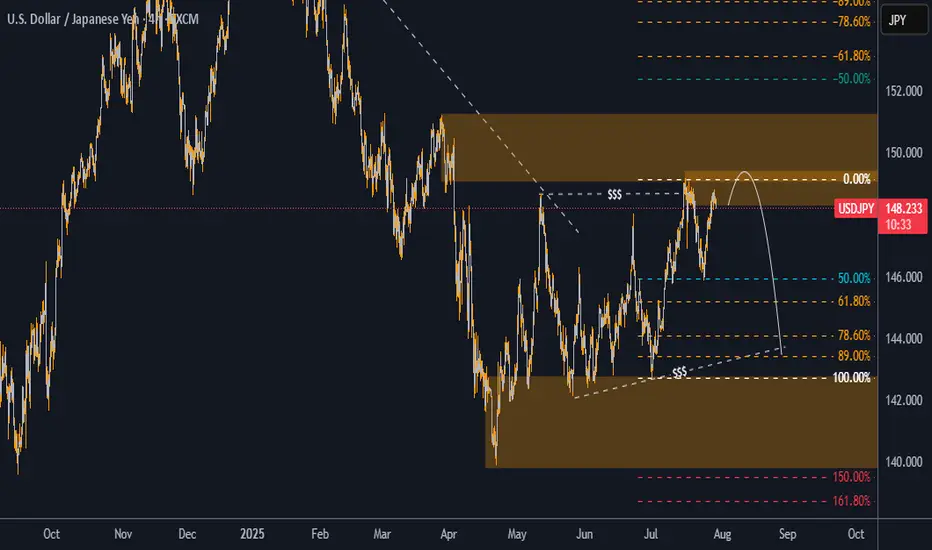
USD/JPY Technical Analysis – Bearish Outlook from Key Supply ZonThe USD/JPY pair is currently presenting a strong bearish opportunity and price action structure. As of the latest 4H chart analysis, the price has reached a well-defined supply zone around the 148.80–149.70 area. This zone aligns with a previous institutional level where price showed significant reaction, marking it as a valid area of interest for sellers.
Liquidity Grab & Rejection
The market structure remains bearish overall. Recently, price took out a cluster of liquidity above the previous highs. This liquidity sweep suggests that smart money may have accumulated short positions, preparing for a move lower.
High-Probability Sell Zone
The price is currently reacting to a premium zone near the 0% Fibonacci retracement level, drawn from the recent swing high to swing low. This zone also coincides with a previous area of imbalance and supply, reinforcing the bearish setup.
Key Bearish Targets
First Target: 145.89 — this aligns with the 50% Fibonacci retracement level and a previous structural support.
Second Target: 142.56 — this deeper target sits near the 89% Fibonacci level, close to an old demand zone where price may look to rebalance.
Summary
With trend direction biased to the downside, the pair is showing strong signs of rejection from a key supply zone after sweeping liquidity. If momentum continues, we expect USD/JPY to drop toward 145.89 initially, with an extended move possibly reaching 142.56.
Traders should monitor price action closely for further confirmations and maintain proper risk management, especially with upcoming economic catalysts that may affect the JPY.
USDJPY short movePrice is currently at a support level and if there should be a break then i will be expecting more downward movement in price.

BIASOne thing i will tell you for free is that, you should stop worrying about entries, and always focus on the market direction, of the current leg of price that you find yourself paired with the HTF perspective, that way even if your entry is wrong, you can always find another entry and join in the given direction.

EUROYENEurjpy has shorter pullbacks within an ascending structure ,shall keep following it and expect it to reach a fair mount of highs or levels

EURGBP Bearish Breakout!
HI,Traders !
#EURGBP broke the rising
Support line and the breakout
Is confirmed so we are
Bearish biased and we
Will be expecting a
Further move down !
Comment and subscribe to help us grow !

EURCAD ShortEURCAD is now net short on the regression break.
I am considering this trade as oil has move over night.

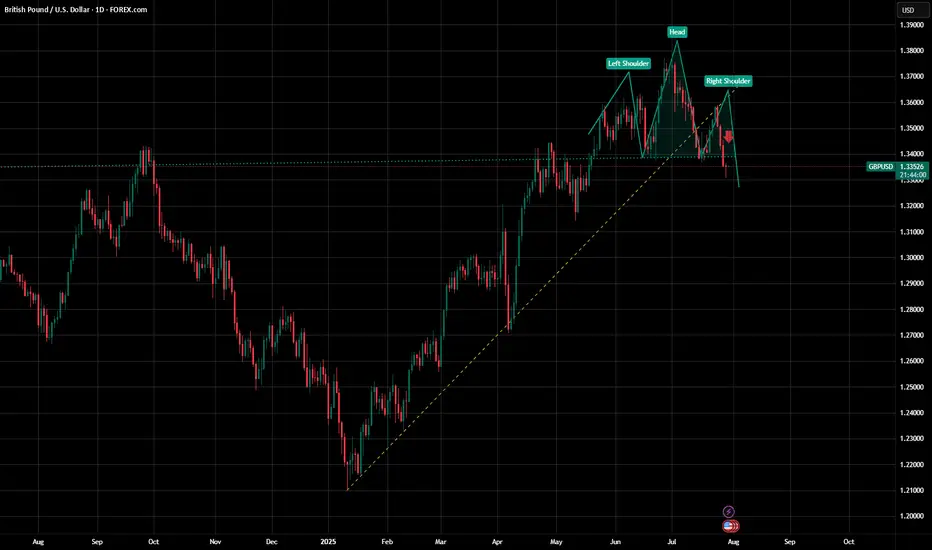
GBPUSD- Daily - H&S PatternReversal Pattern - Bearish Head and Shoulders
Levels - Trendline break and retest - breakdown of the 1.335 level
Price action - 70 day breakout, Strong bearish moves
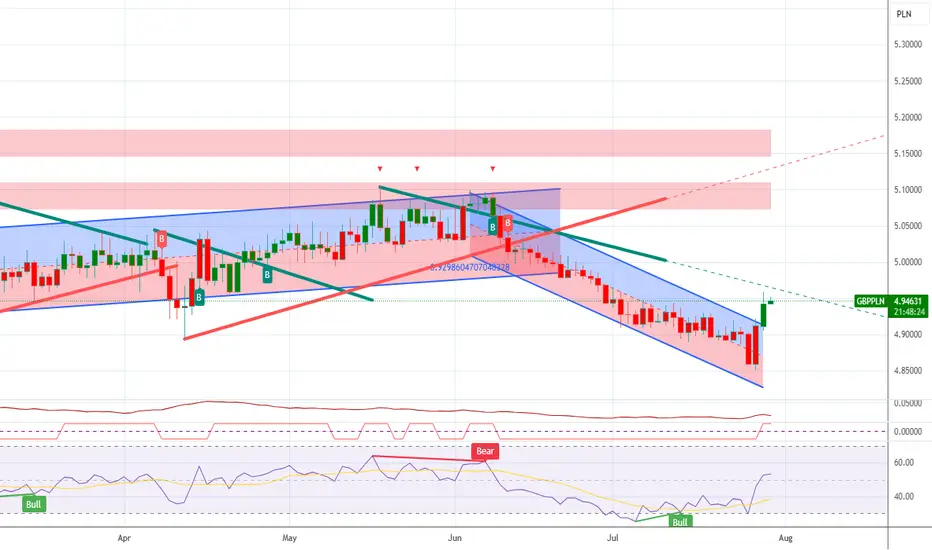
GBPPLN LongGBPPLN is now net long on the regression break.
PLN and HUF have both been hit and it may indicate a new stage in the Ukraine war.

AUDUSD - BullishAUDUSD is Bullish on Fundamental Bias and Seasonal aslo support long position. Divergence can also be observed on RSI. Forming an Harmonic pattern so it looks like buyers are in a strong position

CHFJPY--SHORT--30-07-25--short term short possibility
--entry zone: between 184.186 and 184.583. either price rise up to 184.583 then fall or fall from 184.186
