"NZD/CAD Reversal Play – Ride the Bullish Wave!🦹♂️💰 "THE KIWI-LOONIE HEIST: High-Voltage Forex Robbery Plan (NZD/CAD)" 💰🦹♂️
🌍 Attention all Market Pirates, Thieves & Profit Bandits! 🌍
🔥 Thief Trading Alert – NZD/CAD Bullish Heist Setup! 🔥
The "Kiwi vs Loonie" is setting up for a high-risk, high-reward robbery—and we’re locking in the master plan. Long entry is the play, but this ain’t for the weak hands. Overbought? Consolidation? Reversal trap? Perfect. That’s where we strike.
🎯 THE HEIST BLUEPRINT
🔑 ENTRY ZONE (Breakout & Retest Strategy)
"Wait for the 4H candle to CLOSE ABOVE 0.82600 (MA Breakout + Retest)."
Option 1: Place a BUY STOP above the MA (momentum confirmation).
Option 2: BUY LIMIT near recent swing lows (15M/30M precision).
🚨 Set an ALERT! Don’t miss the breakout—timing is everything.
🛑 STOP LOSS (Escape Route)
SL at 0.82000 (near swing low wick on 4H).
⚠️ Golden Rule: NO ORDERS BEFORE BREAKOUT! Wait for confirmation.
Adjust SL based on your risk, lot size, and multi-order strategy.
🎯 TARGETS (Profit Escape Plan)
Take Profit 1: 0.83300 (First resistance).
Or… Exit Early if the market turns shaky.
Scalpers: Long-only scalp plays! Use trailing SL to lock in gains.
⚡ THIEF TRADER PRO TIPS
✅ Fundamental Backing: Check COT reports, macro trends, intermarket signals.
✅ News Alert: Avoid new trades during high-impact news—protect open positions with trailing stops.
✅ Risk Management: Small lots, multiple entries = smarter heist.
💥 BOOST THE HEIST! (Let’s Get Rich Together) 💥
👉 Smash that 👍 LIKE button to fuel our next robbery plan!
👉 Follow for daily high-voltage setups.
👉 Comment "🚀" if you’re joining the heist!
🤑 NEXT HEIST COMING SOON… STAY TUNED, BANDITS! 🤑
🔥 WHY THIS TRADE? (Thief’s Edge)
Bullish momentum but trapped bears = perfect robbery setup.
Institutional levels + retail traps = our opportunity.
Not financial advice—just a well-planned theft. 😉
⚠️ Warning: Trading = Risk. Only play with funds you can afford to lose.
Forex market

EUR/USD – The Cleanest Buy Setup EUR/USD – The Cleanest Buy Setup This Quarter (Wave E Targeting New Highs)
---
📄 TradingView explanation
📊 EUR/USD 4H Chart Analysis
The pair has beautifully respected the corrective channel from Wave C to D and is now preparing for the final leg — Wave E.
🟦 Key Highlights:
🔹 Price bouncing off demand zone
🔹 Tight consolidation near mid-channel = accumulation
🔹 Next targets: 1.1900 / 1.2050
🔹 Bullish continuation expected after liquidity sweep
🎯 The cleanest and most technically sound buy opportunity this quarter — align your longs with the trend before the breakout happens.
💬 Let them call it a bubble — we call it precision and patience. 🧠💸
#ElliottWave #EURUSD #ForexSetups #SmartMoneyMoves
?

EUR/USD – 1H Timeframe – Bearish Setup- Fibonacci levelsWe’re closely monitoring EUR/USD on the 1-hour chart.
🔻 Trend: Bearish
📉 Price action is clearly forming a series of Lower Highs (LH) and Lower Lows (LL) — a textbook downtrend.
🔎 Divergence: None observed, confirming trend strength.
📊 Current Action: Market is in a retracement phase.
We’ve used Fibonacci retracement, and price has now reached the 38.2% level, a key reversal zone. Based on this, we’ve entered a market sell position.
📌 Trade Setup:
🔹 Entry: Instant Sell @ 1.17302
🔹 Stop Loss: 1.17633
🔹 Take Profit 1: 1.17025
🔹 Take Profit 2: 1.16754
🔹 Risk/Reward: 1:1 and 1:2
🔹 Lot Size: 0.38
🔹 Risk: $200
🔹 Reward: $200 (TP1), $400 (TP2)
⚠️ Bias: Bearish
📍 This trade setup follows strict risk management principles and is based on solid technical confluence.
📈 Let’s see how the price reacts at the key Fib level. Always trade responsibly.
#EURUSD #ForexTrading #BearishSetup #FibonacciTrading #RiskManagement #PriceAction #TradingViewIdeas

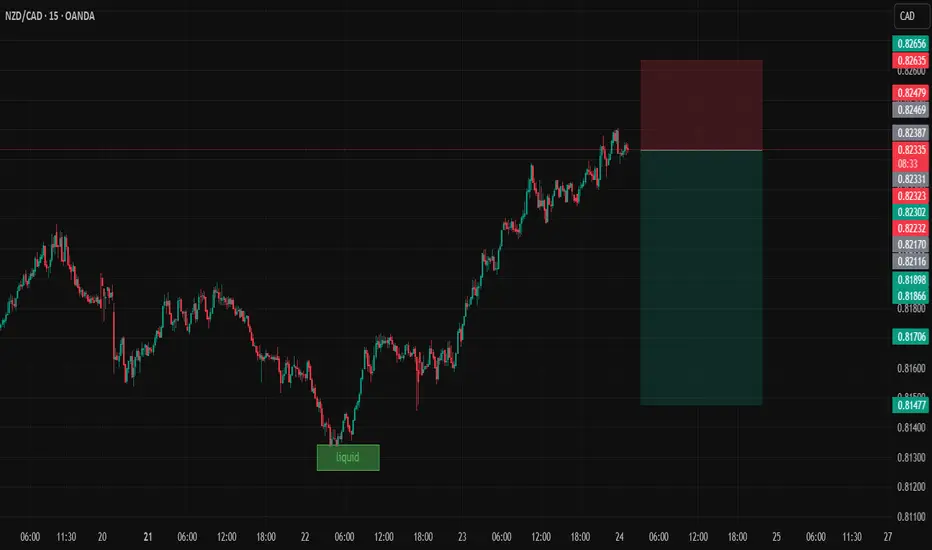
NZDCADDate:
July 24,2025
Session:
Tokyo and London session
Pair:
NZDCAD
Bias:
Short
liquidity pool that is waiting to be swept this week. Looks like price is gonna be magnetized towards that pool level during London and Tokyo. The trade may even stretch into NYC.
Entry: 0.82331
Stop Loss: 0.82635
Target: 0.81475
RR: 2.81
USDCAD SELLUSD/CAD rallies to 1.3680 as the market focuses on a hawkish Fed
The US Dollar extends its recovery for the second consecutive day, supported by strong US data. Upbeat US business activity and Jobless Claims support the Fed's "wait and see" rhetoric. In Canada, the weak Retail Sales data keep hopes for a BoC rate cut alive.
The year will be politically marked by Trump’s return to the White House. A Republican government is seen as positive for financial markets, but Trump’s pledge to cut taxes and impose tariffs on foreign goods and services may introduce uncertainty to both the political and economic landscape.
Canada’s political crisis peaked in late 2024 with a no-confidence vote against Prime Minister Justin Trudeau, leading to snap elections and a weakened Liberal minority government. Policy uncertainty and economic challenges dominate 2025’s outlook, raising concerns over market stability and investor confidence.
The BoC is set to continue easing interest rates through 2025, at least at a faster pace than the Fed is expected to, which could apply pressure on CAD’s already-rising rate differential.
SUPPORT 1.36991
SUPPORT 1.36739
SUPPORT 1.36495
RESISTANCE 1.37346
RESISTANCE 1.37455

7.25 NZD/USD ADDED TO WATCHLIST👀 NZD/USD – Watchlist Setup Forming (VMS Strategy)
Monitoring NZD/USD as it pulls back toward a key support/resistance zone.
What we need to see for a valid setup:
✅ Price to reach the S/R zone
✅ Strong volume building in the trade direction
✅ Momentum aligned or hooking down
✅ A clean engulfing candle near the 50EMA
📌 The setup isn’t ready yet—but it’s developing. Patience pays.
We’ll keep watching and follow the VMS rules without compromise.

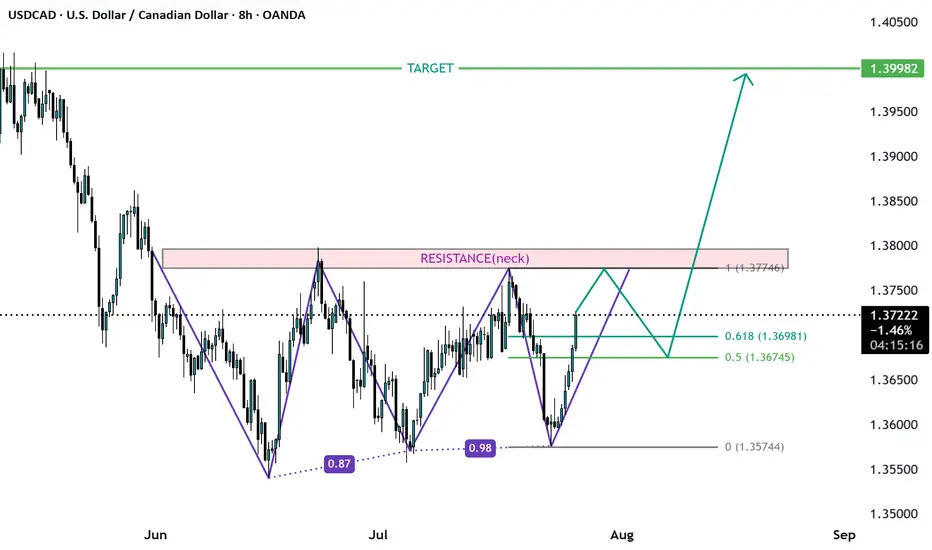
USDCAD Triple Bottom? Ready for long run?USDCAD formed a triple bottom on high time frame and is likely to Reach target of 1.4. the third bottom is also formed and is about finish soon the pattern. Enter the trade when the neck is broken or if the price come to 0.5 fib level from this bottom level.
GBP_USD LONG FROM SUPPORT|
✅GBP_USD has been falling recently
And the pair seems locally oversold
So as the pair is approaching
A horizontal support of 1.3399
Price growth is to be expected
LONG🚀
✅Like and subscribe to never miss a new idea!✅
Disclosure: I am part of Trade Nation's Influencer program and receive a monthly fee for using their TradingView charts in my analysis.

EURUSD - Next Buy Zone? This one has some nice potential
We will see how it plays out if we get tagged in

EURUSD pullback short- 25/7/25Price failed to break through the supply zone above that was identified on the higher 4hr and 1hr TF.
The last unmitigated zone is highlighted in green and looking to take a short from there to the next low.
There is equal level liquidity below that will draw price there.
In addition the HH is just a wick giving me more confidence that there is weakness in the EUR.

GBPUSD BUYGBP/USD drops to 1.3450 area after weak UK Retail Sales data
GBP/USD continues to push lower after closing in negative territory on Thursday and trades near 1.3450 on Friday. Weaker-than-expected Retail Sales data from the UK and the broad-based US Dollar strength forces the pair to stay on the back foot heading into the weekend
GBP/USD came under bearish pressure on Thursday and lost more than 0.5%, snapping a three-day winning streak in the process. The pair extends its slide on Friday and trades below 1.3500.
The renewed US Dollar (USD) strength weighed on GBP/USD on Thursday. The US Department of Labor reported that the number of first-time applications for unemployment benefits declined to 217,000 in the week ending July 19 from 221,000 in the previous week. This reading came in better than the market expectation of 227,000. Additionally, the S&P Global Composite Purchasing Managers Index (PMI) improved to 54.6 (preliminary) in July from 52.9 in June, reflecting an ongoing expansion in the private sector's business activity, at an accelerating pace.
Meanwhile, the EUR/GBP cross rose more than 0.3% on Thursday as the Euro benefited from the European Central Bank's (ECB) cautious tone on policy-easing. EUR/GBP preserves its bullish momentum and trades at its highest level since early April above 0.8700 on Friday, suggesting that the Euro continues to capture capital outflows out of Pound Sterling.
Early Friday, the UK's Office for National Statistics reported that Retail Sales rose by 0.9% on a monthly basis in June. This reading followed the 2.8% decrease recorded in May but came in worse than the market expectation for an increase of 1.2%, making it difficult for GBP/USD to stage a rebound.
In the second half of the day, Durable Goods Orders data for June will be the only data featured in the US economic calendar. Nevertheless, this data is unlikely to have a long-lasting impact on the USD's valuation.
SUPPORT 1.34550
SUPPORT 1.34982
SUPPORT 1.35421
RESISTANCE 1.33990
RESISTANCE 1.33698

EUR-CAD Risky Short! Sell!
Hello,Traders!
EUR-CAD is trading in a
Strong uptrend so we are
Bullish biased long-term
However a strong horizontal
Resistance is ahead at 1.6110
And the pair is overbought
So after the retest of the
Resistance we will be
Expecting a bearish correction
Sell!
Comment and subscribe to help us grow!
Check out other forecasts below too!
Disclosure: I am part of Trade Nation's Influencer program and receive a monthly fee for using their TradingView charts in my analysis.

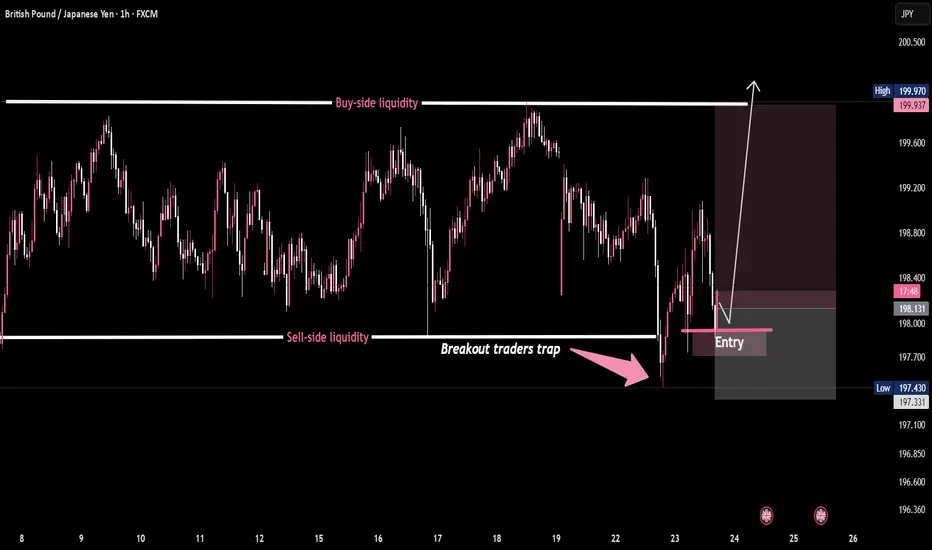
GBP/JPY - Classic Breakout Trap in PlayPrice nuked below range lows to sweep sell-side liquidity, trapping breakout sellers.
Smart money scooped it up. Entry reclaimed — now eyeing buy-side liquidity above 🎯
This is how the game is played:
1️⃣ Liquidity grab
2️⃣ Breakout trap
3️⃣ Reclaim & reverse
4️⃣ Target resting orders up top 🚀
📈 GBP/JPY – Classic Breakout Trap in Play 🧠💥
I'm optymist. 1.183-1.185 In front us3 year channel saying that we should to touch it.
Yellow line.
Before us
In my opinion before us is level. 1.18-1.20 before bigger correction until 1.12 even.
Then in few month i see 1.4-1.6

Long USDCADUCAD has showed good candlestick formation, rejects on trendline. I am going to buy this, targeting to fibo 4.23.


GBP_NZD BEARISH BREAKOUT|SHORT|
✅GBP_NZD is going down currently
As the pair broke the key structure level of 2.2400
Which is now a resistance, and after the pullback
And retest, I think the price will go further down
SHORT🔥
✅Like and subscribe to never miss a new idea!✅
Disclosure: I am part of Trade Nation's Influencer program and receive a monthly fee for using their TradingView charts in my analysis.

AUDUSD 60/15 Pullback ShortSeeing the market shifted from bull to bear. Looking for a pullback and short.
There is strong sell above, possible to quick probe that then drop.
Monitor.

GBP-USD Support Ahead! Buy!
Hello,Traders!
GBP-USD went down but
The pair will soon hit a
Horizontal support level
Of 1.3400 from where we
Will be expecting a local
Rebound and a move up
Buy!
Comment and subscribe to help us grow!
Check out other forecasts below too!
Disclosure: I am part of Trade Nation's Influencer program and receive a monthly fee for using their TradingView charts in my analysis.

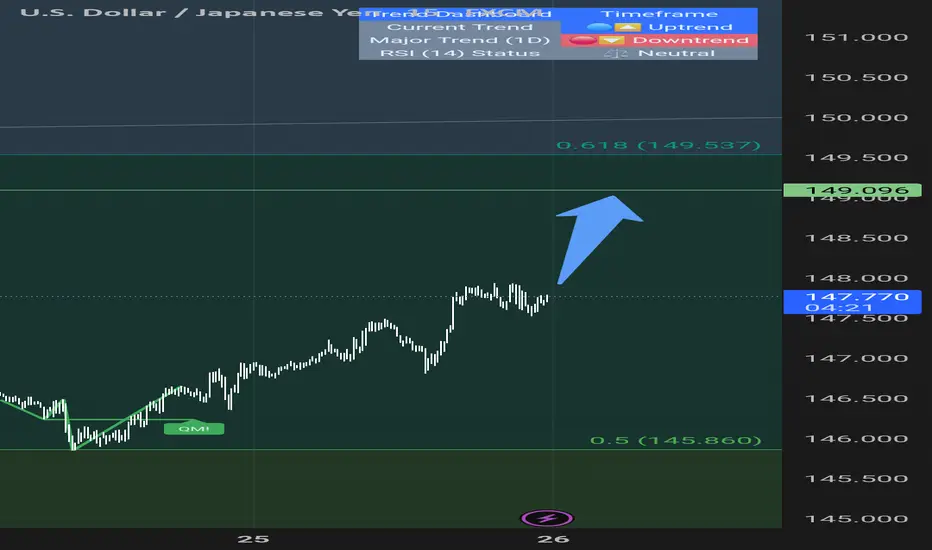
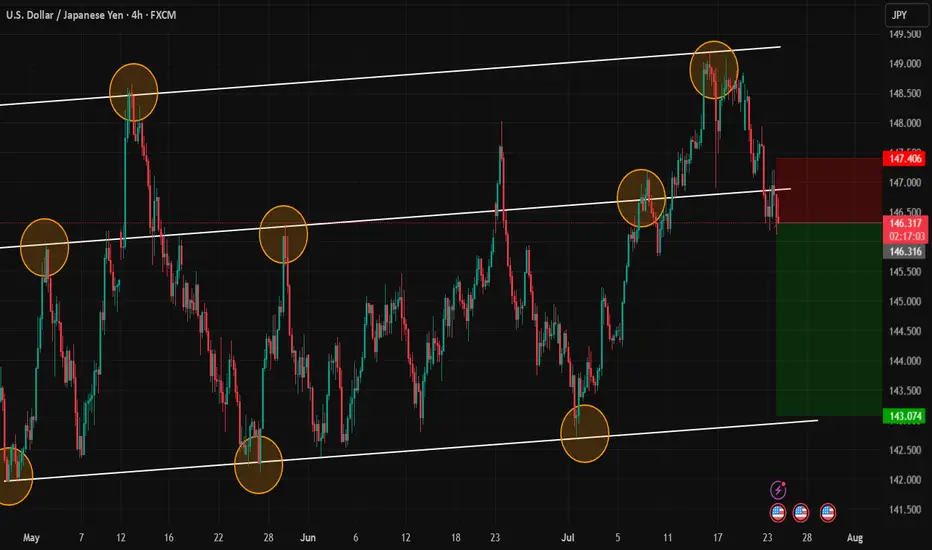
USDJPY SELLUSD/JPY rises further and approaches 148.00 as the US Dollar firms up
The US Dollar rallies for the second consecutive day against the Yen, and approaches 148.00. Strong US data support the Fed's "wait and see" stance and underpin demand for the US Dollar. In Japan, the uncertain political context is likely to deter the BoJ from hiking interest rates further.
Previous market optimism is turning into caution as the market shifts its focus to the monetary policy reports by the Bank of Japan and the US Federal Reserve due next week.
The Fed is widely expected to leave interest rates unchanged next week, more so after the strong US business activity and Jobless Claims figures released on Thursday. These data confirmed that the US economy remains resilient with a healthy labour market, which gives further leeway for the Fed to await further insight into the impact of tariffs before resuming rate cuts. The US Dollar has been trading higher following Thursday’s releases.
Also on Thursday, US President Trump paid an unusual visit to the Federal Reserve, only a few days ahead of their monetary policy meeting. Trump complained about the overcosts of the headquarters’ renovation and pressed for a less restrictive monetary policy, but his unusually soft comments after the visit eased investors’ concerns about the previous attacks on the central bank's independence.
In Japan, the somewhat softer Tokyo inflation figures seen on Friday and the trade deal would help the BoJ to continue hiking interest rates, but the bank is likely to stand pat next week and probably delay further monetary tightening until the political situation clarifies. This is likely to keep the Yen upside attempts subdued in the near-term.
SUPPORT 147.642
SUPPORT 147.311
SUPPORT 146.854
RESISTANCE 148.206
RESISTANCE 147.972
