Analysis on the Nite Elite PairsYou can follow us for more Analysis(Images and Videos) with Precise definition of the Financial Market.ENJOY!!!
Forex market

EURUSD BuyPrice did a ‘LG’ off the ‘POI’(looking left). Daily cycle not fully complete. Price should take out asia high.

EURJPY ANALYSISAfter seeing the previous daily candle close as an engulfing and trading below the moving average we could be looking for further sell off but with the fundamentals coming out for the day we could see slowed movement till the news comes out

EURUSD 3:1 Intraday SnipeThe H4 Doji on resistance
The downtrend on H4 H1 and M15
We are just shorting to next support
With a stop above m15 / h1 resistance nearest one - pretty solid also
3:1 Risk Reward
75%-80% odds (my rank)

EURJPY Bearish continuationAfter daily closed with strong bearish engulfing, i'm expecting another bearish movement today.
Asian session we saw price moving down broke 172 price level.
I plan to wait at 172 area to enter sell.
calculate your own risk & reward.
Good Luck

GBPUSD Week 31 Swing Zone/LevelsPEPPERSTONE:GBPUSD keeps giving and simply does.
Strategy for this week is highlighted; sell at the zone and look for buy around 33683.
Zones/Levels are calculated based previous Week X's difference High & Low (dHL)
Trade Parameters:
sl: 10-15pips
dTP: dynamic TP means because momentum can push fast past say 33683, TP is a soft target. However typically 5-10x
As always price action determines trades.

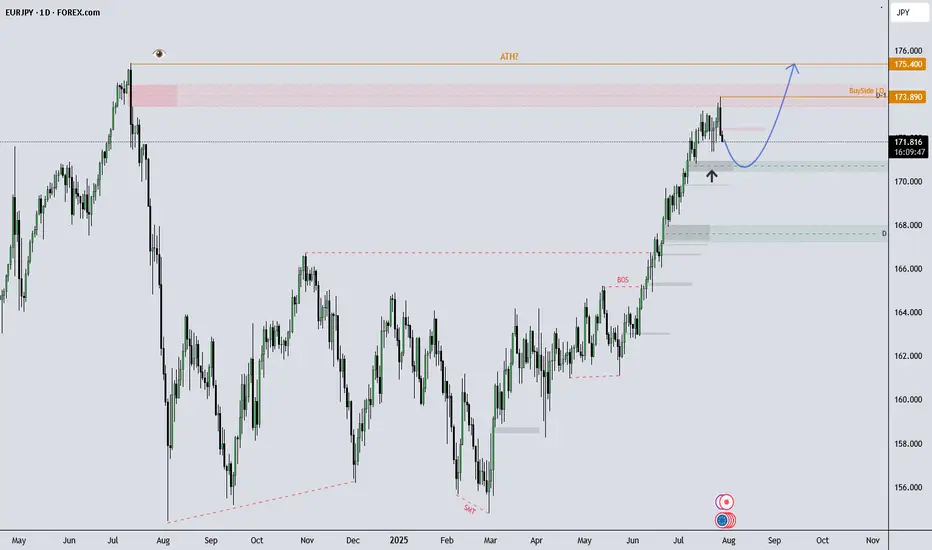
EURJPY Eyes New Highs After Pullback?What I see!
EURJPY Technical Outlook –
EURJPY remains in a strong uptrend and recently tapped into buy-side liquidity at 173.89, which now marks the All-Time High (ATH). After a brief rejection from that level, price is currently showing signs of a healthy pullback.
I’m observing the 170.00–171.00 zone, which aligns with previous demand. If price continues to respect this area, the overall bullish structure remains intact, with potential for a move back toward (and possibly beyond) the ATH.
A sustained break below 170.00 could indicate room for a deeper pullback, potentially toward the 168.00s, which would be a key area to monitor.
This analysis is shared for educational and discussion purposes only.
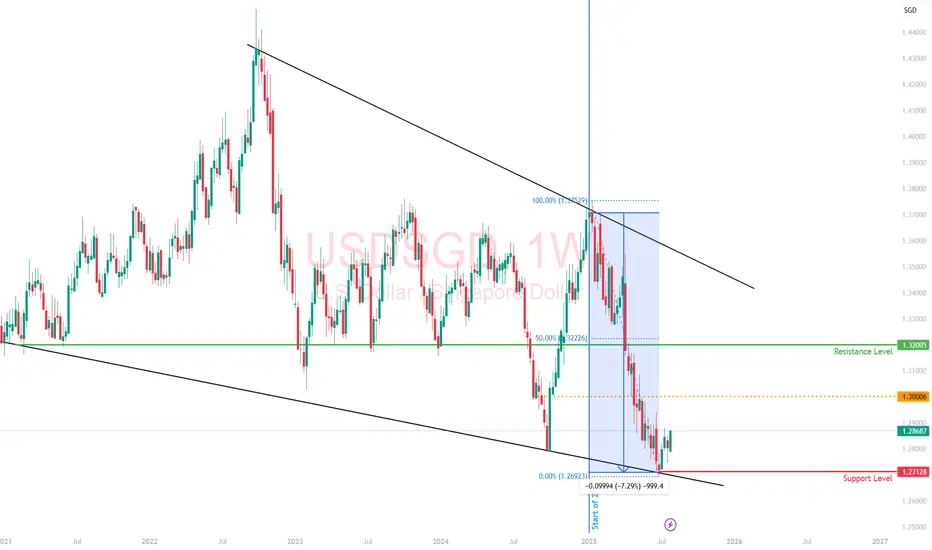
Singapore Dollar: Asia’s Quiet Safe Haven with Eyes on ParityThe Singapore dollar has quietly emerged as one of the strongest performers in Asia, gaining over 7% against the US dollar this year.
While much of the FX world fixates on the yen or franc in times of uncertainty, the SGD is carving out a niche as a regional safe-haven, driven not by size or liquidity, but by credibility.
The strength in the SGD isn’t just about USD weakness. Singapore's macro fundamentals
budget surpluses,
robust reserves, and
deep-rooted investor confidence
offer a kind of quiet strength that traders tend to overlook until it becomes obvious.
This makes the SGD a compelling hedge against both regional turmoil and global dollar decay.
As more global capital looks for stable homes outside of the traditional, Singapore’s financial system and currency are set to benefit.
The idea of SGD hitting parity with the USD, once dismissed as unrealistic, is now getting serious attention.
Analysts have suggested that it could happen within five years, but I wouldn’t be surprised if it comes sooner!
The greenback’s structural issues of twin deficits, political gridlock, and de-dollarization headwinds are no longer theoretical.
That said, liquidity is still a constraint. The SGD makes up just 2% of global FX turnover, and the MAS actively manages the currency to avoid excessive volatility.
This means that while the long-term trend favors SGD appreciation, traders betting on a rapid sprint to parity may be left waiting.
In my view, the SGD is one of the most underappreciated macro trades in FX.
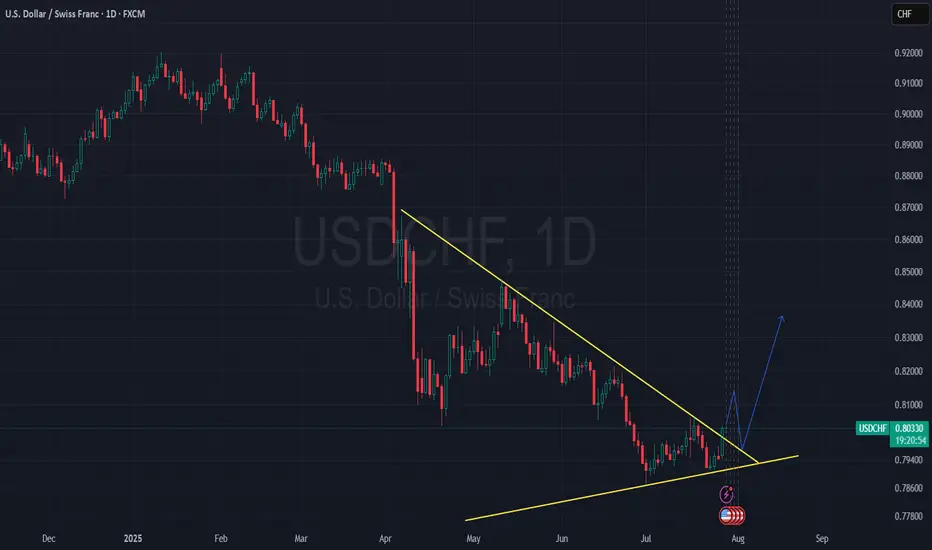
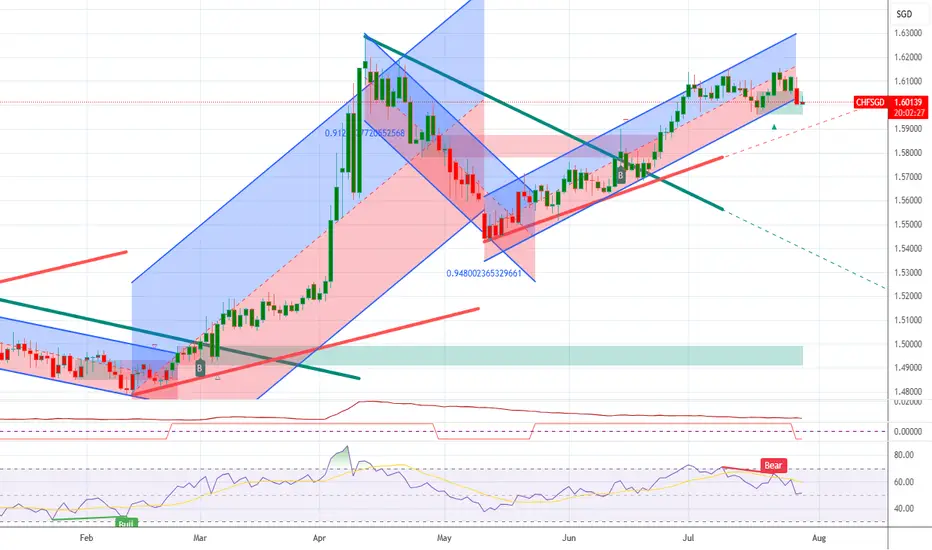
USD/CHF Just Broke Out of an Ascending Triangle - LONG📈 Price has just broken out of an ascending triangle pattern.
I’m now patiently waiting for a retest of the breakout zone to explore a potential long opportunity.
Let’s see if the market gives us a clean entry! 💹🧠


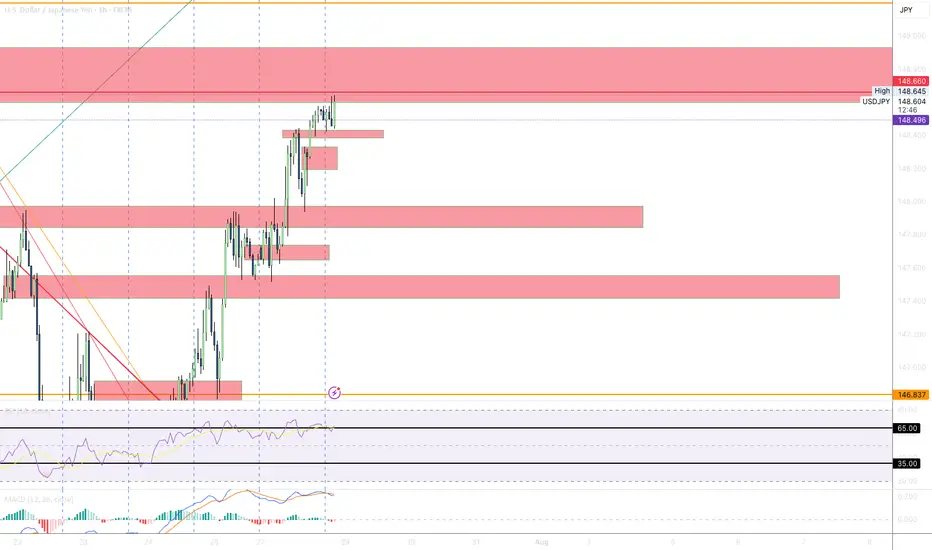
USD/JPY(20250729)Today's AnalysisMarket news:
After gold prices soared to an all-time high of more than $3,500 an ounce in April, the latest report from the Commodity Futures Trading Commission (CFTC) showed that fund managers have increased their bullish bets to the highest level in 16 weeks.
Technical analysis:
Today's buy and sell boundaries:
148.19
Support and resistance levels:
149.23
148.84
148.59
147.78
147.53
147.14
Trading strategy:
If the price breaks through 148.59, consider buying, the first target price is 148.84
If the price breaks through 148.19, consider selling, the first target price is 147.78


Trade management for NZD/AUDThe US-EU trade deal boosted USD demand and jolted FX markets at the open. This, coupled with low liquidity during the Monday Asian session caused a gap in this pair. Our short term trade was taken out at break even, while our medium term trade narrowly survived. This was a technical play in an odd pair, opportunistic while doing some charting :) I took profit at 1:1 and will wait to deploy capital elsewhere.


Super Sell!Hello all. as you see market reaches to an LOZ and it needs a historical low. As DXY will increasing, it it will falling. Effect of tariff started. be happy and have a super great week(wink)

USDJPYCurrently in an Up Trend, how every momentum seems to be slowing down. Short-term Trend reversal in the bear direction perhaps. I'm about to re-mark up my chart so this is just archive mark-up.
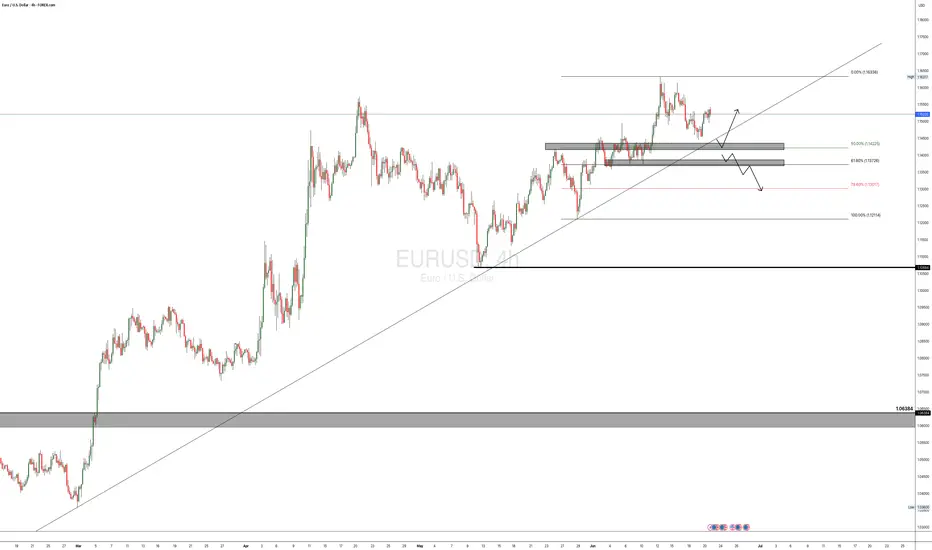
EURUSD POSSIBLE TRADE SETUP💶 Potential Trade Setup on EURUSD
Overview:
Since March, EURUSD has shown consistent bullish momentum, especially after breaking through the key 1.0600 supply zone.
The pair has maintained higher highs and higher lows, suggesting continued strength in the medium term.
That said, I am still quite anticipating for a possible continuation of the bullish momentum that started a long time ago, and moving forward, I will anticipate for a clear retest of the 50% fib at the 1.1425 region, then I go in for the kill.
Alternatively, there is a clear short opportunity, provided that, the bullish trendline is broken and the 1.1370 region is broken to the downside, this is a bit far a stretch, but it is in play. "IF" the DXY keeps the bullish momentum going.
🧭 Trading Plan:
✅ BUY Bias (Primary Plan):
Look for a retest of the 50% Fibonacci retracement zone around 1.1425. This aligns with the ongoing momentum on the 4H timeframe.
🔻 SELL Bias (Alternative Scenario):
If price breaks the bullish trendline and the 1.1370 support zone, a short opportunity opens up.
This is only valid if DXY continues to strengthen, shifting sentiment.
🎯 Targets & Risk Management: Targeting 1:2 R:R on both setups.
Ensure entries are backed by price action signals and confluences.
GBP/USD Outlook Analyse TechniqueThe daily structure remains bullish, but price is currently retracing deeper, likely targeting unfilled areas
On the 4H timeframe, price has:
Formed a valid demand zone
Left an imbalance just above that demand
Engineered liquidity below the zone, increasing the probability of a sweep
📍 Strategy:
Wait for price to mitigate the 4H demand zone and sweep the liquidity beneath
Then, drop to lower timeframes (M5–M15 for the confirmation entry FX:GBPUSD ) and look for:
CHoCH (Change of Character)
Internal BOS
Bullish order flow for a safe entry

EUR-NZD Will Grow! Buy!
Hello,Traders!
EUR-NZD keeps falling
Down and we are bearish
Biased mid-term but there is
A horizontal support level
Below at 1.9370 so after
The retest we might expect
A local bullish correction
Buy!
Comment and subscribe to help us grow!
Check out other forecasts below too!
Disclosure: I am part of Trade Nation's Influencer program and receive a monthly fee for using their TradingView charts in my analysis.

GBP_CAD RISKY SETUP|LONG|
✅GBP_CAD is going down to retest
A horizontal support of 1.8320
Which makes me locally bullish biased
And I think that we will see a rebound
And a move up from the level
Towards the target above at 1.8380
LONG🚀
✅Like and subscribe to never miss a new idea!✅
Disclosure: I am part of Trade Nation's Influencer program and receive a monthly fee for using their TradingView charts in my analysis.

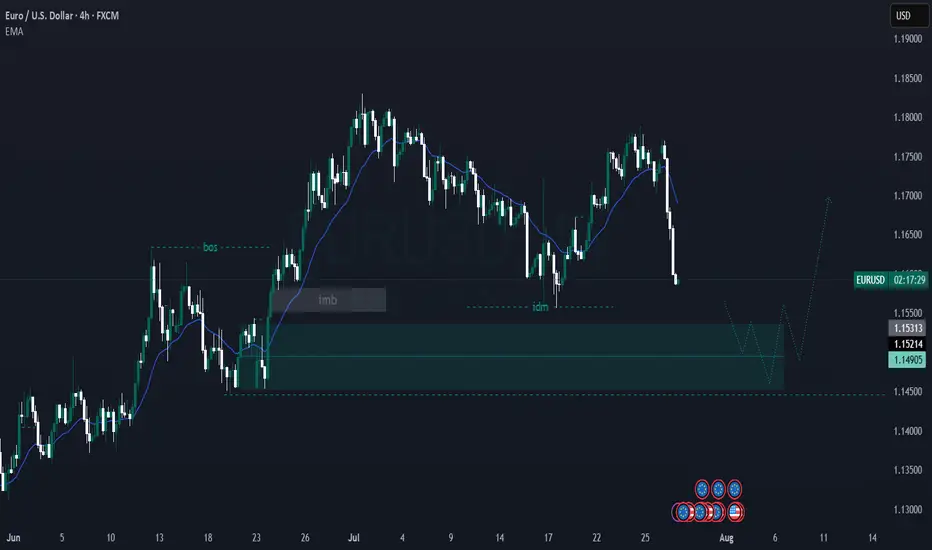
EUR/USD – 4H Technical Analysis AnticipatingPrice is currently in a bullish structure, printing consecutive Breaks of Structure (BOS) to the upside, confirming strong bullish momentum FX:EURUSD FX:EURUSD
On the 4H timeframe, price has:
Left behind an imbalance, signaling inefficiency in price delivery
Formed an unmitigated demand zone (internal OB) that aligns with bullish order flow
We now wait for price to return to this zone for a potential mitigation
📍 Plan of Action:
Monitor the mitigation area
Drop down to the 15-minute timeframe
Look for LTF (lower timeframe) confirmation: CHoCH, BOS, and internal structure shift before entering