USDJPY Forming Bullish Reversal | MMC Analysis + Target🧠 Chart Overview (2H Timeframe)
🔸 1. Head and Shoulders Inverse Pattern – MMC Bullish Blueprint
The chart beautifully shows an Inverse Head & Shoulders pattern, one of the most powerful reversal signals under MMC logic:
Left Shoulder: Formed after the initial drop and quick recovery.
Head : Deep liquidity grab and reversal from the lowest point (demand zone).
Right Shoulder: Higher low structure, indicating reduced selling pressure and shift in momentum.
This pattern is forming around a previous liquidity zone, which makes it more valid and aligned with smart money behavior.
🔸 2. Retesting Zone – Critical MMC Demand Area
Price is now retesting a highlighted demand zone, which acted as the springboard for the previous bullish move:
Bullish Pattern marked aligns with MMC’s concept of “Return to Origin”.
This zone also sits just above the right shoulder, confirming that buyers are defending aggressively.
If this level holds, we may see a strong continuation move to the upside.
🔸 3. Previous Reversal Zone (Supply) – Next Target Area
Marked in light green, this area is the next critical resistance:
Acts as liquidity target for institutions if price rallies.
Historically acted as a major reversal point.
Price is likely to show reactions or profit-taking behavior here.
Once broken and retested, it becomes a new support for further upside continuation (as marked on the chart).
🔸 4. Dual Scenarios – Bullish vs Bearish Pathways
Your chart correctly outlines two strategic possibilities:
✅ Bullish Scenario:
Price respects demand zone.
Breaks above previous reversal zone (149.000+).
Bullish continuation toward 149.800–150.500 range.
MMC tip: “If it goes bullish, use previous demand or double it” = Add confluence or stack demand zones for scale-in entries.
❌ Bearish Scenario:
If price breaks below retesting zone, bullish invalidation triggers.
Look to the previous all supply zone (Zone Pattern Must) for next reaction.
This scenario reflects smart money rejection of upside continuation.
🗂️ MMC Structural Elements Identified:
Zone/Pattern Role in Analysis
Inverse H&S Trend reversal signal
Retesting Zone Demand/entry area
Previous Reversal Zone First key resistance / next liquidity pool
Supply Zone Below Target in case of downside breakdown
MMC Logic Follow price structure, fakeouts, demand/supply traps
📈 Summary Outlook:
USDJPY is showing a technical bullish structure backed by MMC-based price psychology. The current pullback into a demand zone gives traders an excellent R:R opportunity for long positions, targeting higher zones upon breakout confirmation.
🟩 If bullish, breakout >149.000 will likely lead toward 150.000+
🟥 If bearish, breakdown <147.600 opens doors to deeper drop toward 146.000 zone (watch for reversal pattern).
🔑 Key Levels to Watch:
Type Level Range Notes
Support 147.600–147.800 Current retesting demand
Resistance 148.800–149.300 Previous Reversal Zone (Profit booking area)
Higher Resistance 150.500+ Final upside objective
Breakdown Zone <147.500 Flip to bearish scenario
Forex market

USDJPY – Liquidity Grab Before Continuation Down
**📉 USDJPY – Liquidity Grab Before Continuation Down**
📍 *Update to previous publication*
Following further technical analysis, the current price action suggests a **short-term bullish move** on USDJPY — likely acting as a **liquidity grab over previous session highs**.
This corrective movement is expected **before price resumes its broader bearish direction**.
🔍 Key observations:
* Price may seek short-term buy-side liquidity above recent highs.
* Liquidity engineering likely, especially around the **148.800 zone**.
* My **bias remains bearish**, but only **after liquidity is taken** and structure confirms a reversal.
Waiting for signs of exhaustion or confirmation around the upper FVG to align with the primary short thesis.
---DO NOT USE AS SIGNAL OR ANY OF A KIND--
EMERSON MASSAWE
COO | FINANCIAL MARKET ANALYST 6+

GBP/USD Technical Breakdown – Bearish Reversal in PlayWe're closely watching the British pound vs the US dollar on the daily chart, and recent developments are signaling a notable shift in momentum:
🔹 Break of the 2025 uptrend
🔹 Completion of a Head & Shoulders top — a classic bearish reversal pattern
🔹 Neckline break confirms downside risk
This formation implies a measured move target from ~1.34–1.38, projecting a decline of 400 pips to around 1.30, aligning neatly with the 200-day moving average at 1.2977.
🧭 Trading Strategy:
While the initial breakdown is bearish, the RSI shows bullish divergence, suggesting a short-term bounce before resumption of downside.
Key resistance levels to watch for re-entry opportunities:
• 📌 1.3435 – previous highs (late 2024)
• 📌 1.3485 – broken uptrend
• 📌 1.3510 – 55-day moving average
• 📌 1.3530 – short-term downtrend line
🎯 A rally into this zone would offer a strategic entry point for downside exposure.
Let us know how you're trading this move — are you fading the rally or waiting for confirmation?
Disclaimer:
The information posted on Trading View is for informative purposes and is not intended to constitute advice in any form, including but not limited to investment, accounting, tax, legal or regulatory advice. The information therefore has no regard to the specific investment objectives, financial situation or particular needs of any specific recipient. Opinions expressed are our current opinions as of the date appearing on Trading View only. All illustrations, forecasts or hypothetical data are for illustrative purposes only. The Society of Technical Analysts Ltd does not make representation that the information provided is appropriate for use in all jurisdictions or by all Investors or other potential Investors. Parties are therefore responsible for compliance with applicable local laws and regulations. The Society of Technical Analysts will not be held liable for any loss or damage resulting directly or indirectly from the use of any information on this site.

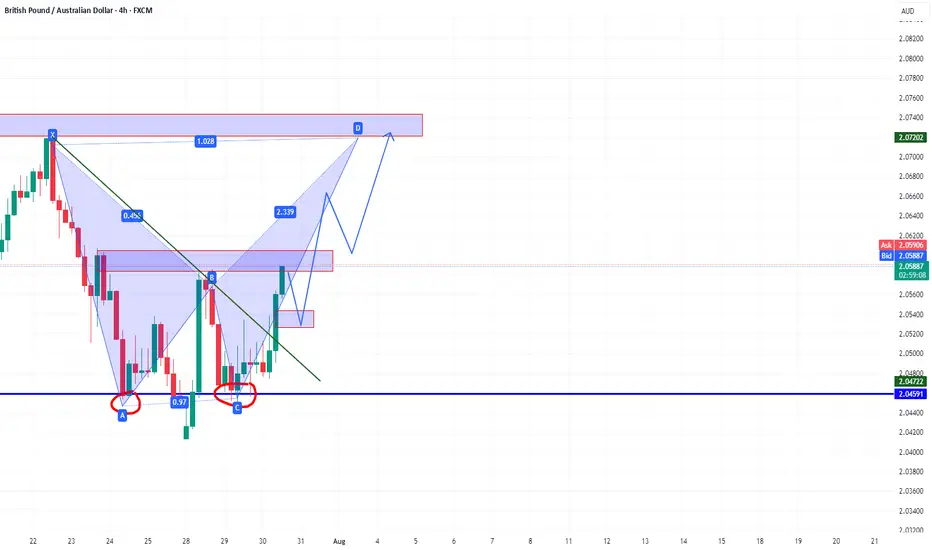
GBPAUD bullish potentialGBPAUD is showing bullish potential after forming a double bottom around the key support zone at 2.0459. A bullish harmonic pattern is unfolding, with a potential move toward the 2.0720–2.0740 resistance zone. The break of the downtrend line adds confirmation, and a pullback to 2.0530–2.0550 could offer a good re-entry area. As long as price stays above 2.0450, the bullish setup remains valid. The key target is the harmonic D completion zone.
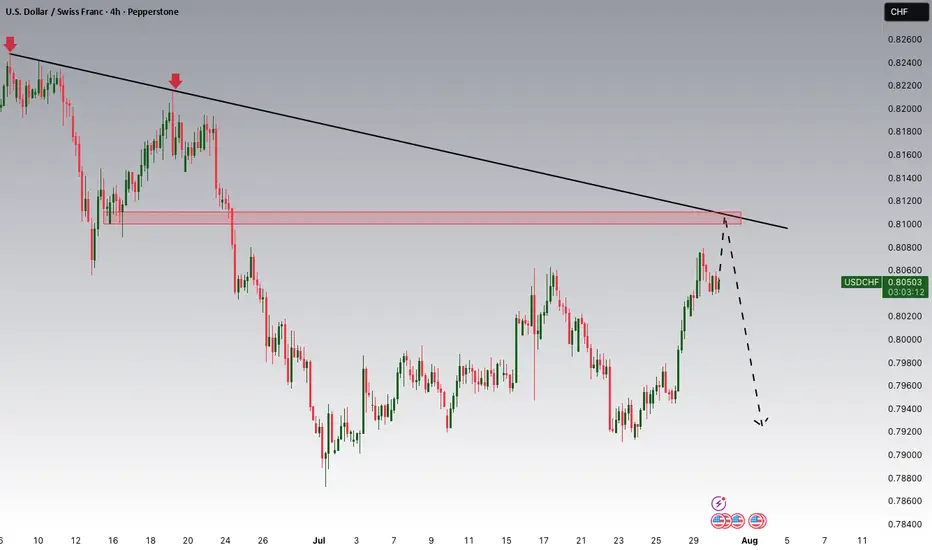
USDCHF Potential DownsidesHey Traders, in today's trading session we are monitoring USDCHF for a selling opportunity around 0.81000 zone, USDCHF is trading in a downtrend and currently is in a correction phase in which it is approaching the trend at 0.81000 support and resistance area.
Trade safe, Joe.

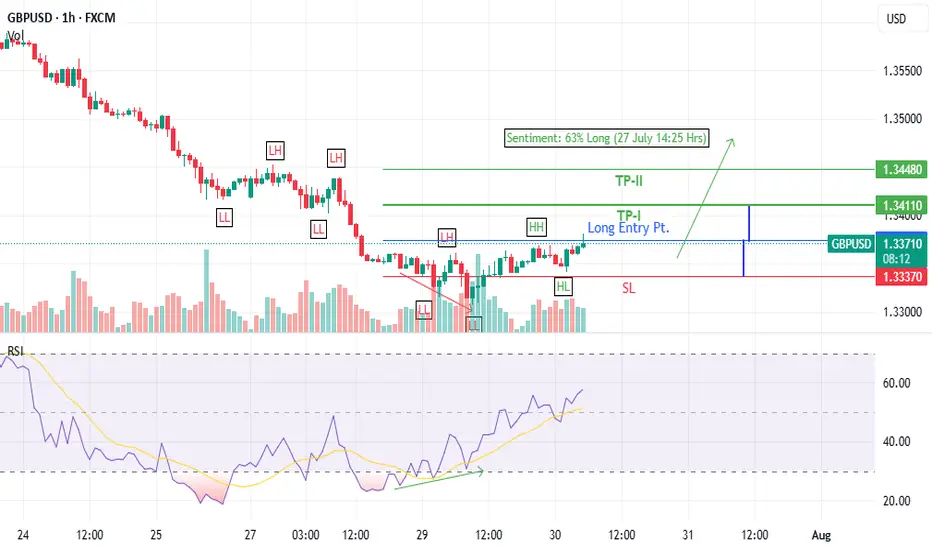
GBPUSD Long trade idea (30 July 2025)- Bullish Divergence on 1-H time frame
- Last LH broken at 1.3361
- Entered at CMP (1.33736)
AUDUSD Potential UpsidesHey Traders, in today's trading session we are monitoring AUDUSD for a buying opportunity around 0.64900 zone, AUDUSD is trading in an uptrend and currently is in a correction phase in which it is approaching the trend at 0.64900 support and resistance area.
Trade safe, Joe.

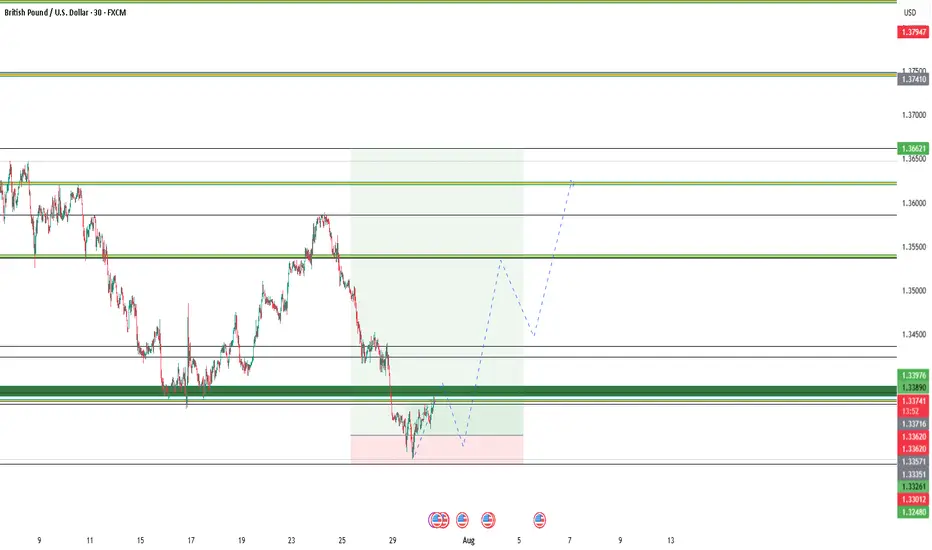
GBPUSD SWING TRADE AUGUSTTaking support from last month's low and now swing trade opportunity forming.
follow for more swing analysis on indices, commodities and currecies.
Live market analysis.
test the accuracy by reviewing my previous analysis of trades i took and published.
EUR/USD Hits Lowest Level Since Early JulyEUR/USD Hits Lowest Level Since Early July
As the EUR/USD chart indicates today, the euro has fallen below the 1.1550 mark against the US dollar, reaching the lows of June 2025. As a result, July may become the first month in 2025 to record a decline in the currency pair.
Why Is EUR/USD Declining?
There are two key factors driving the euro’s weakness relative to the US dollar:
→ Anticipation of the Federal Reserve Meeting. At 21:00 GMT+3 today, the Fed’s interest rate decision will be released. According to Forex Factory, analysts expect the Federal Funds Rate to remain unchanged at 4.25%-4.50%.
→ Market Reaction to the US-EU Trade Agreement. The trade deal signed last weekend between the United States and Europe is being critically assessed by market participants.
As noted in our Monday analysis, signs of a bearish takeover emerged on the chart following the agreement’s signing. Since then, EUR/USD has declined by approximately 1.3%. The question now is whether the downtrend will continue.
Technical Analysis of the EUR/USD Chart
The upward channel that had remained valid since mid-May was decisively broken by bears this week. The nature of the breakout (highlighted by the red arrow) was particularly aggressive, with the price dropping from the 1.1710 level to the D point low without any meaningful interim recoveries.
Key observations include:
→ The drop has resulted in a classic bearish A-B-C-D market structure, characterised by lower highs and lower lows.
→ On the 4-hour timeframe, the RSI indicator has fallen into oversold territory, reaching its lowest point of 2025 so far.
→ Notably (as highlighted by the blue arrow), there was a strong rebound from the 1.1455 support level earlier. Bulls demonstrated significant strength at that time, breaking through the R resistance line.
Given these factors, we could assume that after this week’s sharp decline, EUR/USD may attempt a short-term recovery from the support zone (highlighted in purple). Should this scenario unfold, potential resistance may emerge near the 1.1630 level, as this area aligns with:
→ The 50% Fibonacci retracement of the C→D decline;
→ The breakout point of the lower boundary of the previous ascending channel, indicating a shift in market balance in favour of the bears.
This article represents the opinion of the Companies operating under the FXOpen brand only. It is not to be construed as an offer, solicitation, or recommendation with respect to products and services provided by the Companies operating under the FXOpen brand, nor is it to be considered financial advice.

USDHUF is BullishPrice was in a downtrend, and respecting the descending trendline. However the bullish divergence coupled with double bottom reversal pattern hints that bulls are assuming control of the price action. If previous lower high is broken with good volume then we can expect a bullish reversal as per Dow theory. Targets are mentioned on the chart.

USDJPY – DAILY FORECAST Q3 | W31 | D30 | Y25📊 USDJPY – DAILY FORECAST
Q3 | W31 | D30 | Y25
Daily Forecast 🔍📅
Here’s a short diagnosis of the current chart setup 🧠📈
Higher time frame order blocks have been identified — these are our patient points of interest 🎯🧭.
It’s crucial to wait for a confirmed break of structure 🧱✅ before forming a directional bias.
This keeps us disciplined and aligned with what price action is truly telling us.
📈 Risk Management Protocols
🔑 Core principles:
Max 1% risk per trade
Only execute at pre-identified levels
Use alerts, not emotion
Stick to your RR plan — minimum 1:2
🧠 You’re not paid for how many trades you take, you’re paid for how well you manage risk.
🧠 Weekly FRGNT Insight
"Trade what the market gives, not what your ego wants."
Stay mechanical. Stay focused. Let the probabilities work.
FX:USDJPY

Market Analysis: USD/CHF Consolidates GainsMarket Analysis: USD/CHF Consolidates Gains
USD/CHF is rising and might aim for a move toward the 0.8120 resistance.
Important Takeaways for USD/CHF Analysis Today
- USD/CHF is showing positive signs above the 0.8040 resistance zone.
- There is a connecting bullish trend line forming with support at 0.7990 on the hourly chart.
USD/CHF Technical Analysis
On the hourly chart of USD/CHF at FXOpen, the pair started a decent increase from the 0.7910 support. The US Dollar climbed above the 0.8000 resistance zone against the Swiss Franc.
The bulls were able to pump the pair above the 50-hour simple moving average and 0.8040. A high was formed at 0.8079 and the pair is now consolidating gains above the 23.6% Fib retracement level of the upward move from the 0.7911 swing low to the 0.8079 high.
There is also a connecting bullish trend line forming with support at 0.7990. On the upside, the pair is now facing resistance near 0.8080. The main resistance is now near 0.8120.
If there is a clear break above the 0.8120 resistance zone and the RSI remains above 50, the pair could start another increase. In the stated case, it could test 0.8200. If there is a downside correction, the pair might test the 0.7990 level.
The first major support on the USD/CHF chart is near the 0.7950 level and the 76.4% Fib retracement level.
The next key support is near 0.7910. A downside break below 0.7910 might spark bearish moves. Any more losses may possibly open the doors for a move towards the 0.7850 level in the near term.
This article represents the opinion of the Companies operating under the FXOpen brand only. It is not to be construed as an offer, solicitation, or recommendation with respect to products and services provided by the Companies operating under the FXOpen brand, nor is it to be considered financial advice.

Market Analysis: EUR/USD Dips FurtherMarket Analysis: EUR/USD Dips Further
EUR/USD extended losses and traded below the 1.1600 support.
Important Takeaways for EUR/USD Analysis Today
- The Euro struggled to clear the 1.1800 resistance and declined against the US Dollar.
- There is a key downward channel forming with resistance at 1.1575 on the hourly chart of EUR/USD.
EUR/USD Technical Analysis
On the hourly chart of EUR/USD at FXOpen, the pair failed to clear the 1.1800 resistance. The Euro started a fresh decline below the 1.1720 support against the US Dollar.
The pair declined below the 1.1660 support and the 50-hour simple moving average. Finally, it tested the 1.1520 level. A low was formed at 1.1519 and the pair is now consolidating losses. The market is showing bearish signs, and the upsides might remain capped.
There was a minor increase toward the 23.6% Fib retracement level of the downward move from the 1.1770 swing high to the 1.1519 low. Immediate resistance on the upside is near the 1.1575 level.
There is also a key downward channel forming with resistance at 1.1575. The next major resistance is near the 1.1665 zone and the 50-hour simple moving average or the 50% Fib retracement level.
The main resistance sits near the 1.1770 level. An upside break above the 1.1770 level might send the pair towards 1.1800. Any more gains might open the doors for a move towards 1.1850.
On the downside, immediate support on the EUR/USD chart is seen near 1.1520. The next major support is near the 1.1465 level. A downside break below 1.1465 could send the pair towards 1.1350.
This article represents the opinion of the Companies operating under the FXOpen brand only. It is not to be construed as an offer, solicitation, or recommendation with respect to products and services provided by the Companies operating under the FXOpen brand, nor is it to be considered financial advice.

Fundamental Market Analysis for July 30, 2025 EURUSDEvents to watch today:
30.07 15:30 EET. USD - Gross Domestic Product
30.07 21:30 EET. USD - FOMC Rate Decision
EURUSD:
Exclusive for our readers – a 202% bonus on deposits of $202 or more! Give the promo code PROFIT202 to customer support and start trading with TRIPLED capital.
EUR/USD remains under pressure amid stronger demand for the US Dollar ahead of the Federal Reserve decision (July 30, 2025). Market sentiment reflects the perception that the recent US–EU trade arrangements are relatively more favorable for the US economy, reinforcing expectations for stronger corporate earnings and a more supportive external balance in the coming months. Capital flows are skewed toward dollar-denominated assets, also because investors prefer to wait out key central‑bank communications in “quality” instruments.
A further driver is the divergence in macro momentum: the US economy shows greater resilience in consumption and labor markets, while the euro area faces constrained growth and a cautious ECB tone. With little reason for ECB tightening and with lingering risks for European industry and exports after tariff headlines, the euro’s fundamental support looks softer. Persisting uncertainty around the inflation path in the euro area adds to the preference for the USD.
Given these factors, the near‑term fundamental tilt remains to the downside for EURUSD. Risks to this view include unexpectedly dovish Fed communication, a pullback in US Treasury yields, and/or positive euro‑area data surprises that could improve growth expectations and support the euro.
Trading recommendation: SELL 1.15650, SL 1.16000, TP 1.15150

EURUSD – DAILY FORECAST Q3 | W31 | D30 | Y25📊 EURUSD – DAILY FORECAST
Q3 | W31 | D30 | Y25
Daily Forecast 🔍📅
Here’s a short diagnosis of the current chart setup 🧠📈
Higher time frame order blocks have been identified — these are our patient points of interest 🎯🧭.
It’s crucial to wait for a confirmed break of structure 🧱✅ before forming a directional bias.
This keeps us disciplined and aligned with what price action is truly telling us.
📈 Risk Management Protocols
🔑 Core principles:
Max 1% risk per trade
Only execute at pre-identified levels
Use alerts, not emotion
Stick to your RR plan — minimum 1:2
🧠 You’re not paid for how many trades you take, you’re paid for how well you manage risk.
🧠 Weekly FRGNT Insight
"Trade what the market gives, not what your ego wants."
Stay mechanical. Stay focused. Let the probabilities work.
FX:EURUSD

GJ Analysis on H4 30.7.25-TL on h4
- candle broke the uptrend TL and making HL LL hence the setup change to Short setup.
- There are 2 areas of short entry with its sL and both has the same area of TP.
We will see if this setup play out as planned.
#selfjournal
#practicetobefulltimetrader

EURCHF: Market of Buyers
Looking at the chart of EURCHF right now we are seeing some interesting price action on the lower timeframes. Thus a local move up seems to be quite likely.
Disclosure: I am part of Trade Nation's Influencer program and receive a monthly fee for using their TradingView charts in my analysis.
❤️ Please, support our work with like & comment! ❤️

GBPCHF: Another Bearish Signal?! 🇬🇧🇨🇭
Quick update for GBPCHF.
We discussed a strong bearish confirmation yesterday.
Today, we have one more.
The price formed a double top after a test of a strong intraday
falling trend line.
Its neckline was broken this morning.
I expect a retracement to 1.0735
❤️Please, support my work with like, thank you!❤️
I am part of Trade Nation's Influencer program and receive a monthly fee for using their TradingView charts in my analysis.

AUDNZD Technical + Fundamental Align for DownsideToday I want to analyze a short position on the AUDNZD ( OANDA:AUDNZD ) pair, first, let's look at it from a fundamental analysis perspective .
Fundamental View on AUDNZD
Key reasons to short AUDNZD:
Australian weakness:
Recent data show weakening consumer sentiment and declining building approvals. The RBA seems hesitant to hike further, putting pressure on the Aussie.
New Zealand resilience:
The RBNZ maintains a relatively hawkish stance. Inflation is still a concern, and the central bank is committed to keeping rates high, supporting NZD strength.
Monetary policy divergence:
The divergence between RBA’s dovish stance and RBNZ’s hawkish approach supports further downside in AUDNZD.
----------------------
Now let's take a look at AUDNZD from a technical analysis perspective on the 4-hour timeframe .
AUDNZD is currently trading in a Heavy Resistance zone(1.0963 NZD-1.0870 NZD) near the upper line of the Range Channel , Potential Reversal Zone(PRZ) and Yearly Pivot Point .
In terms of Elliott Wave theory , AUDNZD appears to be completing microwave B of microwave Y of the main wave 4 .
I expect AUDNZD to drop to at least 1.0904 NZD(First Target) based on the above explanation .
Second Target: 1.0886 NZD
Note: Stop Loss(SL): 1.0963 NZD
Please respect each other's ideas and express them politely if you agree or disagree.
Australian Dollar/New Zealand Dollar Analyze (AUDNZD), 4-hour time frame.
Be sure to follow the updated ideas.
Do not forget to put a Stop loss for your positions (For every position you want to open).
Please follow your strategy and updates; this is just my Idea, and I will gladly see your ideas in this post.
Please do not forget the ✅' like '✅ button 🙏😊 & Share it with your friends; thanks, and Trade safe.

AUDCAD – DAILY FORECAST Q3 | W31 | D30 | Y25
📊 AUDCAD – DAILY FORECAST
Q3 | W31 | D30 | Y25
Daily Forecast 🔍📅
Here’s a short diagnosis of the current chart setup 🧠📈
Higher time frame order blocks have been identified — these are our patient points of interest 🎯🧭.
It’s crucial to wait for a confirmed break of structure 🧱✅ before forming a directional bias.
This keeps us disciplined and aligned with what price action is truly telling us.
📈 Risk Management Protocols
🔑 Core principles:
Max 1% risk per trade
Only execute at pre-identified levels
Use alerts, not emotion
Stick to your RR plan — minimum 1:2
🧠 You’re not paid for how many trades you take, you’re paid for how well you manage risk.
🧠 Weekly FRGNT Insight
"Trade what the market gives, not what your ego wants."
Stay mechanical. Stay focused. Let the probabilities work.
FX:AUDCAD

DeGRAM | GBPUSD reached the lower boundary of the channel📊 Technical Analysis
● GBPUSD has broken out of a falling wedge within a descending channel, reclaiming the lower boundary of the broader structure.
● Price is consolidating just above 1.33160 support and appears ready to retest the 1.34650 resistance, aided by a series of higher lows and a bullish break of short-term trendlines.
💡 Fundamental Analysis
● Weakening USD sentiment continues after Friday’s softer core PCE and downward revision of Michigan inflation expectations.
● UK economic sentiment improved after recent wage growth and mortgage approval data exceeded forecasts, bolstering GBP.
✨ Summary
Breakout from wedge confirms bullish bias. Support at 1.33160; target 1.34650 short-term. Watch for rally continuation while holding above 1.33625.
-------------------
Share your opinion in the comments and support the idea with a like. Thanks for your support!

EURUSD Set To Grow! BUY!
My dear followers,
This is my opinion on the EURUSD next move:
The asset is approaching an important pivot point 1.1557
Bias - Bullish
Technical Indicators: Supper Trend generates a clear long signal while Pivot Point HL is currently determining the overall Bullish trend of the market.
Goal - 1.1632
About Used Indicators:
For more efficient signals, super-trend is used in combination with other indicators like Pivot Points.
Disclosure: I am part of Trade Nation's Influencer program and receive a monthly fee for using their TradingView charts in my analysis.
———————————
WISH YOU ALL LUCK
