AU LongAUDUSD Entry
Entry @ break and retest of minor support/resistance and trendlines minor and 1H
TP1 where 1H and 4H PRZ share @ 0.66155 TP2 @ 0.66584
which also -27 on major structure fib
HH and HL showing on major structure, continuing the uptrend
Price retraced to 38.2, retesting 1H trendline
Forex market

EU sell on minor structureEntry @ break and retest of minor support and trendlines minor and 1H
TP1 where 1H and 4H POC share @ 1.1693
which also -27 on minor fib
LH and LL showing on 1H structure,
On minor structure, price retraced 50%, retesting 1H trendline

Sell USDCHFA bearish flag has emerged on the 4H chart on USDCHF. We can expect price to short massively this week.

Euro takes a hit as trade deal with the US sparks a market rallyTrading this week kicked off with a trade agreement between the United States and the European Union, which pushed both the US and European indices to open in the green.
However, this development had a negative impact on the euro, which is experiencing a significant decline during today's session, Monday, July 28, 2025. Meanwhile, the US dollar is making a strong comeback, rising by 0.60% ahead of the US session open.
This recent decline has reversed the euro’s upward trend that it had maintained since the beginning of this month. The EUR/USD pair dropped again, hitting a new low below the 1.17110 level, which represents the last lower high of the bullish trend.
What is the likely upcoming scenario?
A price increase for the pair to the 1.17635 level would be considered a corrective move within the ongoing bearish trend. The negative outlook would not change unless the price records a higher high above the 1.17889 level on the 4-hour timeframe.
However, the EUR/USD is heading into an important week filled with key economic data and news, particularly from the US. This includes the US Non-Farm Payrolls set to be released on Friday, August 1, 2025, and the Federal Reserve meeting on Wednesday, July 30, 2025. The later will cover interest rate decisions and upcoming economic projections. The outcomes of these events are expected to have a direct impact on both the US dollar and the EUR/USD pair.


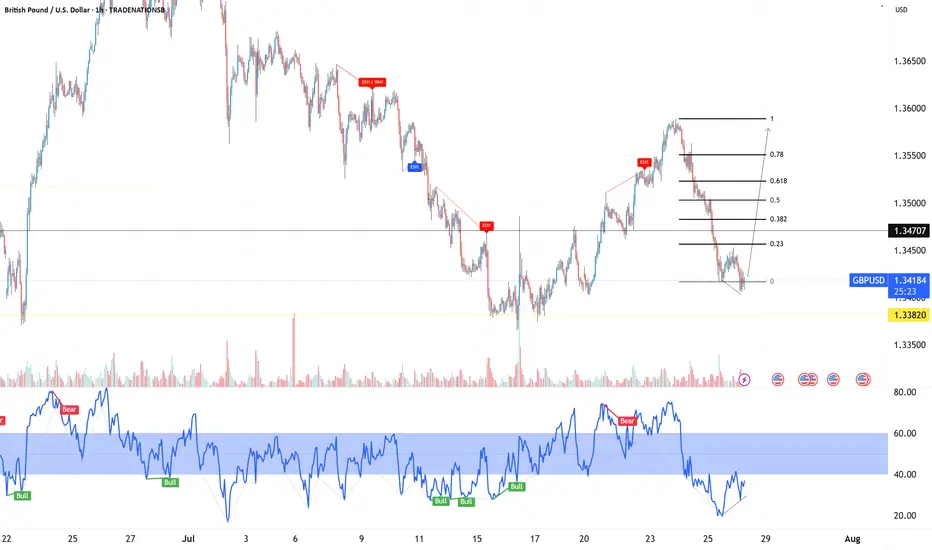
Bullish on GBP/USD (4H Chart)Support Zone (Entry Area: ~1.3420)
Price has tapped into a strong historical support level (marked by multiple prior rejections).
A slight liquidity sweep below this zone hints at potential sell-side liquidity grab, which often precedes a reversal.
Market Structure:
The pair has been in a corrective downtrend but is now approaching a key inflection point.
Bullish momentum is anticipated due to the pattern of higher-timeframe structure still respecting previous lows.
Volume:
This zone typically accumulates large orders (institutional buying interest) before an upward push.

CHFJPY is BearishPrice was in a strong uptrend, however now it seems that bulls are exhausted, the notion is further validated by a double top reversal pattern with bearish divergence. If previous higher low is broken with good volume, then we can expect a bearish reversal as per Dow theory. Targets are mentioned on the chart.

Bullish for AudjpyLiquidity chase towards the highs🚀
Buyers are bias will take continuous hold in the market for the week
The highs is a potential target due to liquidity

GBPUSD eyes 1.3600 as there is RSI Divergence on 1H timeframe.Early Long entry from 1.3412 -1.3420 area is recommended with strict risk management.
Entry: 1.3412-1.3420
Long:
Stoploss: 1.3400
TP: 1.3550
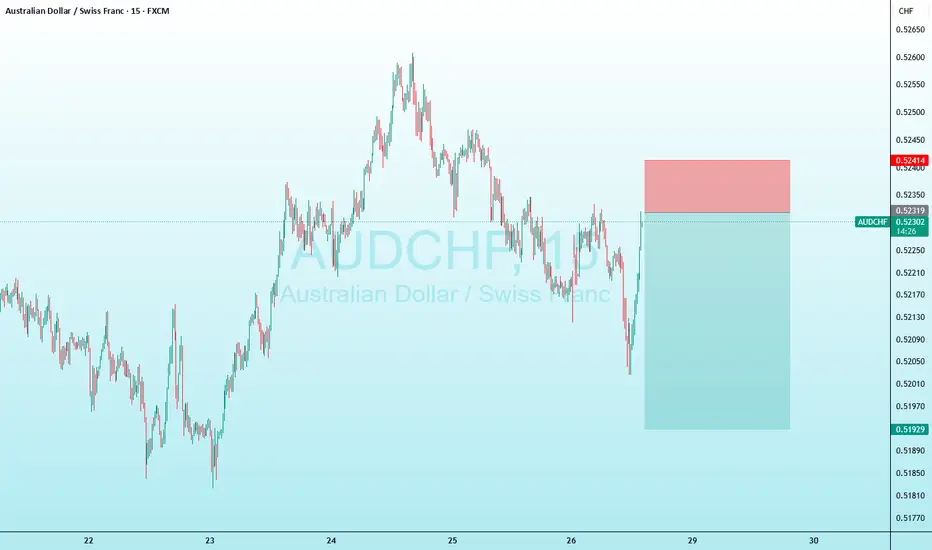
audchf short trade in my opinion this is a good trade with a good r/r hope hit the tp consider this is my trade not your trade and i just like to share my trades with world
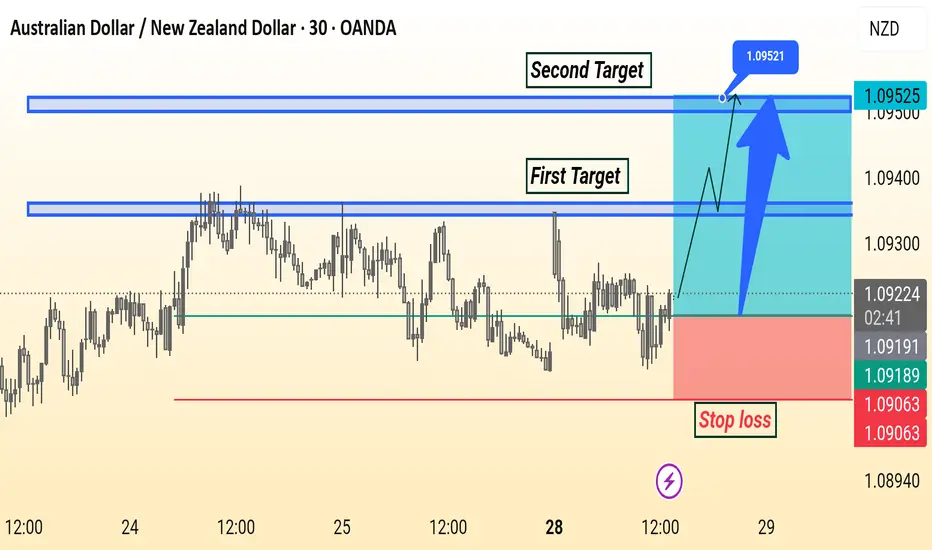
AUD/NZD Analysis is Ready Move Will Be Fly This AUD/NZD 30-minute chart shows a bullish setup with entry around 1.09216. The first target is near 1.09400 and the second target is at 1.09521. A stop loss is placed below support at 1.09063. The analysis suggests a potential upward move after a breakout.

GBPAUD Is Going Up! Long!
Here is our detailed technical review for GBPAUD.
Time Frame: 6h
Current Trend: Bullish
Sentiment: Oversold (based on 7-period RSI)
Forecast: Bullish
The market is on a crucial zone of demand 2.055.
The oversold market condition in a combination with key structure gives us a relatively strong bullish signal with goal 2.070 level.
P.S
Please, note that an oversold/overbought condition can last for a long time, and therefore being oversold/overbought doesn't mean a price rally will come soon, or at all.
Disclosure: I am part of Trade Nation's Influencer program and receive a monthly fee for using their TradingView charts in my analysis.
Like and subscribe and comment my ideas if you enjoy them!

NZD/CAD Setup Price broke below the consolidation channel, retested the support at 0.82330, and is expected to continue down toward the target at 0.81599. Bearish momentum is in play.

SHORT TRADE PLAN (LIVE REVERSAL SETUP)🔻SHORT TRADE PLAN (LIVE REVERSAL SETUP)
🔹 Entry: 1.1665
🔹 Stop Loss: 1.1800 (Brick 18 reclaim = hard invalidation)
🔹 Risk: 135 pips
🔹 Style: Macro Renko reversal — Brick 17 collapse, now short inside Brick 16
🔹 Bias: Downtrend targeting full structure rotation and fib reversion
⸻
🧠 WHY THIS SHORT?
• ❌ Bullish structure invalidated: H4 candle closed beneath 1.1700, violating Brick 17
• 🧱 Renko breakdown confirmed: Price now actively trading inside Brick 16 (1.1600–1.1700)
• 🧬 Momentum flipped: Largest bearish candle in weeks signals shift in institutional control
• 📉 No support until 1.1500–1.1400 → multiple clean Renko bricks below = high velocity window
• 🧲 Macro magnet pull: 1.1000 is full cycle reversion zone — untouched since last major fib reset
• 🔐 Longs are trapped under Fib 100 → sentiment rotated hard → fade is now the high-probability play
⸻
🎯 SHORT TARGET LADDER (100 PIP BRICKS)
TP1 — 1.1500 📉
〰️ Brick 14 confirm — early exit zone
+165 pips | R:R 1.22:1
TP2 — 1.1400 🔻
〰️ Brick 13 confirmation — structural break builds
+265 pips | R:R 1.96:1
TP3 — 1.1300 📉
〰️ D1 structural pivot — macro memory zone
+365 pips | R:R 2.70:1
TP4 — 1.1200 📉
〰️ Fib 0.0 / round number test
+465 pips | R:R 3.44:1
TP5 — 1.1100 📉
〰️ Trend extension base
+565 pips | R:R 4.18:1
TP6 — 1.1000 🧲
〰️ Full macro cycle alignment
+665 pips | R:R 4.92:1
TP7 — 1.0900 🪤
〰️ Trap zone for blowout shorts
+765 pips | R:R 5.66:1
TP8 — 1.0800 🧠
〰️ Max extension pressure
+865 pips | R:R 6.40:1
TP9 — 1.0700 🏁
〰️ Renko structure finality zone
+965 pips | R:R 7.14:1
TP10 — 1.0600 🌀
〰️ Overshoot runner — hold only 10–15%
+1065 pips | R:R 7.89:1
⸻
⚙️ EXECUTION RULES
• SL → locked at 1.1800 (only full Brick 18 reclaim = exit)
• Move SL to BE after TP2 hits
• Begin 1-brick trailing after TP3
• Book 70–80% of size by TP6
• Only hold runners beyond TP7–TP10 if Renko bricks remain unbroken
📛 Long bias is off — no reentry until Brick 17 is reclaimed on Renko
🟠 Optional new short entries on bounce into 1.1685–1.1700

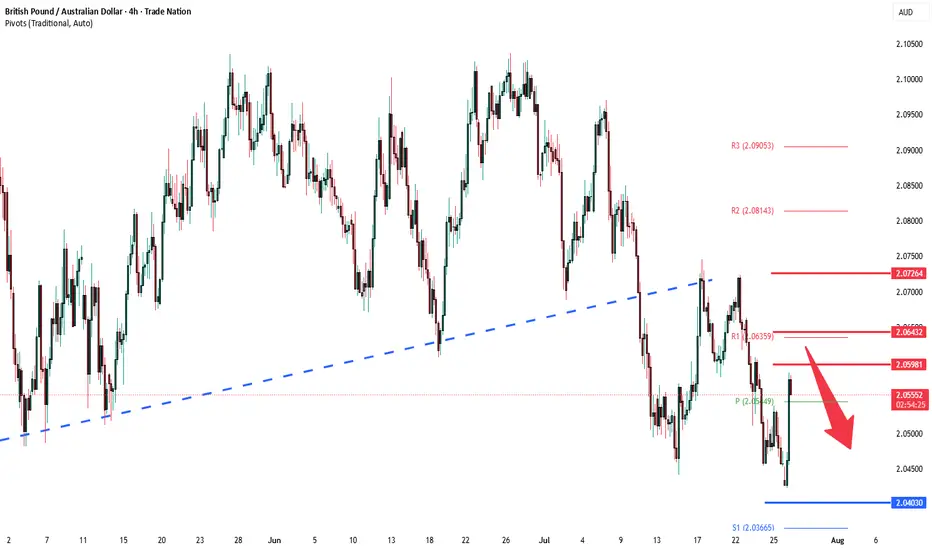
GBPAUD oversold rally capped at 2.0600 resistanceThe GBPAUD pair is currently trading with a bearish bias, aligned with the broader downward trend. Recent price action shows a retest of the resistance, suggesting a temporary relief rally within the downtrend.
Key resistance is located at 2.0600, a prior consolidation zone. This level will be critical in determining the next directional move.
A bearish rejection from 2.0600 could confirm the resumption of the downtrend, targeting the next support levels at 2.0400, followed by 2.0350 and 2.0290 over a longer timeframe.
Conversely, a decisive breakout and daily close above 2.0600 would invalidate the current bearish setup, shifting sentiment to bullish and potentially triggering a move towards 2.0645, then 2.0730.
Conclusion:
The short-term outlook remains bearish unless the pair breaks and holds above 2.0600. Traders should watch for price action signals around this key level to confirm direction. A rejection favours fresh downside continuation, while a breakout signals a potential trend reversal or deeper correction.
This communication is for informational purposes only and should not be viewed as any form of recommendation as to a particular course of action or as investment advice. It is not intended as an offer or solicitation for the purchase or sale of any financial instrument or as an official confirmation of any transaction. Opinions, estimates and assumptions expressed herein are made as of the date of this communication and are subject to change without notice. This communication has been prepared based upon information, including market prices, data and other information, believed to be reliable; however, Trade Nation does not warrant its completeness or accuracy. All market prices and market data contained in or attached to this communication are indicative and subject to change without notice.
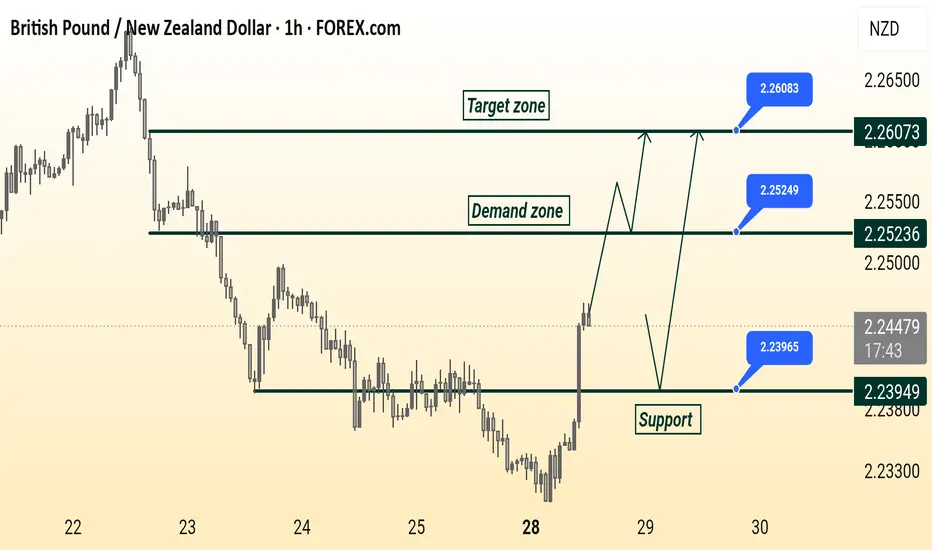
GBP/ NZD Ready Read The Captions This 1-hour chart analysis of GBP/NZD highlights key trading zones:
Support level: 2.23949
Demand zone: 2.25236
Target zone: 2.26073
The price is currently rising from support and approaching the demand zone. Two possible scenarios are shown: a breakout toward the target zone or a pullback to the support before a new upward attempt.
EURUSD: A New Possibility On The Horizon!!Following my previous post just a few minutes ago, I’ve observed that price may retrace deeper into the 4H supply zone, which could invalidate our earlier bearish setup. This shift is due to visible signs of uncollected liquidity still resting above the current price.
If price continues its rally to the upside, we’ll shift bias and look for potential opportunities to ride the bullish move instead. Losses are part of the game, guys—but no worries, my sell entries are already secured✌️😂.
Stay sharp and stay active, traders. Let’s see how price unfolds from here. Follow for more updates. See you on the next one. ⚔️📊

EURJPY ANALYSIS After seeing the weekly close bullish we could expect the pair to continue the bullish leg this new week with the daily and 4hr trading in the same direction. An upside target of 175.000 could be the profit taking areas for the next leg to the upside

EUR/USD | Moving bullish Why Is EUR/USD Always Moving?
Ever asked yourself, "Why does the Euro rise or fall against the Dollar?" 💡
It’s not magic – it’s all about money flow, news, and market mood.
📉 When traders feel unsure, they might sell the Euro.
📈 When Europe’s economy looks strong, the Euro can fly!
Right now, we’re watching some key price zones 👀:
Breakout above 1.17485 could push us to 1.18792 🚀
Drop below 1.17038 might take us lower 📉

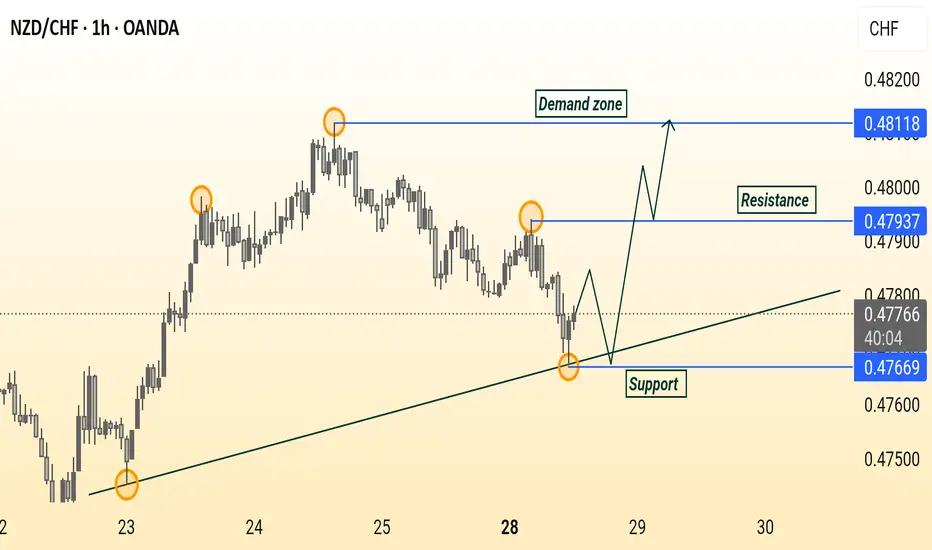
NZD/CHF Rebounds from Trendline SupportThis NZD/CHF 1-hour chart shows a bounce from a rising trendline support at 0.47669. Price is expected to retest support before moving toward the 0.47937 resistance and potentially reaching the 0.48118 demand zone. Trend remains bullish above support.
Fundamental Market Analysis for July 28, 2025 GBPUSDThe pound is sliding to 1.34250, reacting to a fresh slowdown in UK inflation and reduced expectations of further tightening from the Bank of England. The annual CPI for June fell to 2.2%, the lowest since March 2022, allowing the regulator to keep rates unchanged at the August meeting.
Meanwhile, rising Treasury yields intensify capital inflows into dollar assets after a strong US Q2 GDP report (+2.4% q/q). The British economy remains close to stagnation: the services PMI fell to 49.8, indicating shrinking orders and wage pressure.
Political risks also weigh on the pound: the ruling party's parliamentary majority shrank after unscheduled by-elections, complicating the government's implementation of fiscal stimulus. Collectively, this increases the attractiveness of selling the pair ahead of the Fed meeting, where markets price in a possible rate hike by year-end.
Trade recommendation: SELL 1.34250, SL 1.34450, TP 1.33250

GBPUSD ANALYSIS After seeing the weekly find support at the low of the previous bullish candle we could be looking for a push up on this pair but waiting to see how the pair trades for the London session today and if there will be a break of resistance on the 4hr timeframe
