Forex market
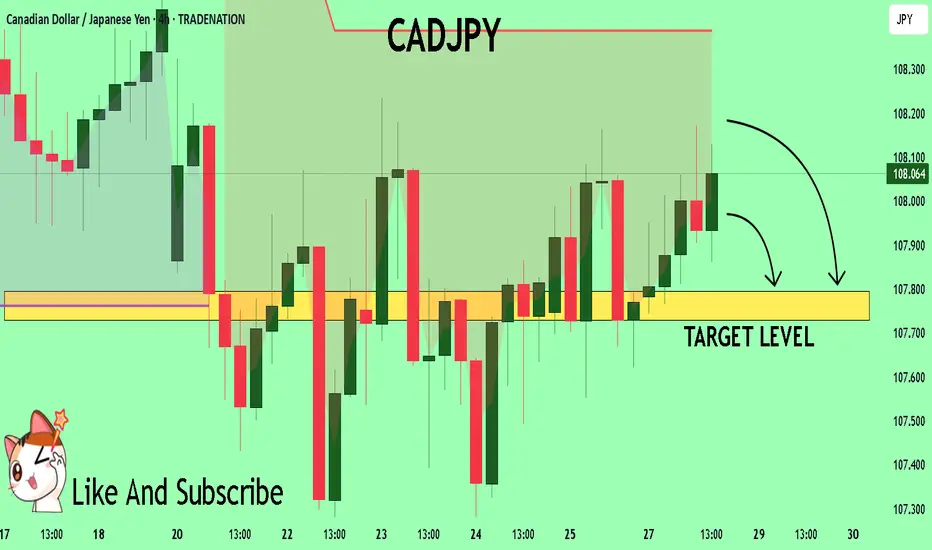
CADJPY Trading Opportunity! SELL!
My dear followers,
I analysed this chart on CADJPY and concluded the following:
The market is trading on 108.08 pivot level.
Bias - Bearish
Technical Indicators: Both Super Trend & Pivot HL indicate a highly probable Bearish continuation.
Target - 107.79
About Used Indicators:
A super-trend indicator is plotted on either above or below the closing price to signal a buy or sell. The indicator changes color, based on whether or not you should be buying. If the super-trend indicator moves below the closing price, the indicator turns green, and it signals an entry point or points to buy.
Disclosure: I am part of Trade Nation's Influencer program and receive a monthly fee for using their TradingView charts in my analysis.
———————————
WISH YOU ALL LUCK
GBPAUD Break of trendline resistance GBPAUD recent broke the trendline resistance and is likely to go up.

EURUSD - trade - market structureDXY - trade - market structure , easy setup, clean setup , good probability, if this happen is a big win, use risk and trade managment
Temporary SELL then BUYAs we said, BIG picture BUY.
Yesterday temporary sell since H1 range was still SELL.
Today H1 range is BULLISH.
We expect temporary SELL from 147.22/42 (After confirmation we will get Snip entry)
TP1: 146.45 (BUY ZONE)
Note: If It will go to BUY ZONE (146.45) first before SELL ZONE (I wont sell)

EURUSD TEMPORARY BUY THEN SELLBIG picture SELL
There is Temporary BUY since 15m SELL range swiped to BULL.
The BULLISH can start from 1.1736 (BUY ZONE) (I WONT BUY IF SELL ZONE TAPPED FIRST)
TP: 1.1762 (SELL ZONE)
SELL ZONE (1.1762/1.1770) After confirmation SELL.
TP: 1.1710

CADCHF bullish expectations for next period
OANDA:CADCHF interesting chart, bearish trend last 5M, i am have bullish expectations on 10.June, but price is make one more strong bearish push.
Currently nice structure created, price pushing bullish, from here expectations are bullish trend to see.
SUP zone: 0.58050
RES zone: 0.59000, 0.59450

GBPNZD SELL TRADETREND: Downtrend
The price is currently retesting broken support on the H4 and Daily charts, indicating continued selling. Based on the strong bullish pressure currently, I'll be looking for a confirmation signal to sell at the next H4 close.

GBPNZD 15m buyHello friends. The price of the GBPNZD symbol in the 15-minute time frame after hitting the FVG high time frame is now bullish. You can see that it also happened in the choch direction. If it returns to the FVG 15m area, it can be entered for buy. Friends, please note that this is just a theory.

AUDJPY RETEST SUPPORT AUDJPY sweeps liquidity and retests support hopefully it continues the uptrend towards 97.430

EUR/USD - Sells on H1EUR/USD broke an Ascending Channel and have also shifted the trend downwards.
We will wait for a pullback to 0.5 - 0.618 Fib level for entry with the SL placed above the last high

AU LongAUDUSD Entry
Entry @ break and retest of minor support/resistance and trendlines minor and 1H
TP1 where 1H and 4H PRZ share @ 0.66155 TP2 @ 0.66584
which also -27 on major structure fib
HH and HL showing on major structure, continuing the uptrend
Price retraced to 38.2, retesting 1H trendline

EU sell on minor structureEntry @ break and retest of minor support and trendlines minor and 1H
TP1 where 1H and 4H POC share @ 1.1693
which also -27 on minor fib
LH and LL showing on 1H structure,
On minor structure, price retraced 50%, retesting 1H trendline

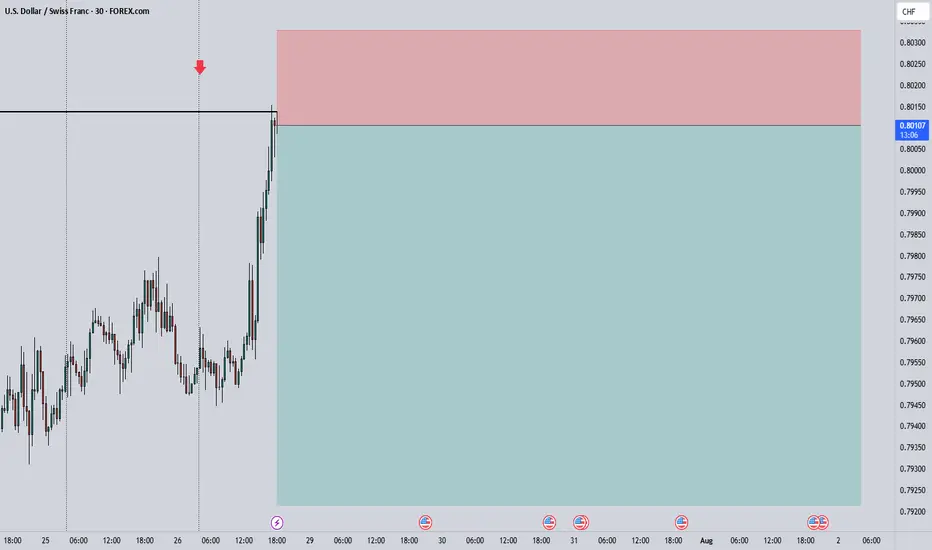
Sell USDCHFA bearish flag has emerged on the 4H chart on USDCHF. We can expect price to short massively this week.

Euro takes a hit as trade deal with the US sparks a market rallyTrading this week kicked off with a trade agreement between the United States and the European Union, which pushed both the US and European indices to open in the green.
However, this development had a negative impact on the euro, which is experiencing a significant decline during today's session, Monday, July 28, 2025. Meanwhile, the US dollar is making a strong comeback, rising by 0.60% ahead of the US session open.
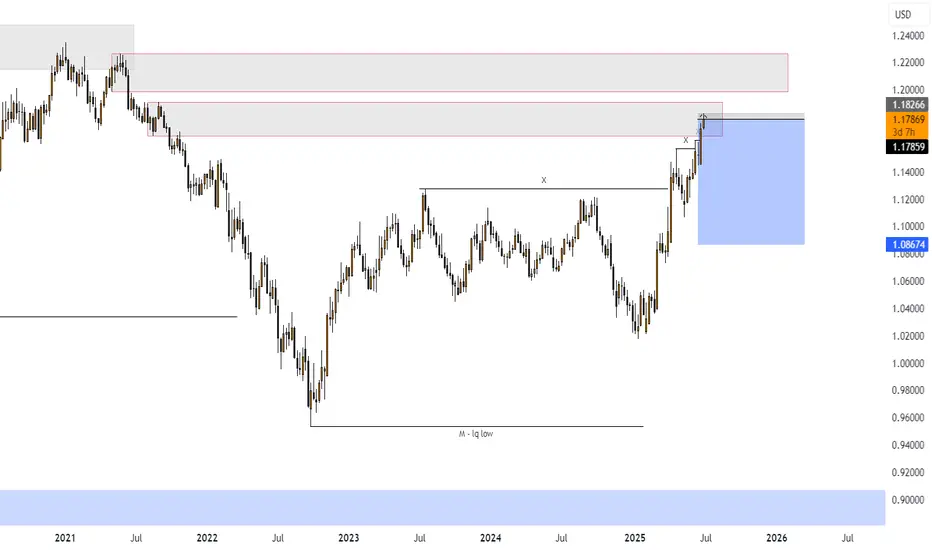
This recent decline has reversed the euro’s upward trend that it had maintained since the beginning of this month. The EUR/USD pair dropped again, hitting a new low below the 1.17110 level, which represents the last lower high of the bullish trend.
What is the likely upcoming scenario?
A price increase for the pair to the 1.17635 level would be considered a corrective move within the ongoing bearish trend. The negative outlook would not change unless the price records a higher high above the 1.17889 level on the 4-hour timeframe.
However, the EUR/USD is heading into an important week filled with key economic data and news, particularly from the US. This includes the US Non-Farm Payrolls set to be released on Friday, August 1, 2025, and the Federal Reserve meeting on Wednesday, July 30, 2025. The later will cover interest rate decisions and upcoming economic projections. The outcomes of these events are expected to have a direct impact on both the US dollar and the EUR/USD pair.


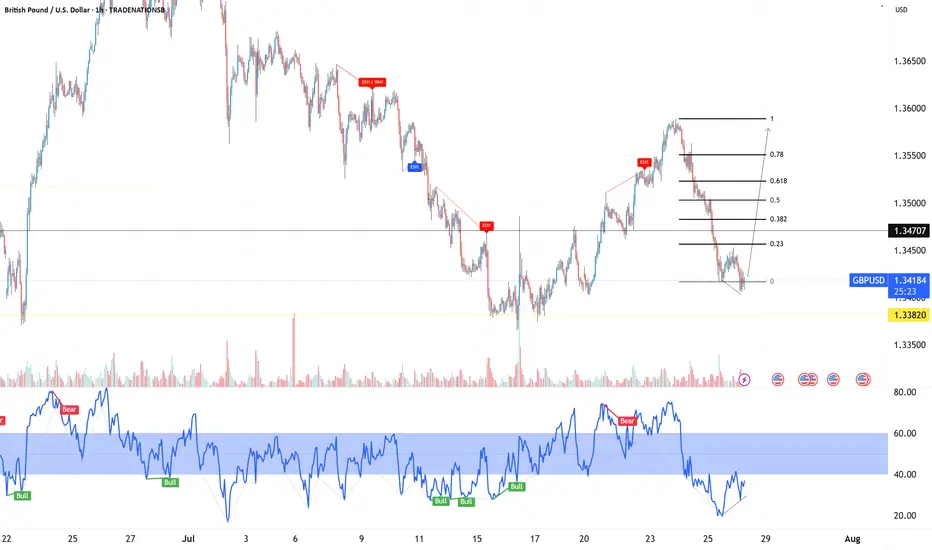
Bullish on GBP/USD (4H Chart)Support Zone (Entry Area: ~1.3420)
Price has tapped into a strong historical support level (marked by multiple prior rejections).
A slight liquidity sweep below this zone hints at potential sell-side liquidity grab, which often precedes a reversal.
Market Structure:
The pair has been in a corrective downtrend but is now approaching a key inflection point.
Bullish momentum is anticipated due to the pattern of higher-timeframe structure still respecting previous lows.
Volume:
This zone typically accumulates large orders (institutional buying interest) before an upward push.

CHFJPY is BearishPrice was in a strong uptrend, however now it seems that bulls are exhausted, the notion is further validated by a double top reversal pattern with bearish divergence. If previous higher low is broken with good volume, then we can expect a bearish reversal as per Dow theory. Targets are mentioned on the chart.

Bullish for AudjpyLiquidity chase towards the highs🚀
Buyers are bias will take continuous hold in the market for the week
The highs is a potential target due to liquidity

GBPUSD eyes 1.3600 as there is RSI Divergence on 1H timeframe.Early Long entry from 1.3412 -1.3420 area is recommended with strict risk management.
Entry: 1.3412-1.3420
Long:
Stoploss: 1.3400
TP: 1.3550
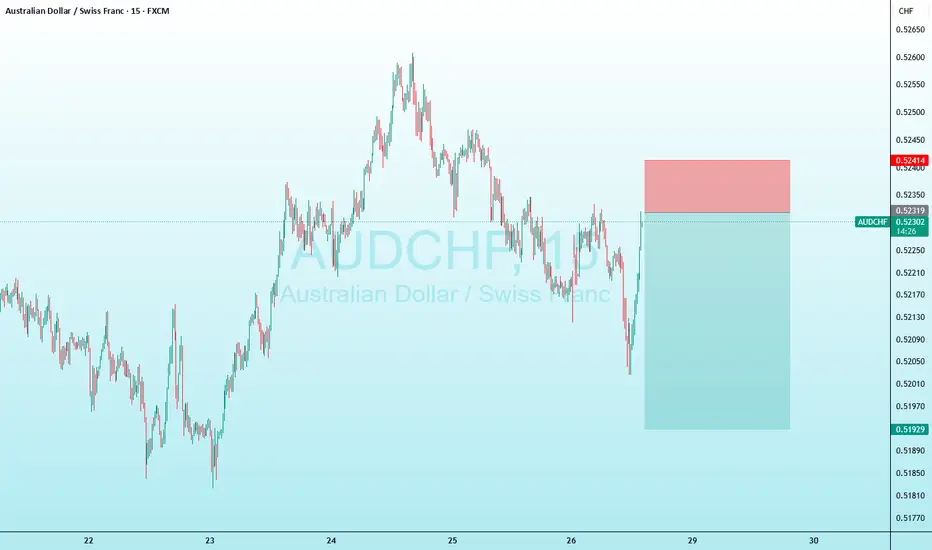
audchf short trade in my opinion this is a good trade with a good r/r hope hit the tp consider this is my trade not your trade and i just like to share my trades with world
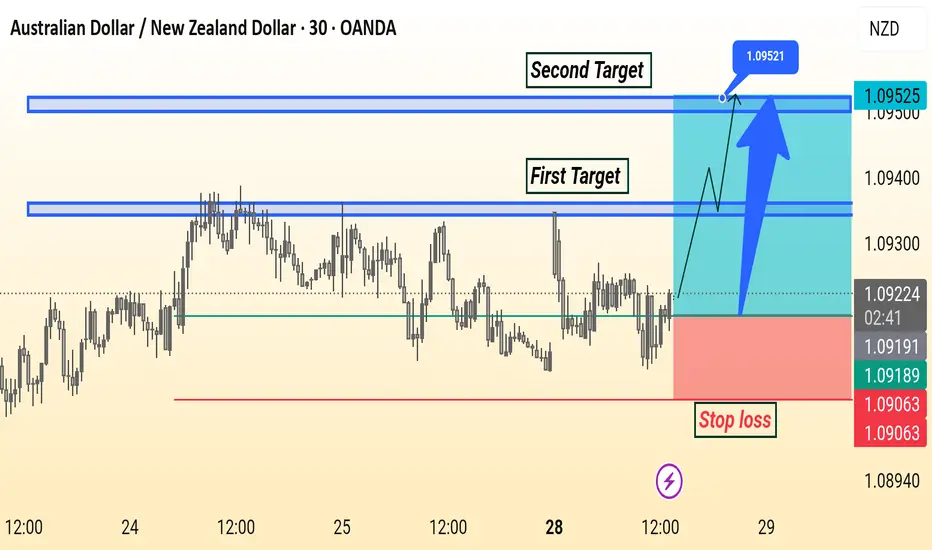
AUD/NZD Analysis is Ready Move Will Be Fly This AUD/NZD 30-minute chart shows a bullish setup with entry around 1.09216. The first target is near 1.09400 and the second target is at 1.09521. A stop loss is placed below support at 1.09063. The analysis suggests a potential upward move after a breakout.