USDJPYUSD/JPY Interest Rate Differential, 10-Year Bond Yields, and Carry Trade Analysis (May 26–30, 2025)
Current 10-Year Bond Yields
US 10-Year Treasury Yield: 4.54% (as of May 21–22, 2025) .
Japan 10-Year JGB Yield: 1.56% (as of May 23, 2025) .
Interest Rate Differential (IRD)
The yield spread between US and Japanese 10-year bonds is:4.54%(US)−1.56%(JPY)=+2.98%
4.54% (US)−1.56% (JPY)=+2.98%
This significant differential favors the US dollar, making USD/JPY attractive for carry trades.
Carry Trade Advantage
Investors borrow low-yielding JPY (at ~0.5% BoJ policy rate) to invest in higher-yielding USD assets, earning the ~2.98% yield spread as profit.
The strategy is supported by the Fed’s relatively hawkish stance compared to the BoJ’s cautious approach, despite Japan’s rising inflation (core CPI at 3.5% in April 2025) .
Bank of Japan Policy Signals:
Rising inflation and revised Leading Economic Index (108.1 for March 2025) may pressure the BoJ to tighten policy, narrowing the yield differential.
Market expectations for BoJ rate hikes could strengthen JPY, reducing carry trade appeal.
USD/JPY has fallen below 143.00 amid JPY strength , but oversold conditions suggest potential short-term corrections.
US-China trade tensions and tariffs may introduce volatility, affecting risk sentiment.
Summary Table
Metric United States (USD) Japan (JPY)
10-Year Bond Yield 4.54% 1.56%
Interest Rate Differential +2.98% (USD over JPY) —
Carry Trade Appeal Favorable for long USD/JPY —
Conclusion
The ~2.98% yield differential strongly supports USD/JPY carry trades, but traders should monitor:
BoJ policy shifts: Potential rate hikes could narrow the spread and weaken USD/JPY.
Fed rhetoric and US data: Hawkish signals may sustain USD strength, while dovish surprises could reduce the yield advantage.
Technical levels: A break below 142.00 could signal further JPY strength, eroding carry trade profits.
While the carry trade remains attractive, volatility from policy uncertainty and geopolitical risks requires careful risk management during this period..
#GOLD #FOREX #USDJPY#DOLLAR #YEN
Forex market


Uptrend The price is expected to consolidate above the support level and then continue the uptrend. If the price breaks through the support level, a continuation of the downtrend is likely.

Possibility of uptrend The price is expected to move in the specified direction and after the completion of the corrective pattern, the start of an uptrend is likely. A break of the support zone will cause the continuation of the downtrend.

Check the trend Given the price behavior within the current resistance range, possible scenarios have been identified. It is expected that the uptrend will continue and advance to certain Fibonacci levels.

Possibility of uptrend A trend reversal is expected at the current support level. Then, a break of the green resistance level will confirm the uptrend. Otherwise, a break of the support level will likely lead to a continuation of the downtrend.

EUR/USD Approaches Major Supply Zone – Reversal Imminent?EUR/USD is testing a key supply zone near 1.1380 – 1.1443 – a historical level where price has previously reversed sharply.
With price stalling at this resistance, traders should prepare for potential downside opportunities if rejection confirms.
Key Levels:
Resistance/Supply Zone: 1.1380 – 1.1443
First Target Zone: 1.0902
Major Demand/Buy Zone: 1.0290 (highlighted in orange with visible volume support)
Bearish Confluence:
Repeated rejection at this price range in the past
Clean demand imbalances below (price may rebalance)
Psychological resistance around 1.1400
Potential bearish divergence forming on RSI/H4 MACD (not shown)
Trade Idea:
Looking to short near the top of the supply zone with stops above 1.1450.
Targeting 1.0902 first, and deeper drop to 1.0290 if momentum confirms.
Invalidation:
Strong breakout above 1.1450 with volume and bullish continuation.
Questions for the Community:
Do you see this as a double-top formation?
Are you bullish or bearish on EUR/USD going into June?
#EURUSD #ForexAnalysis #SmartMoney #SupplyAndDemand #PriceAction #LuxAlgo #SwingTrade #ReversalSetup #TradingView #FXStrategy

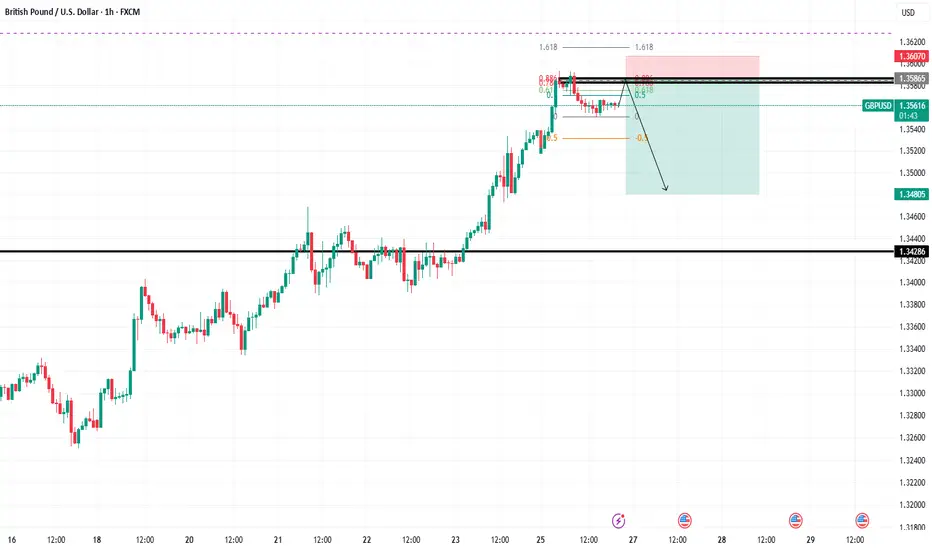
GBPUSD⏳ WAIT TO SELL – GBP/USD
📉 We're watching GBP/USD closely for a sell opportunity, but it’s not the right time yet.
🧠 Be patient and let price action come to our zone of interest before entering.
💡 This setup requires confirmation — avoid jumping in prematurely.
Stay alert. Signal will be updated once conditions align.
#AN002 Latest World News and Forex Impact
Hello, I'm Forex Trader Andrea Russo and today I want to talk about how recent global geopolitical tensions are radically changing the international currency balance.
In Forex, every crisis is a map of opportunities, but only those who analyze the global context can truly understand where capital will move. In this article, we analyze the main events of the week and reflect on how they could affect currencies in the coming days.
🇮🇳🇵🇰 India and Pakistan: risk of escalation across the border
After a terrorist attack in Kashmir that caused 26 civilian casualties, India launched “Operation Sindoor” targeting extremist groups across the border. Pakistan responded militarily with “Operation Bunyan-un-Marsoos”. Both countries used drones and cruise missiles.
Despite a ceasefire declared on May 10, the truce is fragile. The risk of a tactical nuclear crisis is real today.
🔍 Forex Impact: Strong pressure on the Indian rupee (USD/INR up) and increased demand for safe haven currencies such as CHF and JPY.
🇵🇸🇮🇱 Israel-Gaza: urban warfare resumes
Israeli operations in the Gaza Strip have intensified, aiming for complete control of the area. Hundreds of civilian casualties have been reported. Italy and other members of the Madrid+ Group are calling for a ceasefire, proposing an Arab plan for reconstruction.
🔍 Forex Impact: In the acute phase, gold (XAU/USD) and the US dollar are strengthening. The NIS (Israeli shekel) is showing signs of weakness, especially if the conflict extends to Lebanon or Syria.
🇺🇦🇷🇺 Ukraine-Russia: is a glimmer of hope opening up again?
Donald Trump spoke by phone with Vladimir Putin and other international leaders, including Giorgia Meloni, proposing the Vatican as a venue for new negotiations. Although the war continues mainly in Zaporizhzhia and the eastern region, diplomacy is back on the table.
🔍 Forex Impact: If the talks materialize, the EUR/USD could strengthen. If not, instability will further favor safe-haven currencies and weakness of the euro.
🇧🇫 Burkina Faso: the forgotten war
The jihadist group JNIM has carried out coordinated attacks in several cities in the north of the country, causing dozens of deaths and temporarily conquering the city of Djibo. The humanitarian crisis is worsening and the Sahel region remains among the most unstable in the world.
🔍 Forex Impact: Direct impacts marginal, but emerging African currencies continue to suffer from systemic instability and capital flight.
🇺🇸🇨🇳 US and China: new economic frictions
The second Trump administration has imposed new duties on Chinese products, exacerbating trade relations. The European Union, meanwhile, is seeking rebalancing by strengthening ties with Beijing. The global context is once again multipolar.
🔍 Impact on Forex: USD still strong in the short term, but growing tensions with China could weaken the USD/CNH and strengthen the CNY if Beijing responds with targeted monetary stimulus.
✝️ Vatican and new spiritual diplomacy
The new Pope, Leo XIV, is prioritizing migration and poverty. The Vatican proposes itself as a neutral venue for peace mediations, as in the Ukraine-Russia case. The Church returns to being a geopolitical actor.
🔍 Impact on Forex: Symbolic but relevant: the idea of Rome as a diplomatic center strengthens the perceived stability of the euro area.
📉 Italian GDP: growth slows
According to ISTAT, Italian GDP is falling in 2025. The causes? Industrial slowdown, residual inflation and uncertain global climate. However, public accounts are improving and employment remains stable.
🔍 Impact on Forex: EUR under pressure awaiting new ECB estimates. The spread remains under observation.
🧭 Final reflection: Forex and geopolitics, an inseparable pair
Geopolitical tensions are not background noise, but waves that move billions. Smart traders don't just read charts: they read the world. The fragility of international relations and ongoing conflicts will lead to a new polarization of Forex: on one side, safe haven currencies (JPY, CHF, USD in shock phases), on the other, emerging and cyclical currencies that are increasingly vulnerable.
Those who want to navigate this market must be prepared to react not to data, but to events that change data.

GBP/USD - POTENTIAL RETRACEMENT SETUP (15 MIN CHART)Market Structure :
Price made a strong bullish move and is now showing signs of a retracement from a clear supply zone around the recent highs. The impulsive leg is being respected, and the market has started pulling back from the top.
Key Technical Points:
Supply Zone marked where price reversed aggressively.
Fibonacci retracement levels drawn from the swing low to the swing high.
Price currently sitting between the 38.2% and 50% retracement zone.
The 61.8% - 78.6% zone, along with ascending trendline support (in orange), creates a confluence area for a possible bullish reaction.
Two potential entry zones are highlighted:
1. Near the trendline and fib golden zone
2. Deeper retracement near OB demand zone and the 78.6% level.
Bias:
Bullish continuation if price respects the trendline and demand zones. Waiting for confirmations like bullish engulfing or break of structure from lower timeframes before entry.
Risk Management:
SL below demand zone. TP targeting retest of supply zone or potential breakout depending on momentum

CHECK GBPUSD SIGNAL READ CAPTAINgbpusd signal technical analysis satup 👇🏼
(gbpusd ) sell zone
( TRADE SATUP)
ENTRY POINT (1.35650) to (1.35550) 📊
FIRST TP (1.35400)
2ND TARGET (1.35100) 📊
LAST TARGET (1.34800) 📊
STOP LOOS (1.35900)❌
FALLOW RISK MANAGMENT

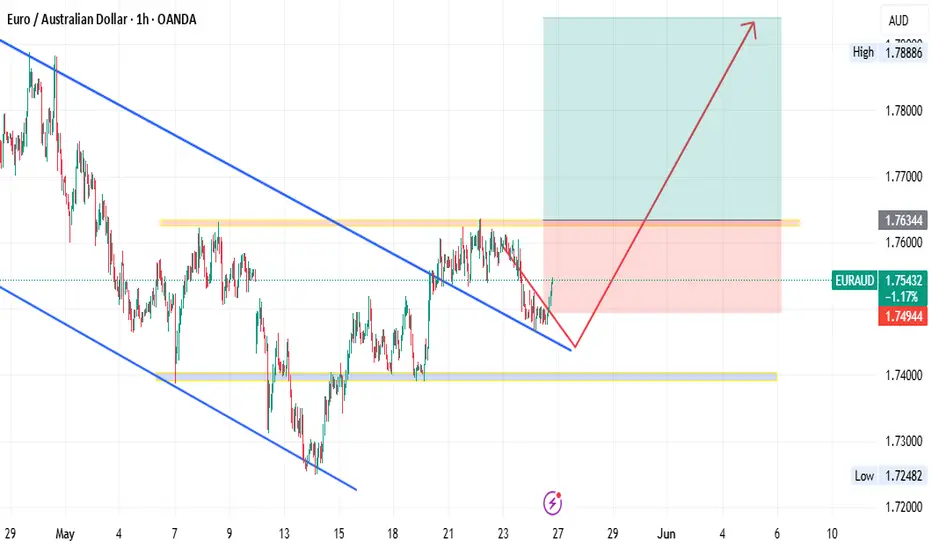
#003 Investment Opportunity LONG EUR/AUD
The EUR/AUD pair is showing an interesting technical-macro context that suggests a possible bullish development in the next sessions. The analysis conducted integrates multi-timeframe elements, advanced indicators, institutional positioning and macroeconomic context, concluding in a coherent view in favor of a long position.
🔍 Multi-timeframe technical analysis (8H, D, W)
On 8H and daily timeframes, EUR/AUD has broken the descending bearish trendline and is building a new structure of higher lows above the long-term moving average. The weekly chart shows a consolidation above the static support of 1.7400, with candles that are starting to configure potential reversals.
📊 Main technical indicators
WaveTrend and RSI are bullish but not overbought, offering room for further extensions.
The Stochastic has just crossed upwards in the restart zone, confirming the market's intention to reverse the previous bearish push.
🌀 Harmonic patterns and cyclical
We are in the initial phase of a new bullish cycle. The completion of a possible "inverse Gartley" pattern coincides with the currently tested technical support levels. The short-term cyclical shows a clear end of the previous bearish cycle.
🧱 Key supports and resistances
The price has bounced strongly from the dynamic support represented by the 200-hour moving average and the static support in the 1.7420 area. The immediate target is the structural resistance at 1.7950, already tested in the past as a reaction point.
📈 Volumes and volume profile
The volume profile highlights a strong accumulation in the area between 1.7450 and 1.7550. No excess visible in the distribution, which suggests a still “light” movement with potential for expansion.
🕯 Candlestick patterns and price action
The last 8H candle is a bullish engulfing, closed above the moving average and with increasing volumes. The three previous candles show a compression and accumulation pattern.
🔗 Correlations and geometries
The divergence with AUD/USD (which appears weak) and the inverse correlation with EUR/JPY in strengthening give further strength to the bullish picture. Historical fractals also show symmetries that have occurred in similar macro contexts.
📊 Pattern Statistics
Similar patterns on EUR/AUD – post trendline breakout with bullish structure on 8H – have shown a positive outcome in 81% of cases on historical samples greater than 100.
📉 Retail Positioning
Current sentiment shows retail heavily positioned short, creating a potential contrarian effect in favor of buyers.
🏦 Institutional Positioning (COT)
COT data signals an increase in net long positions on the euro and a reduction on AUD, compatible with a directional reversal.
🧮 Fundamental Macroeconomic Analysis
EUR supported by expectations of monetary stabilization by the ECB, without new imminent tightening.
AUD penalized by weak exports and softer tones from the RBA.
Macro differential slightly in favor of EUR.
📊 Intermarket Relative Strength
EUR shows increasing strength against commodity currencies, including AUD. This reinforces the bullish thesis, also confirmed by the capital inflows on the euro.
📰 Real Sentiment and Newsflow
The latest macro news and institutional reports confirm a cautious positioning on the AUD. No imminent driver justifies a structural strengthening of the Australian currency.
🌪 Implied and Historical Volatility
Volatility is growing, but still within optimal historical ranges for sustained directional movements. The current ATR is above the average of the last 10 years, a favorable condition for breakouts.
📆 Macro Event Risk
No disruptive event expected in the next 48 hours. The economic calendar is neutral and does not threaten the technical structure in formation.
📉 Minimum Volatility Threshold
The current range and ATR exceed the minimum values of statistical validity, ensuring that the movement is not a false compression breakout.

Swissy Heist: USD/CHF Bearish Breakout Blueprint🚨 Swissy Heist Alert: USD/CHF Bearish Breakout Plan for Swing/Day Traders 🌐💸
Hello, Wealth Chasers and Market Mavericks! 👋😎
Welcome to the Thief Trading Strategy, a cunning blend of technical precision and fundamental insight to conquer the USD/CHF Forex market. This is your blueprint to pull off a masterful heist on "The Swissy." Follow the plan, target the high-reward Green Zone, and navigate the traps where bullish players lurk. Let’s grab those pips and treat ourselves to the spoils! 💰🎯
📈 Trade Blueprint: USD/CHF Setup
Market: USD/CHF (Forex) 🌍
Bias: Bearish Breakout 📉
Timeframe: 4H (Swing/Day Trade) ⏰
Entry Plan 📊:
Breakout Strategy: Wait for a confirmed break below the Neutral Zone at 0.81800. Set Sell Stop orders just below 0.81800 to surf the bearish momentum. 🚀
Pullback Strategy: For safer entries, place Sell Limit orders at the nearest 15M/30M swing high (e.g., 0.82100–0.82300) after a support break. 📍
Pro Tip: Activate a price alert at 0.81800 to catch the breakout live! 🔔
Stop Loss 🛑:
📍 Set your Stop Loss above the nearest 4H swing high (e.g., 0.82750) for swing/day trades.
📍 Adjust SL based on your risk tolerance, lot size, and number of open positions.
Target 🎯: Aim for 0.80700 or exit early to secure profits.
💡 Why the Bearish Bias?
The USD/CHF is showing strong bearish momentum, fueled by technical patterns and fundamental drivers. Key factors include:
Technicals: Recent support at 0.81931–0.82120 held briefly but failed to sustain bullish momentum, reinforcing a bearish tilt below key moving averages (100/200-hour MAs).
Fundamentals: Safe-haven demand for the Swiss Franc persists amid global uncertainties, with bearish patterns like an inverse cup and handle signaling further downside. For a deeper dive, check fundamental reports, COT data, sentiment analysis, and intermarket trends via Linkks🔗
⚠️ Volatility Warning: News Impact 📰
News releases can spike volatility and disrupt price action. To protect your trades:
Avoid opening new positions during major news events.
Use trailing stops to lock in gains and shield running positions.
💪 Join the Heist!
Support this Thief Trading Strategy by smashing the Boost Button! 🚀 Let’s strengthen our crew and make pips effortlessly. With this plan, you’re equipped to navigate the USD/CHF market like a pro. Stay sharp, and I’ll be back with the next heist plan soon! 🐱👤💸
Happy trading, and let’s steal those profits! 😎🎉

GBPJPY BULLISH OR BEARISH DETAILED ANALYSISGBPJPY has successfully broken out of a long-term descending trendline on the 3D timeframe, which had capped price action for months. The breakout is now confirmed with multiple candle closes above the trendline and a retest holding firm around 190.500. This shift in structure signals a major bullish reversal, and I’m now targeting the 199.600 level as the next potential upside objective.
From a fundamental perspective, the British pound is strengthening amid persistent inflationary pressures in the UK, which are keeping the Bank of England firmly in the hawkish camp. With CPI still elevated and wage growth remaining sticky, the BoE has little room to cut rates aggressively anytime soon. In contrast, the Bank of Japan continues to hold a dovish tone with ultra-accommodative monetary policy, offering a wide interest rate differential that favors GBP longs, especially in carry trade setups.
Technically, this setup offers a clean risk-reward profile. The breakout above the descending structure combined with a strong support zone around 190.500 gives this move a solid foundation. We’re seeing momentum build with higher highs and higher lows forming across multiple timeframes. As long as GBPJPY holds above the 190.000 zone, the bullish bias remains valid and the path toward 199.600 looks open and sustainable.
Traders should keep a close eye on short-term pullbacks as potential re-entry zones. With a macro tailwind behind GBP strength and continued JPY weakness, this pair is primed for further upside. I’m riding this bullish wave with a medium-term outlook and adjusting my position based on intraday market behavior.

CHECK USDEUR SIGNAL READ CAPTAINusdeur signal technical analysis satup 👇🏼
(usdeur ) buy zone
( TRADE SATUP)
ENTRY POINT (0.8780) to (0.8770) 📊
FIRST TP (0.8800)
2ND TARGET (0.8840) 📊
LAST TARGET (0.8870) 📊
STOP LOOS (0.8730)❌
FALLOW RISK MANAGMENT

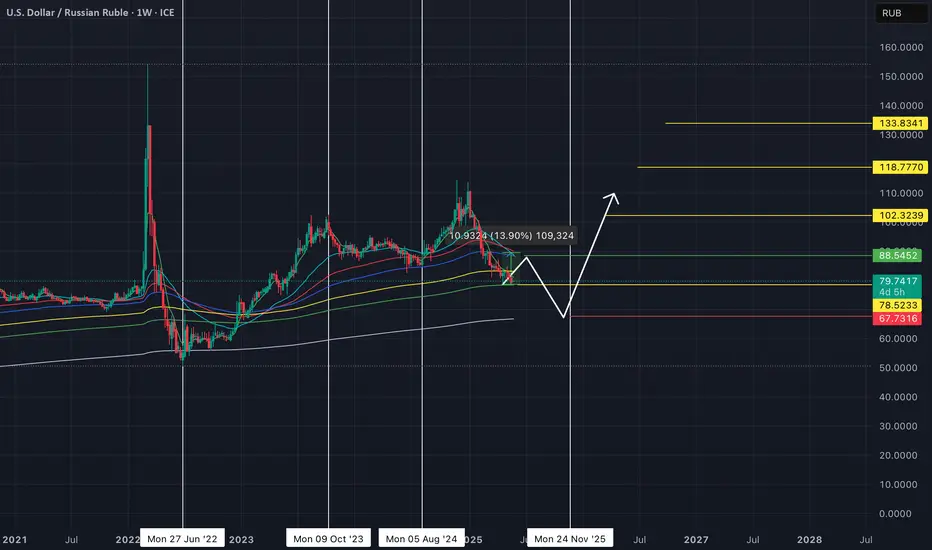
USD/RUBOk I'll let her go I'll let her go lyrics to I will let her know I will let her know that I am sorry for your help with everything else was wondering I will be there in the am I the I am so late that night I
CHECK AUDUSD SIGNAL READ CAPTAINaudusd signal technical analysis satup 👇🏼
(audusd ) sell zone
( TRADE SATUP)
ENTRY POINT (0.64900) to (o.64850) 📊
FIRST TP (0.64700)
2ND TARGET (0.64500) 📊
LAST TARGET (0.64300) 📊
STOP LOOS (0.65100)❌
FALLOW RISK MANAGMENT

GBPJPY SELL OPPORTUNITYThis one is one of those far fetched setups that you look at and just hopes it plays out. From the H4 layout the price broke the trend line and retested. From the retest on the H1 chart, price formed a triple top and then broke it, it could be what the smart traders think is a liquidity sweep. So there are no hopes here just lessons.

(CHECK) GBPJPY SIGNAL READ CAPTAIN(gbpjpy) buy zone
(trade satup)
entry point (193.650) to (193.550) 📊
first target (194.000)📊
2nd target (194.450) 📊
last target (194.800) 📊
stop loss (193.200)❌
trade on your own risk ✅

EURAUD BUY OPPORTUNITYThis is not a signal. So the price has broken our trendline. The price also retested the trendline as i anticipated but i missed the opportunity to sniper it. But now we are hoping for a strong change of trend.
GBP/USD manipulation going on right now ??gbpusd had a good rise the last few weeks/months, now its time to pay attention.
the price is now ranging,. let me tell you what i think.
a little bit higher there is a imbalance in the chart. for me and many others thats a reason to short.
why do i think manipulation is going on?
for the big people in order to go short they need to attract buyers, so how do they do that? they go long, they build up long orders to attract more buyers so the price doesnt go down and the shorts can get filled. thats what happening right now in my opinion. (i can be wrong)
also the rsi is overbought (indicating downside could come )
in my opinion the price will be ranging for a week of 2, after that is wil go a bit higher to eventually come down big time , (like 5% or more)
here is the setup i will take.
no financial advice, just my thoughts

Bearish reversal?EUR/JPY is rising towards the resistance level which is an overlap resistance that lines up with the 50% Fibonacci retracement and could drop from this level to our take profit.
Entry: 163.18
Why we like it:
There is an overlap resistance level that lines up with the 50% Fibonacci retracement.
Stop loss: 163.18
Why we like it:
There is a pullback resistance level that is slightly above the 61.8% Fibonacci retracement.
Take profit: 161.61
Why we like it:
There is a pullback support level.
Enjoying your TradingView experience? Review us!
Please be advised that the information presented on TradingView is provided to Vantage (‘Vantage Global Limited’, ‘we’) by a third-party provider (‘Everest Fortune Group’). Please be reminded that you are solely responsible for the trading decisions on your account. There is a very high degree of risk involved in trading. Any information and/or content is intended entirely for research, educational and informational purposes only and does not constitute investment or consultation advice or investment strategy. The information is not tailored to the investment needs of any specific person and therefore does not involve a consideration of any of the investment objectives, financial situation or needs of any viewer that may receive it. Kindly also note that past performance is not a reliable indicator of future results. Actual results may differ materially from those anticipated in forward-looking or past performance statements. We assume no liability as to the accuracy or completeness of any of the information and/or content provided herein and the Company cannot be held responsible for any omission, mistake nor for any loss or damage including without limitation to any loss of profit which may arise from reliance on any information supplied by Everest Fortune Group.

NZDUSDOvall direction (buy) .I'm only looking for buys and will wait for the market to come to me not chasing it. note this is an analysis and will be valid by confirmations at main zones
