EURUSD: Will Go Up! Long!
My dear friends,
Today we will analyse EURUSD together☺️
The price is near a wide key level
and the pair is approaching a significant decision level of 1.13787 Therefore, a strong bullish reaction here could determine the next move up.We will watch for a confirmation candle, and then target the next key level of 1.13975.Recommend Stop-loss is beyond the current level.
❤️Sending you lots of Love and Hugs❤️
Forex market

Why EUR vs GBP Could Be Your Best Trade This Week!When it comes to forex swing trading or even forex intraday trading, the temptation to zoom into lower timeframes—like the 15-minute or 1-hour charts—is strong. Most forex traders focus on short-term momentum, often diving into scalping strategies that chase quick pips. However, the real edge lies where most don’t look: the higher timeframes, particularly the weekly chart. The EUR/GBP forex pair is a perfect example of these higher timeframes' power, especially when paired with smart money concepts like demand and supply imbalances.
EUR/GBP: A Hidden Gem for Forex Swing Traders
The EUR/GBP Forex cross pair is often overlooked compared to major USD-based pairs. However, for seasoned swing traders and institutional players, EUR/GBP offers deep liquidity, cleaner technical analysis and price action structures, and strong reaction zones that are respected time and time again.
At the end of May 2025, a significant weekly demand imbalance at 0.8384 finally took control of price action—something smart money traders had been anticipating for months. This wasn't a surprise for those watching the higher timeframes. Similar to how the previous weekly imbalance at 0.8299 took control in February 2025, these zones have proven critical in guiding the medium- to long-term direction of EUR/GBP.

USDMXN LONG TERM BUY OPPORTUNITYFX:USDMXN the current bearish trend will make way for bullish continuation.

EU POSSIBLE BUY EU is very rough when it comes to market structure, but there's something special about this pair and that's behavior, it price action tend to move according to how the world behave, I'm going for buy opportunity, let's see how things goes

USD/JPY(20250526)Today's AnalysisMarket news:
Fed's Goolsbee: 50% EU tariffs are an order of magnitude different from the current situation. Such a high tariff level will have a serious impact on the supply chain. In the short term, the Fed needs to wait for the situation to become clear, and the threshold for action is high before then. There is still a possibility of rate cuts in the next 10 to 16 months
Technical analysis:
Today's buying and selling boundaries:
143.04
Support and resistance levels:
144.77
144.12
143.70
142.37
141.95
141.30
Trading strategy:
If the price breaks through 143.04, consider buying, the first target price is 143.70
If the price breaks through 142.37, consider selling, the first target price is 141.95

USDCAD: Long Trade with Entry/SL/TP
USDCAD
- Classic bullish formation
- Our team expects pullback
SUGGESTED TRADE:
Swing Trade
Long USDCAD
Entry - 1.3731
Sl - 1.3673
Tp - 1.3833
Our Risk - 1%
Start protection of your profits from lower levels
Disclosure: I am part of Trade Nation's Influencer program and receive a monthly fee for using their TradingView charts in my analysis.
❤️ Please, support our work with like & comment! ❤️

EURUSD: Short Signal Explained
EURUSD
- Classic bearish pattern
- Our team expects retracement
SUGGESTED TRADE:
Swing Trade
Sell EURGBP
Entry - 1.1383
Stop - 1.1438
Take - 1.1272
Our Risk - 1%
Start protection of your profits from lower levels
Disclosure: I am part of Trade Nation's Influencer program and receive a monthly fee for using their TradingView charts in my analysis.
❤️ Please, support our work with like & comment! ❤️

Usdjpy Usdjpy after hitting tp didn't seecentry till today will buy Usdjpy a counter trade be4 I sell Usdjpy but I will be waiting 4 a reversal candle stick after the trade reach the 4h support zone

EURNZD: Bulls Will Push Higher
Looking at the chart of EURNZD right now we are seeing some interesting price action on the lower timeframes. Thus a local move up seems to be quite likely.
Disclosure: I am part of Trade Nation's Influencer program and receive a monthly fee for using their TradingView charts in my analysis.
❤️ Please, support our work with like & comment! ❤️

GBPCAD: Expecting Bearish Continuation! Here is Why:
The price of GBPCAD will most likely collapse soon enough, due to the supply beginning to exceed demand which we can see by looking at the chart of the pair.
Disclosure: I am part of Trade Nation's Influencer program and receive a monthly fee for using their TradingView charts in my analysis.
❤️ Please, support our work with like & comment! ❤️

EURGBP Expected Growth! BUY!
My dear friends,
Please, find my technical outlook for EURGBP below:
The instrument tests an important psychological level 0.8393
Bias - Bullish
Technical Indicators: Supper Trend gives a precise Bullish signal, while Pivot Point HL predicts price changes and potential reversals in the market.
Target - 0.8412
About Used Indicators:
Super-trend indicator is more useful in trending markets where there are clear uptrends and downtrends in price.
Disclosure: I am part of Trade Nation's Influencer program and receive a monthly fee for using their TradingView charts in my analysis.
———————————
WISH YOU ALL LUCK


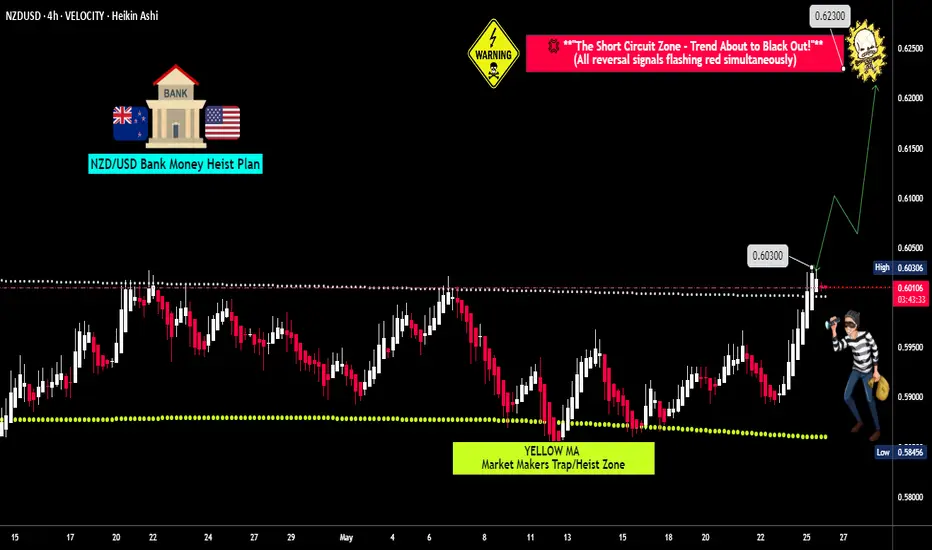
Is This the Next Big Heist? Thief Trader Eyes NZD/USD Long SetupThief Trader’s NZD/USD Heist Plan – Long Setup in Play!
🌍 **Hello Global Wealth Warriors!**
Hello, Bonjour, Ciao, Salut, Guten Tag, Ola!
📢 **Fellow Profit Pirates & Market Mavericks**, it’s time to set sail again! Get ready to loot the forex seas with our latest **Thief Trader Strategy** targeting the **NZD/USD (The Kiwi)** pair.
---
🔎 **Trade Overview**
💥 Setup: Long Entry Plan – Executing our cunning blueprint with Thief Trading's sharp technical & fundamental intel**.
🎯 Target: 0.62300 (or exit just before for safety).
⚠️ Danger Zone: Watch for traps at the RED Zone Level – signs of overbought conditions, consolidation, trend flips & bearish setups.
---
🟢 **Entry Signal** – *The Heist Begins!*
📈 **Primary Entry**:
> Breakout above **MA Line (0.60300)** = Bullish move → *Place a Buy Stop above ATR Line*
📉 **Pullback Option**:
> *Buy Limit* at recent swing low/high on **15 or 30-min TF**.
📌 **Pro Tip**:
Set an **Alert** on your chart to catch the breakout live. Timing is everything!
---
🛑 **Stop Loss – The Getaway Plan**
📍 **SL Recommendation**:
> Recent swing low on the **4H chart (0.59400)** for day/swing trades.
> 🎯 Customize your SL based on risk, lot size, and total orders.
---
🔐 **Scalpers vs. Swingers**
👀 **Scalpers**: Focus ONLY on long-side plays.
💰 Got deep pockets? Dive in.
😎 Otherwise, swing traders – this is your golden moment. Trail your SL to protect profits.
🌐 **Market Pulse** – Momentum Watch
📊 Kiwi is navigating a **MA Resistance Zone**, but bullish bias remains due to:
* **Fundamentals**
* **Macro Insights**
* **COT Reports**
* **Sentiment & Intermarket Trends**
* **Quant Analysis + Overall Score**
📎 Check the linkks for detailed breakdown.
📰 **News Warning!**
⚠️ Major releases ahead?
* Pause entries.
* Protect trades with **trailing SLs**.
---
🚨 **Join the Next Heist with Thief Trading!**
💥 Smash that **Boost** or **Like** to join our profit squad.
With **Thief Trader Style**, we dominate the markets DAILY.
Your support fuels our mission. ❤️💼
---
💸 Stay ready for the next move, money-makers.
🎯 Eyes on the chart – timing is profit.
EURUSD(20250526) Today's AnalysisMarket news:
Fed's Goolsbee: 50% EU tariffs are an order of magnitude different from the current situation. Such a high tariff level will have a serious impact on the supply chain. In the short term, the Fed needs to wait for the situation to become clear, and the threshold for action is high before then. There is still a possibility of rate cuts in the next 10 to 16 months
Technical analysis:
Today's buying and selling boundaries:
1.1337
Support and resistance levels:
1.1434
1.1398
1.1374
1.1300
1.1277
1.1240
Trading strategy:
If the price breaks through 1.1374, consider buying, the first target price is 1.1398
If the price breaks through 1.1337, consider selling, the first target price is 1.1300

AUDUSD(20250526)Today's AnalysisMarket news:
Fed's Goolsbee: 50% EU tariffs are an order of magnitude different from the current situation. Such a high tariff level will have a serious impact on the supply chain. In the short term, the Fed needs to wait for the situation to become clear, and the threshold for action is high before then. There is still a possibility of rate cuts in the next 10 to 16 months
Technical analysis:
Today's buying and selling boundaries:
0.6466
Support and resistance levels:
0.6557
0.6523
0.6501
0.6431
0.6408
0.6374
Trading strategy:
If the price breaks through 0.6501, consider buying, the first target price is 0.6523
If the price breaks through 0.6466, consider selling, the first target price is 0.6431

USD/CAD(20250526)Today's AnalysisMarket news:
Fed's Goolsbee: 50% EU tariffs are an order of magnitude different from the current situation. Such a high tariff level will have a serious impact on the supply chain. In the short term, the Fed needs to wait for the situation to become clear, and the threshold for action is high before then. There is still a possibility of rate cuts in the next 10 to 16 months
Technical analysis:
Today's buying and selling boundaries:
1.3768
Support and resistance levels:
1.3923
1.3865
1.3827
1.3709
1.3671
1.3614
Trading strategy:
If the price breaks through 1.3768, consider buying, the first target price is 1.3827
If the price breaks through 1.3709, consider selling, the first target price is 1.3671

EUR/USD VENTAS para hoy dia fesstivo en EstEUR/USD in SELL Today
Hello, traders,
Today I’m taking sell positions on the EUR/USD pair. Despite the U.S. holiday, which means lower volume, I see a clear opportunity for a continued bearish move. Price is showing weakness, and my technical analysis supports a further drop.
Caution: because it’s a holiday, the market may show erratic moves or liquidity traps. Proper risk management is essential.
This is my personal entry for today, and I expect more downside pressure throughout the day.
Wishing everyone good pips.

GBPUSD - One More Leg for Bears to Take Over!Hello TradingView Family / Fellow Traders. This is Richard, also known as theSignalyst.
📈GBPUSD has been overall bullish trading within the rising broadening wedge pattern marked in red.
However, it is currently approaching the upper bound of the wedge acting as an over-bought zone.
And the $1.365 - $1.375 is a strong resistance zone.
🏹 Thus, the highlighted red circle is a strong area to look for sell setups as it is the intersection of resistance and upper red trendline acting as a non-horizontal resistance.
📚 As per my trading style:
As #GBPUSD approaches the red circle zone, I will be looking for bearish reversal setups (like a double top pattern, trendline break , and so on...)
📚 Always follow your trading plan regarding entry, risk management, and trade management.
Good luck!
All Strategies Are Good; If Managed Properly!
~Rich
Disclosure: I am part of Trade Nation's Influencer program and receive a monthly fee for using their TradingView charts in my analysis.

AUD/CAD - Strong Sell setup for Bearish movementsHere we can see that we are in a consolidation zone trading in a Bullish channel.
We have a Liquidity Trend Acting as a support zone for price. We are currently waiting for a breakout trade here and actively looking to possibly sell from this active supply zone if we pull into it. I do belive we may sell off sooner but time will tell.
Confluences are a failed Demand zone
Bearish Breakout Trend
Engulfing Bearish Candle theory
Good luck to any traders that may decide to follow. I have 3 Target levels marked out so feel free to follow along and use these levels

The Aussie Dollar Heist Blueprint: "AUD/USD" Long Setup!?🌍 Hello, Global Wealth Warriors! Ciao, Salut, Guten Tag, Ola! 🌟
Fellow Profit Pirates & Market Mavericks, 💸⚡
Unveiling our cunning blueprint to plunder the AUD/USD (The Aussie) forex market, crafted with 🔥Thief Trading’s razor-sharp technical and fundamental insights🔥. Stick to the chart’s game plan, zoned in on a long entry. Our mission? Slip out near the high-stakes RED Zone Level—a perilous spot with overbought vibes, consolidation, trend flips, and traps where bearish bandits lurk. 🏴☠️💰 Celebrate your wins, traders—you’ve earned it! 🎉
Entry 📈 : "The heist is on! Wait for the MA line breakout (0.65200) then make your move - Bullish profits await!"
however I advise to Place Buy stop orders above the ATR line (or) Place buy limit orders within a 15 or 30 minute timeframe most recent or swing, low or high level for Pullback entries.
📌I strongly advise you to set an "alert (Alarm)" on your chart so you can see when the breakout entry occurs.
🛑 **Stop Loss**:
📍 Thief SL parked at the recent/swing low on the 4H timeframe (0.64600) for day/swing trades.
📍 Tailor your SL to your risk appetite, lot size, and number of orders. Stay sharp!
🎯 **Target**: Aim for 0.66300 or make a swift exit just before.
👀 **Scalpers, Listen Up**: Stick to long-side scalping. Got deep pockets? Dive in now! Otherwise, join swing traders for the grand heist. Use trailing SL to shield your loot. 💰
💹 **Market Pulse**: The AUD/USD (The Aussie) forex market is in a ATR Dynamic Resistance zone but leaning bullish, fueled by key drivers. ☝
🌐 Dive into Fundamentals, Macro Insights, COT Reports, Quantitative Analysis, Sentiment Outlook, Intermarket Trends, Future Targets & Overall score.. Check the linkss for the full scoop! 🔗🌍
⚠️ **Trading Alert**: News can shake the market! 📰
🔐 Protect your positions:
- Pause new trades during news releases.
- Use trailing stop-loss to lock in gains.
💪 **Join the Heist**: Smash the Boost Button to supercharge our robbery squad! 💥 With Thief Trading Style, we rake in profits daily with ease. 🚀 Your support fuels our market conquests. 🤝❤️
Stay tuned for the next daring heist, money makers! 🤑🐱👤🎯

GBP/USD Buy Limit Strategy – Pullback Opportunity at Key BreakouThis trade setup proposes a Buy Limit at 1.3520, targeting a pullback entry after a strong bullish breakout visible on the M30 chart. The 1.3520 level aligns with a recent consolidation and breakout zone, offering a high-probability re-entry spot.
With a tight 45-pip stop-loss and a 100-pip take-profit, this setup delivers a favorable risk-to-reward ratio of 1:2.2. If the pullback holds at this level, price is expected to resume upward momentum toward 1.3620.

EURUSDLast correction has been made. This is a decision zone for EURUSD. So as is for DXY. Will we catapult from here, slingshot, whatsoever or will the gravity work? Momentum will show, momentum is up.

Strategic Buy Limit Setup for EUR/USD: Precision Entry on PBCKPlacing a Buy Limit at 1.1335 offers a more strategic entry point, allowing you to capitalize on a potential pullback to a key support zone before the uptrend resumes. This improves your entry price, maintains a controlled risk, and increases the likelihood of a stronger reward.
By letting the market come to you, you gain a tactical edge while still aligning with the overall bullish momentum of EUR/USD. It’s a smart move for traders who prioritize precision and efficiency in execution.
Let me know if you'd like the complete setup updated with this Buy Limit!
