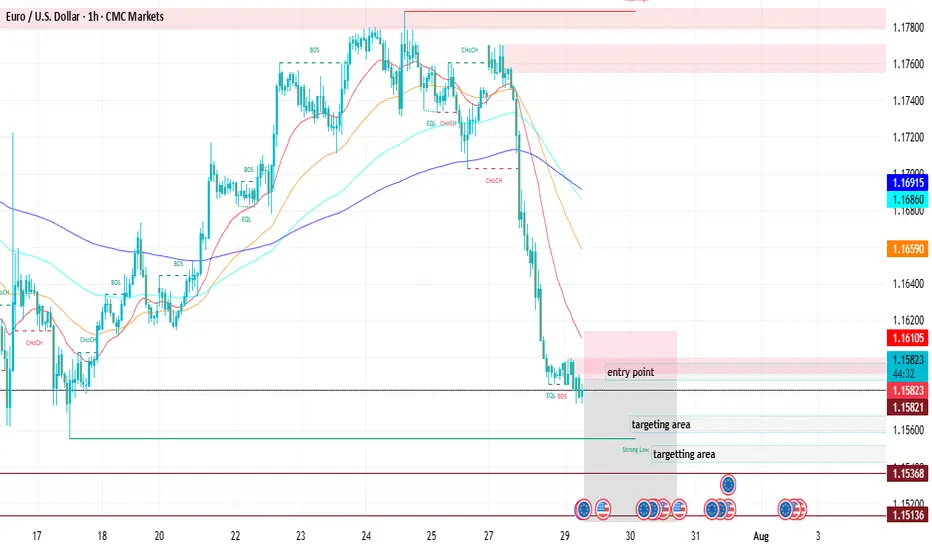
EURUSDTrade Opportunity: EURUSD – Short Position Setup
We have identified a potential selling opportunity on the EURUSD pair, supported by current price structure, momentum shifts, and broader market dynamics. EURUSD is currently facing strong resistance near the 1.15850–1.15900 zone, which has rejected price multiple times in the recent past.
The pair appears to be forming a lower high on the 1H and 4H charts, indicating weakening bullish momentum and the potential start of a downward move.
Entering the trade at 1.15862 allows us to capitalize on early signs of bearish reversal before a possible larger drop unfolds.
The first target at 1.15610 captures a minor support level and could be reached swiftly if bearish pressure persists.
The second target at 1.15480 aligns with the base of a previous consolidation range, offering additional confirmation of downward structure.
The third target at 1.15320 reaches deeper into the last demand zone and could be hit if bearish sentiment intensifies.
The stop loss at 1.15950 is placed just above the recent swing high to protect the trade while keeping the risk tight and manageable.
Forex market
29.07.25 Morning ForecastPairs on Watch -
FX:EURGBP
FX:AUDUSD
FX:NZDUSD
A short overview of the instruments I am looking at for today, multi-timeframe analysis down to what I will be looking at for an entry. Enjoy!

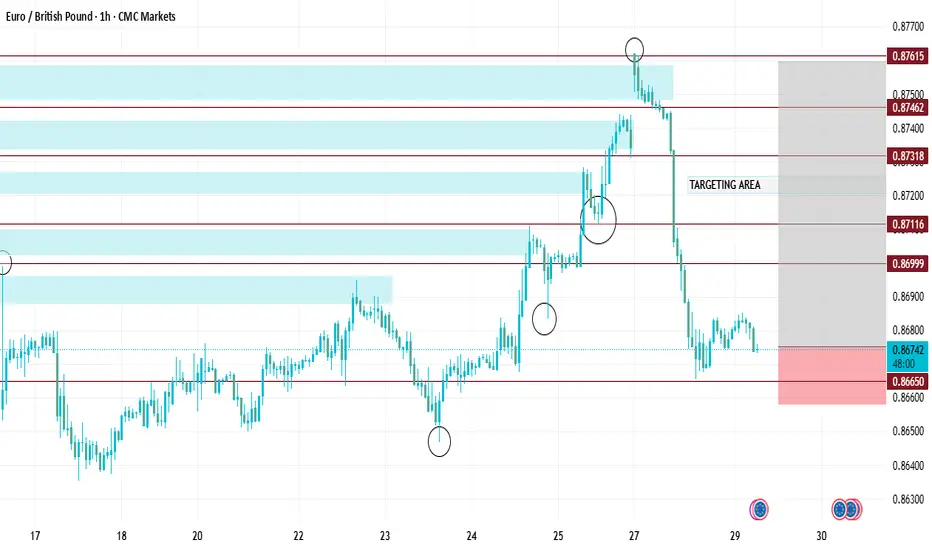
$EURGBP rade Setup: EURGBP – Buy Opportunity Identified We haveOANDA:EURGBP rade Setup: EURGBP – Buy Opportunity Identified
We have spotted a favorable buying opportunity on the EURGBP currency pair, supported by technical patterns and recent market behavior.
EURGBP is showing signs of a bullish reversal after bouncing off a short-term support zone near the 0.86680–0.86700 range.
The entry at 0.86786 offers a strong technical position, just above the support, and aligned with the start of a potential upward swing.
The first target of 0.86850 is modest but strategically placed to lock in quick intraday profits while confirming the upward move.
The first target of 0.86850 is modest but strategically placed to lock in quick intraday profits while confirming the upward move.
The second target at 0.86980 sits at a prior resistance level, which has historically triggered pullbacks—an ideal mid-term objective.
The third and final target at 0.87100 aligns with a significant psychological resistance zone, offering a well-balanced reward.
GU 29/08 H4 bearish M15 bearishWe are now within our daily demand zone after purging liquidity, after our sell off from silt supply we still haven’t seen price respect a H4 level of supply, I would like to see price pullback for us to consider shorts from this area of interest.
We can see that M15 OF is still chained bearish in order to look for longs we need to see supply fail and demand takeover, we could however see price continue bearish
I still see all structure as bearish so shouldn’t look for longs until we have out FLOR and bullish intention on the M15


#014: USD/SGD SHORT Investment Opportunity
In recent days, an extremely interesting window has opened on the USD/SGD exchange rate, a pair often overlooked by retail traders but highly sensitive to Asian institutional flows. I decided to open a short position, betting on a decline in the US dollar against the Singapore dollar, for a series of structural, real, and measurable reasons.
The US dollar has begun to show clear signs of weakness. Recent macroeconomic data releases have been below expectations, particularly those related to inflation and consumption. At the same time, market expectations regarding interest rates are shifting in the opposite direction from a few months ago: the probability of a rate cut by the Fed by the end of the year is growing. Added to this is a visible decline in open interest on dollar-linked futures contracts, a clear sign that many institutional long positions are being closed. The market simply no longer believes in a strong dollar.
While the US dollar is losing momentum, the Singapore dollar is quietly but solidly strengthening. The Monetary Authority of Singapore has maintained an extremely prudent and conservative monetary policy, and capital flows into Asian markets continue to grow. The Singapore dollar has historically been seen as a regional safe-haven currency, and in an environment where the US dollar is weakening, it becomes an ideal candidate to accommodate new relative strength.
One of the most significant factors in this decision, however, is retail sentiment. Currently, over 80% of retail traders are long USD/SGD. This imbalance is striking. Typically, when the vast majority of non-professional traders are aligned on one side, the market ends up moving in the opposite direction. Institutions, on the other hand, patiently build short positions, taking advantage of excessive retail euphoria. Conventional sentiment is often the best counter-indicator.
Chart and volume analysis perfectly confirm this scenario. In recent candles, we have seen an anomalous spike above resistance, followed by a sharp rejection. This is classic behavior: institutions push the price above a key zone, trigger long retail traders' stops, raise liquidity, and then let the price fall. No news, no macro trigger: just pure manipulation. The structure now has all the characteristics to unload downwards.
The chosen take profit level is not random. It is positioned in an area historically defended by institutions, specifically between 1.27680 and 1.27720. In that range, there are volume gaps, representing the classic unloading zones where banks close positions. Furthermore, FX options show a high concentration of put strikes in that same zone, confirming that options desks are also working to defend a bearish move.
All these elements combined—macroeconomic, behavioral, volumetric, and positioning—lead to a single logical conclusion: shorting USD/SGD at this precise moment is a rational, concrete trade, and consistent with institutional flows. No gambles. No forcing. Just chance, balance and timing.

gbpcadThe entry point of 1.83350 is strategically placed to catch the breakout above minor resistance.
The first target at 1.83480 captures a short-term price retracement zone with high probability.
The second target, 1.83610, aligns with the upper boundary of a recent consolidation range.
The third target, 1.83700, is placed just below a psychological resistance level, offering a solid reward.
A tight stop loss at 1.83200 limits downside risk while keeping the risk-reward ratio favorable (approximately 1:2+).

Understanding Market StructureYou can follow us for more Analysis(Images and Videos) with Precise definition of the Financial Market.ENJOY!!!

Analysis on the Nite Elite PairsYou can follow us for more Analysis(Images and Videos) with Precise definition of the Financial Market.ENJOY!!!

EURUSD BuyPrice did a ‘LG’ off the ‘POI’(looking left). Daily cycle not fully complete. Price should take out asia high.

#011: Long Investment Opportunity on GBP/CAD
After weeks of compression, GBP/CAD is showing clear signs of institutional accumulation. The price recently released a false bearish breakout below 1.8400, followed by a reabsorption and spike with decreasing volumes: a typical "retail flush" structure.
Added to this are clear macro elements:
The pound is supported by a still-tight monetary policy, with the BoE maintaining a hawkish tone.
The Canadian dollar is suffering from declining oil expectations and the risk of a more rapid rate cut by the BoE.
📉 What happened?
The market attempted to "clear" the 1.838–1.840 zone with a rapid, unfollow-through bearish move. This behavior, combined with the Open Interest reading and retail positioning, suggests an institutional entry intention in the area between 1.8375 and 1.8365.
📈 Positioning
A Buy Limit was placed at 1.83740, with a wide Stop Loss at 1.82890, outside any visible hunting zone, and a Take Profit at 1.86280, where profit-taking has historically occurred on similar patterns.
🎯 Main motivations for long
Accumulation visible with stop-hunt below support at 1.8400
Net long GBP futures position
Retail short above 70%, a typical reversal signal
No significant volume obstacles until 1.8620
Psychological resistance already tested (1.846, 1.850)
⏳ Estimated timeframe
The setup could develop over several days, with the first movement as early as today (Friday) and completion by mid-next week. The intention is to follow the banking flow, without anticipating or reacting to emotional price movements.

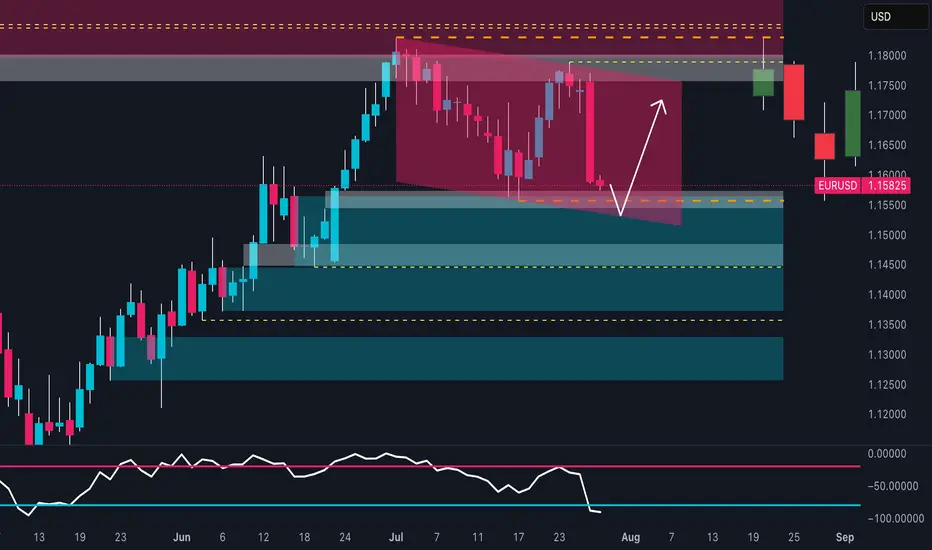
EUR/USD at a Turning Point:Rally or Trap for the Bulls?📉 Technical Analysis
Price has decisively broken out of the descending channel highlighted in recent weeks. The weekly support zone between 1.1540 – 1.1580 is holding, triggering a significant technical reaction. The weekly RSI has entered oversold territory, suggesting a potential short-term reversal.
Key Support: 1.1530–1.1580 (currently reacting)
Key Resistance: 1.1720–1.1780 (inefficiency & supply zone)
Base Case: Potential rebound toward 1.1720–1.1750 before next structural decision
🧠 Sentiment Analysis
82% of retail traders are long, with an average entry at 1.1635
Only 18% are short, a clear minority
This extreme imbalance suggests downside pressure may persist to flush out weak long hands before a genuine reversal takes place.
📊 COT (Commitment of Traders)
USD Index:
Non-Commercials increased both long (+663) and short (+449) positions → uncertain stance but slight USD strengthening
EUR Futures:
Non-Commercials increased long (+6,284) and short (+8,990) positions, but net increase favors the bears
This shift signals a bearish turn in sentiment among large speculators, indicating short-term downward pressure.
📈 Seasonality
In July, EUR/USD historically tends to rise, but:
This year’s price action is underperforming the seasonal pattern, showing relative weakness
August is historically flat to slightly bearish
Seasonality does not currently support a strong bullish continuation
✅ Strategic Conclusion
Current Bias: Bearish-neutral (with short-term bullish bounce expected)
A technical rebound toward 1.1720–1.1750 is likely (liquidity void + RSI bounce + retail imbalance)
However, 1.1720–1.1750 is a key supply zone to monitor for fresh shorts, in line with:
Dollar-supportive COT data
Overcrowded long retail positioning
Weak seasonal context
🧭 Operational Plan:
Avoid holding longs above 1.1750 without macro confirmation
Monitor price action between 1.1720–1.1750 for potential short re-entry
Clean breakout above 1.1780 → shift bias to neutral/bullish
EURJPY ANALYSISAfter seeing the previous daily candle close as an engulfing and trading below the moving average we could be looking for further sell off but with the fundamentals coming out for the day we could see slowed movement till the news comes out

GBPUSD SELL After seeing the previous daily close below the low of the weekly bullish support we could expect this pair to continue its move down following the 4hr structure now at a low point we could see a retracement into the Fibonacci area

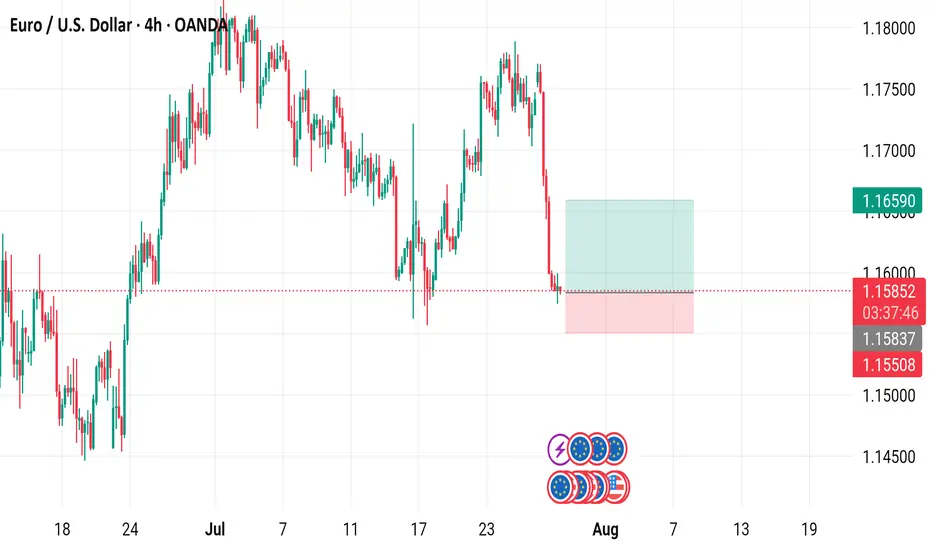
EUR/USD 4-Hour Chart Analysis4-hour performance of the Euro/U.S. Dollar (EUR/USD) currency pair, showing a recent decline from a high of 1.15853 to 1.15845, with a -0.04% change. Key levels include a "Buy" signal at 1.5 and a "Sell" signal at 1.15838. The chart highlights a significant drop with a shaded support zone around 1.16590 to 1.15845, indicating potential trading opportunities or resistance levels as of July 29, 2025.
GBPUSD BUY TIGER SETUP LOOOOOOOOOOOONGwelcome
we have strong mitigation order block on time frame weekly and daily
and on 4H we have break downtrend and retest on it
and we in well discount area
and we have demand on high time frame
so this is good idea for buying
Don't forget to follow me
so that get refresh analysis

EURUSD 3:1 Intraday SnipeThe H4 Doji on resistance
The downtrend on H4 H1 and M15
We are just shorting to next support
With a stop above m15 / h1 resistance nearest one - pretty solid also
3:1 Risk Reward
75%-80% odds (my rank)

EUR/USD: Follow the yellow brick roadHello traders
I have utilized MTF(Multiple Time Frame) analysis for this idea in addition to the current fundamental environment.
The previous weekly levels can often be a good starting point for where this widely traded pair may head next.
On these charts, price has failed ahead of the weekly close of 1.1775. So far.
Fundamentally, the details of the USA/Euro Zone trade deal or framework for a deal, are not very clear yet. Which industries will be hit the hardest in Europe? Fine French wines, Stinky Swiss cheese, Monster M cars from BMW? Take your pick. In my mind, as a consumer, both the USA and the Old Country have significant strengths in different arenas.
As American consumers, we are now going to be forced to some degree to become price conscious one way or the other. Or maybe not. I'll still be sipping California, French or New Zealand wines.
As for the economy:
These "deals" DJT has made so far with Japan and the Euro Zone, once again, smacks of a strong arm policy, more than a reasonable and fair agreement. Time will be the deciding factor. As we have seen over time, trade agreements mean nothing. The WTO is a toothless institution.
The IEEPA ruling heads for the Federal Appeals Court this week and no doubt all the way to the Supreme Court.
However, based on the available information, I am observing the charts by looking back at how the markets react at the Sunday open. It tends to retest weekly OCHL levels first.
As for the USA/EURO zone deal, if it plays out according to news reports, it seems to be logical that a lot of Euros will have to be converted to USD.
But feel free to correct me.
Therefore, until Wednesday and the FOMC presser, I am short EUR/USD.
Best of luck.

EURJPY Bearish continuationAfter daily closed with strong bearish engulfing, i'm expecting another bearish movement today.
Asian session we saw price moving down broke 172 price level.
I plan to wait at 172 area to enter sell.
calculate your own risk & reward.
Good Luck

EURUSD may fall, but it's all about the FOMC DecisionEURUSD may fall, but it's all about the FOMC Decision
During the first 2 weeks of July, EURUSD fell from 1.18000 to 1.1550 and then the price rose again due to renewed tariffs.
Trump's comments regarding Powell and tariffs, according to which the EU and the US may reach an agreement soon, renewed the strength of EURUSD.
However, this time it is more related to the FOMC. If the FED cuts rates, EURUSD can drop further. When they didn't cut rates, the USD was weak or didn't move at all.
Let's see.
If Powell makes any surprises this time, EURUSD could fall, as shown in the chart, from 1.1800 to 1.1550, which is almost 250 pips lower.
Key support zones: 1.1660 and 1.1580
You may find more details in the chart!
Thank you and Good Luck!
PS: Please support with a like or comment if you find this analysis useful for your trading day
Disclosure: I am part of Trade Nation's Influencer program and receive a monthly fee for using their TradingView charts in my analysis.

GBPUSD Week 31 Swing Zone/LevelsPEPPERSTONE:GBPUSD keeps giving and simply does.
Strategy for this week is highlighted; sell at the zone and look for buy around 33683.
Zones/Levels are calculated based previous Week X's difference High & Low (dHL)
Trade Parameters:
sl: 10-15pips
dTP: dynamic TP means because momentum can push fast past say 33683, TP is a soft target. However typically 5-10x
As always price action determines trades.

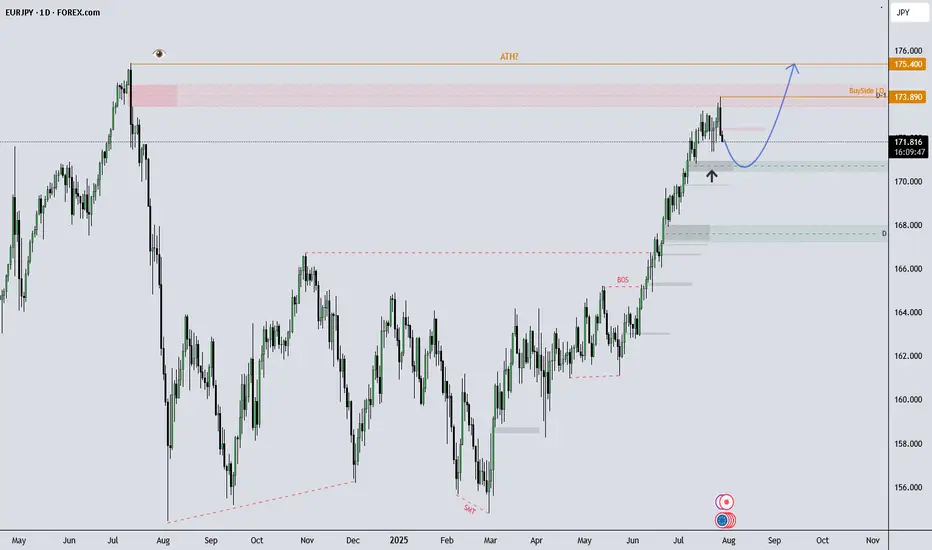
EURJPY Eyes New Highs After Pullback?What I see!
EURJPY Technical Outlook –
EURJPY remains in a strong uptrend and recently tapped into buy-side liquidity at 173.89, which now marks the All-Time High (ATH). After a brief rejection from that level, price is currently showing signs of a healthy pullback.
I’m observing the 170.00–171.00 zone, which aligns with previous demand. If price continues to respect this area, the overall bullish structure remains intact, with potential for a move back toward (and possibly beyond) the ATH.
A sustained break below 170.00 could indicate room for a deeper pullback, potentially toward the 168.00s, which would be a key area to monitor.
This analysis is shared for educational and discussion purposes only.
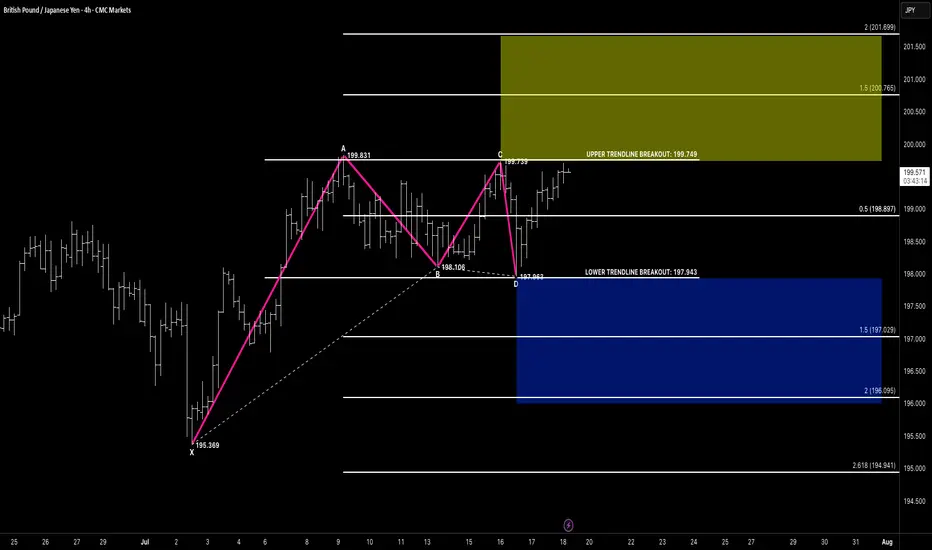
RECTANGLE CHANNELHello awesome traders! 👋
Hope you’ve managed to grab some solid pips from the markets this week. As we head into the weekend, I’m wrapping things up by dropping a few clean chart setups for you to review and reflect on.
Enjoy the weekend, recharge well — and I’ll see you sharp and ready next week for more structure-led opportunities.
📌 Pattern Breakdown
We’ve been tracking a developing rectangle channel between 197.94 (support) and 199.74 (resistance):
🔹 Price formed a clear 4-leg compression
🔹 CD leg bounced off lower support near 197.96
🔹 We’re now approaching the upper edge of the channel at 199.74
🔹 Compression structure suggests breakout potential is building
🚨 Breakout Setup in Focus
🔸 A breakout above 199.75 opens the door toward:
✅ Target 1 Zone:
• 1.5 extension = 200.76
✅ Target 2 Zone:
• 2.0 extension = 201.69
📌 Flip-side: A failed breakout and close back below 197.94 would shift structure toward:
🔻 Bearish Breakdown Targets:
• 1.5 = 197.02
• 2.0 = 196.09
• 2.618 = 194.94
We stay flexible — trade the breakout, not the anticipation.
🧠 Key Concepts in Play
✅ Rectangle consolidation
✅ Breakout-ready structure
✅ Defined upper/lower breakout levels
✅ Volume and reaction at edges = trigger
🗝 Final Thoughts
GBPJPY is boxed in tight — but momentum is clearly leaning bullish.
If we get that clean break above 199.75 with confirmation (volume, close, continuation), the 200.76+ range is firmly in sight. No breakout? No problem — structure has a plan either way.
“Boxes don’t trap the market — they build the tension. Breakouts reward the patient.”