EUR/USD continue with the UptrendOn EUR/USD , it's nice to see a strong buying reaction at the price of 1.13800.
There's a significant accumulation of contracts in this area, indicating strong buyer interest. I believe that buyers who entered at this level will defend their long positions. If the price returns to this area, strong buyers will likely push the market up again.
Strong S/R zone from the past + high volume cluster are the main reasons for my decision to go long on this trade.
Happy trading
Dale
Forex market

EURUSD,GBPUSD,AUDUSD and NZDUSD possible bounce?Hello traders, this is a complete multiple timeframe analysis of this pair. We see could find significant trading opportunities as per analysis upon price action confirmation we may take this trade. Smash the like button if you find value in this analysis and drop a comment if you have any questions or let me know which pair to cover in my next analysis.

EUR/USD 1H AnalysisWhat we’ve got here on EUR/USD looks like a clean Elliott Wave setup shaping up.
There’s a strong 5-wave move up that likely forms Wave 1, followed by a simple ABC correction — that gives us Wave 2.
Now price is reacting from that C point, and this could be the beginning of Wave 3, which is usually the most powerful part of the trend.
🟩 Entry Zone: 1.114 – 1.12
🎯 TP: 1.14
🛑 SL: 1.109
⚖️ Risk/Reward Ratio: 1:3
💡 Note: Always manage your risk and confirm with your own analysis before entering any trade.
Keep an eye on it — could be a solid setup if it confirms. Drop your thoughts if you're trading this too 👇

Short EURUSD To short EUR/USD on a breaker block after a manipulation phase, you need to understand the concept and structure of a bearish breaker block and how it forms following liquidity manipulation and a market structure shift.

NZD/JPY BEARISH BIAS RIGHT NOW| SHORT
NZD/JPY SIGNAL
Trade Direction: short
Entry Level: 85.992
Target Level: 83.908
Stop Loss: 87.366
RISK PROFILE
Risk level: medium
Suggested risk: 1%
Timeframe: 1D
Disclosure: I am part of Trade Nation's Influencer program and receive a monthly fee for using their TradingView charts in my analysis.
✅LIKE AND COMMENT MY IDEAS✅

EUR/USD Hits Key Resistance LevelEUR/USD Hits Key Resistance Level
Although financial markets in both the US and the UK are closed for a public holiday today, Donald Trump is keeping traders on their toes. According to a fresh Reuters report, the US President has backed down from his threat to impose 50% tariffs on EU goods from 1 June, following a phone call from European Commission President Ursula von der Leyen, who urged him to allow time to “reach a mutually beneficial deal”.
This development has boosted the euro while weighing on the US dollar.
As today's EUR/USD chart shows, the euro has risen to its highest level against the dollar since early May. But can the upward trend continue?
EUR/USD Technical Analysis
The ascending trend channel (highlighted in blue) confirms that bullish sentiment currently dominates. However, the EUR/USD chart also presents two bearish arguments worth noting:
→ The price has reached the upper boundary of the channel, which may act as resistance.
→ The 1.1400 level could also serve as resistance. Note how aggressively bears resisted upward movement in April: even when it appeared that the level had been clearly broken from below, the price failed to hold above it for long.
Given this, it is reasonable to suggest that EUR/USD bears may once again become active — particularly if the fundamental backdrop supports them.
This article represents the opinion of the Companies operating under the FXOpen brand only. It is not to be construed as an offer, solicitation, or recommendation with respect to products and services provided by the Companies operating under the FXOpen brand, nor is it to be considered financial advice.

JPY/USD Rising Wedge Breakdown – Bearish Reversal in Play🔎 Technical Breakdown:
1. Rising Wedge Formation:
The pair has been trading within a Rising Wedge, a bearish reversal pattern that forms when price makes higher highs and higher lows but with diminishing momentum. The wedge is visible from the swing low on May 13, where price began to climb aggressively but within increasingly narrow price action. This narrowing range signals weakening bullish strength.
2. Key Resistance Zone:
The wedge forms right below a Major Resistance Zone marked earlier in the chart (around 0.007050), where price had previously faced heavy selling pressure. This adds confluence to the bearish bias, as the zone historically acted as a turning point.
3. SR Interchange Zone:
Below the wedge lies a Support-turned-Resistance (SR) Interchange level, a critical price area where past support may now act as resistance if the price attempts to retrace. This is a commonly watched level by institutional and technical traders.
4. Breakdown Confirmation:
The price has broken below the wedge's lower trendline, which is often considered the breakdown signal. A valid breakdown typically includes a close outside the wedge body followed by a retest or continuation.
5. Bearish Target:
The projected move is toward 0.006796, derived by measuring the wedge height and applying it from the breakdown point. This level aligns with a historical support zone, adding more confluence to the target.
🧠 Psychological & Structural View:
Bullish exhaustion: Buyers pushed price higher into resistance, but momentum slowed, signaling exhaustion.
Trapped longs: Traders who entered late in the wedge may now be trapped, potentially accelerating a sell-off as they exit.
Smart money behavior: Rising wedges near resistance often signal distribution by smart money before a drop.
🛠️ Trading Plan Suggestion (Not Financial Advice):
Entry: After a clear wedge breakdown, consider short entries on a retest of the broken trendline or a bearish candle confirmation.
SL: Above the wedge high or major resistance zone.
TP: Staggered exits below 0.006850 and final target around 0.006796.
🔁 What to Watch For:
Retest of the wedge breakdown (potential short entry zone)
Momentum confirmation via volume or bearish candles
Price reaction at SR Interchange and final support target
🧠 Minds Section – Condensed Summary
JPY/USD formed a Rising Wedge below major resistance, signaling bullish exhaustion. Price has broken down from the wedge, confirming bearish momentum. A clean breakdown targets 0.006796, with SR interchange acting as a minor support. A retest of the wedge breakdown could offer a good short opportunity.

Hellena | EUR/USD (4H): LONG to the resistance area 1.14048.Dear colleagues, it appears that this week started with a downward movement. It was decided to replace the last forecast with a new one, because the price is updating the minimum of wave “4”, now the formation of wave “c” of medium order is taking place.
I believe that the upward movement to the area of 1.14048 will start again and we have 2 options:
1) market entry
2) working with pending limit orders closer to the 1.09794 area.
Manage your capital correctly and competently! Only enter trades based on reliable patterns!

NZDJPY BULLISH OR BEARISH DETAILED ANALYSISNZDJPY has just completed a clean breakout from its descending channel, and we are now setting up for a potential bullish continuation. The breakout above the channel resistance confirms a reversal of the prior downtrend, signaling fresh bullish momentum in play. Price is currently hovering around 85.90, and I’m targeting a move toward 91.90 in the coming weeks as market structure shifts in favor of buyers.
Fundamentally, the New Zealand dollar is gaining strength following the RBNZ's recent hawkish stance. Despite global rate cut expectations, the RBNZ has held firm, emphasizing inflation remains elevated and may require prolonged tight policy. This divergence from other central banks, particularly the BoJ, gives NZD an upper hand. On the flip side, the Japanese yen continues to show weakness due to the BoJ's ultra-loose monetary stance, and there's still no concrete signal of a shift toward tightening. Yield differentials remain wide, fueling carry trades in favor of NZD.
Technically, the breakout is supported by strong bullish candles and increasing volume. The breakout level around 85.60 is now acting as fresh support, and as long as we hold above that zone, the bullish bias remains valid. The structure suggests momentum is building toward 88.50 as the next minor resistance, and a break above that could accelerate the rally to our full target at 91.90.
From a risk-reward perspective, this setup remains favorable. I'm closely monitoring bullish continuation patterns on lower timeframes to scale in. NZDJPY appears primed for a potential upside surge, supported by both fundamentals and technicals, and I’m looking to ride this trend as long as the current momentum holds.

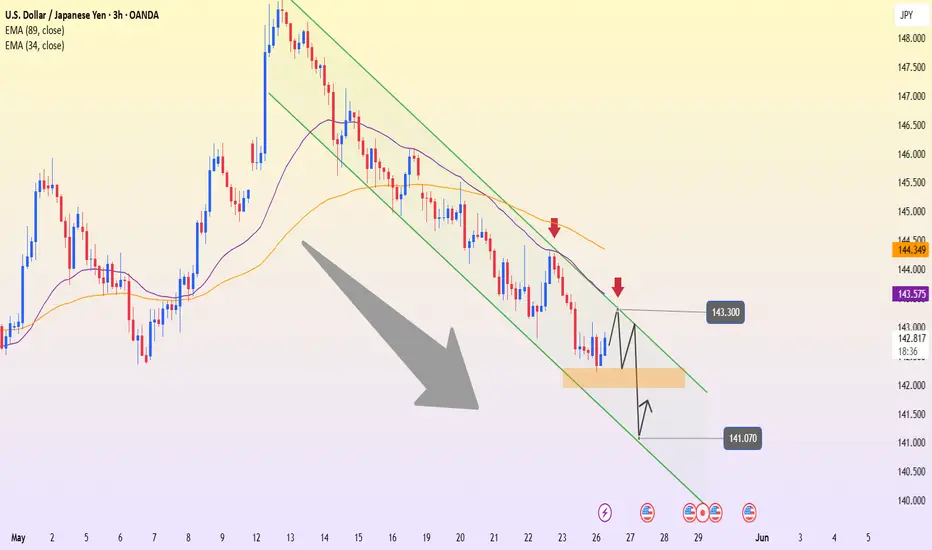
USDJPY – Bearish Channel Holds, Eyes on Support BreakUSDJPY is currently trading within a clearly defined bearish channel on the 3H timeframe, consistently forming lower highs and lower lows. After a slight bounce from the 142.50 support zone, the price is now heading toward the 143.30 resistance area — which aligns with the upper boundary of the channel. This is a zone likely to face rejection and renewed selling pressure.
On the news front, Moody’s recently downgraded the U.S. credit rating due to concerns over prolonged budget deficits, putting pressure on the USD. Although the interest rate gap between the Fed and the BoJ still favors the dollar, current market sentiment is making it harder for USDJPY to maintain a strong rally.
If the 143.30 resistance holds, the price is likely to be pushed back down to retest the 141.07 support zone — a previous low and the lower boundary of the descending channel. A confirmed break below this level would signal further downside, with the next target below the 140.00 mark.
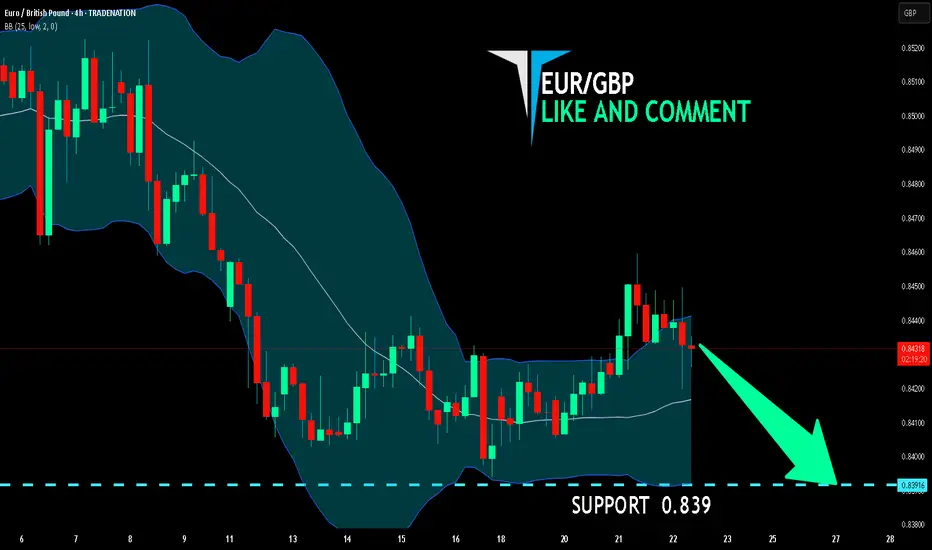
EUR/GBP BEARS ARE GAINING STRENGTH|SHORT
Hello, Friends!
EUR/GBP pair is trading in a local downtrend which know by looking at the previous 1W candle which is red. On the 4H timeframe the pair is going up. The pair is overbought because the price is close to the upper band of the BB indicator. So we are looking to sell the pair with the upper BB line acting as resistance. The next target is 0.839 area.
Disclosure: I am part of Trade Nation's Influencer program and receive a monthly fee for using their TradingView charts in my analysis.
✅LIKE AND COMMENT MY IDEAS✅
Buy level usdchfStrong buy opportunity
Wait to sweep low and monthly candel close then enter into buy with confirmation

Perfect buy level usdcadOur last selling idea almost hited tp
Now we looking it for buy side
Wait to reached our level then enter into buy with confirmation

USDCAD - NEW BREAKDOWN !Hello Traders !
After a huge bearish move, The USDCAD price broke the support level (1.37506 - 1.37814).
This key level becomes new resistance!
So, I expect a new bearish move📉
_______________
TARGET: 1.36480🎯

GBPUSD - Technical analysis 2HGood morning, traders, dear TradingView. It's Nika.
I want to share this trading idea, for a reason we have very important resistance level breakout!
I think the price of this pair will continue growing and will reach level 1.37097!
So some of you can just open long now, or wait and enter after a little correction.
Thank you.
Have a profitable day.

DeGRAM | EURUSD held the accumulation zone📊 Technical Analysis
● Two-year rising channel is intact; price just rebounded from the lower rail (RB) and punched back above the 2020-2024 red resistance trend-line, repeating the 2022 “break-retest-fixation” pattern.
● An 18-month accumulation rectangle (1.06-1.13) has resolved higher, printing a bullish weekly engulfing; the measured move points to the channel mid-band / horizontal cluster at 1.1600, then the upper rail near 1.1950.
💡 Fundamental Analysis
● Eurozone core CPI is stuck at 2.7 % y/y while US ISM and housing prints cooled, dragging real U.S. yields lower and narrowing the policy-rate gap priced for 2025.
✨ Summary
Long above 1.1214; breakout projects 1.16 ➜ 1.195. Risk flips only on a weekly close back below 1.108.
-------------------
Share your opinion in the comments and support the idea with like. Thanks for your support!

Sell gbpusdHere gbpusd strong opportunity comes
Reached to our first selling level mostly chances to drop minimum 300 pips weekly and daily too overbought pair

EURUSD 338PIPS LIVE TRADE AND BREAKDOWN EUR/USD sticks to gains near 1.1400 as Trump extends EU tariff deadline
EUR/USD consoldiates latest gains near 1.1400 in the European session on Monday. The pair draws support from persistent US Dollar weakness and US President Donald Trump's extension of the 50% tariff deadline on the European Union (EU) until July 9.

NZDCAD - TECH.Hello everybody! It's Nika.
As we can see, we have triple bottom support. Maybe not only that, but here is also rising support channel.
Have a nice trade.

GBPAUD - One More Leg for Bears to Take Over!Hello TradingView Family / Fellow Traders. This is Richard, also known as theSignalyst.
📈GBPAUD has been overall bullish trading within the rising channel marked in blue.
However, it is currently approaching the upper bound of its channel acting as an over-bought zone.
And the $2.1 - $2.104 is a strong resistance zone.
🏹 Thus, the highlighted red circle is a strong area to look for sell setups as it is the intersection of resistance and upper blue trendline acting as a non-horizontal resistance.
📚 As per my trading style:
As #GBPAUD is around the red circle zone, I will be looking for bearish reversal setups (like a double top pattern, trendline break , and so on...)
📚 Always follow your trading plan regarding entry, risk management, and trade management.
Good luck!
All Strategies Are Good; If Managed Properly!
~Rich
Disclosure: I am part of Trade Nation's Influencer program and receive a monthly fee for using their TradingView charts in my analysis.

Weekly outlook 5-6-25Weekly outlook 5-6-25 in this video i will show what i am gonna trade for today

Lingrid | EURUSD long Entry Opportunity from Support ZoneThe price perfectly fulfilled my previous idea . FX:EURUSD is pushing higher after breaking through the downward trendline and forming a higher low. Price is currently hovering above the key 1.1320 swap zone and could use this level as support for a bullish continuation. A bounce from this region would open the path toward the 1.1500 resistance inside the upper part of the bullish channel. However, failure to hold 1.1320 may trigger a deeper pullback into the rising trendline.
📈 Key Levels
Buy zone: 1.1300 – 1.1320
Buy trigger: bullish bounce from 1.1320
Target: 1.1500
Sell trigger: break below 1.1300
💡 Risks
Weak Eurozone data could derail bullish setup
USD strength on Fed hawkishness may stall recovery
Trendline break would signal bearish reversal structure
Traders, if you liked this idea or if you have your own opinion about it, write in the comments. I will be glad 👩💻

EU Market Breakdown – Key Liquidity Zones & Bias for Today Today’s analysis focuses on the current structure and price behavior of EURUSD.
We're identifying key liquidity zones, watching for trap setups, and aligning bias with HTF direction.
🔍 Watch for:
Major stop hunt zones
Potential displacement moves
Where price may reject or sweep
ARX style: Precision Over Prediction
Stay patient. Wait for confluence. Strike like a sniper. 🎯
