EUR/USD ADDED TO THE WATCHLISTPrice has fallen dramatically so we are on watch for a possible reversal (maybe short term) pattern to appear. Momentum is very low and looks prime to go up. We will need a hammer candle, with an engulfing confirmation candle, strong volume and in a best case scenario strong support to come off of. We will keep watching this one.
Forex market

EUR/CAD ADDED TO WATCHLISTLike the other Euro markets this one is falling hard, we are watching for a possible reversal pattern to show up. Momentum is very low so we could see a rubber band effect here. Keep watching.

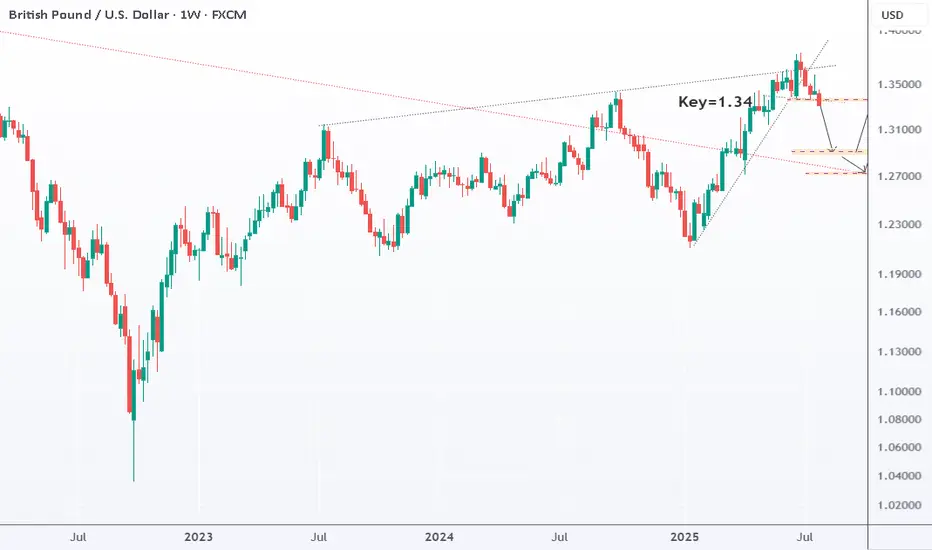
GBPUSD: Bearish toward 1.29 GBPUSD has broken below its recent uptrend and top structure. It’s now heading toward 1.29 and could drop as low as 1.273. That 1.273–1.29 zone is key — if it holds, we could see a new strong uptrend toward 1.40 and above. The bearish move stays in play as long as price remains below 1.34. But the bullish case also stays valid if price holds above 1.273.
EURUSD Long, 29 JulyReversal Setup from Daily OB + LTF Confluence
Price tapped into a Daily Bullish OB with 50EMA support, signaling potential for a bullish reaction. While structure isn’t perfect, the overextension and DXY correlation offer strong intraday confluence.
📈 HTF Confluence:
✅ Sitting inside a Daily Bullish Orderblock
📍 50EMA in the same area → added support
🟢 Expecting a bounce from this zone, even if HTF trend isn’t clearly bullish yet
📉 LTF Context:
💤 Asia range formed, still unfilled → clean liquidity target
📉 Overextended bearish move into 15m POI
🪞 DXY at its own 15m POI + Asia range to complete → supports EU upside
🎯 Entry Plan:
✅ Clear 1m BOS after reacting from 15m Decisional OB
🎯 Entry taken at 5m OB inside that 15m POI zone
⚠️ Decisional OB isn’t ideal, but stacked confluences justify the risk
🛡 SL: Below 5m OB
📌 TP: Asia high + potential continuation if DXY breaks lower

GBPUSD - 28/7/25 - Bearish continuationI do have a bullish trade open current from this zone, but will move the SL to breakeven or take a small loss.
The new idea if the equal low liquidity is swept is to take a bearish trade as shown.

Short GUHNS was formed in H4, coincidently it was formed after it rejected upper trendline. I am going to anticipate 1:1 formation size
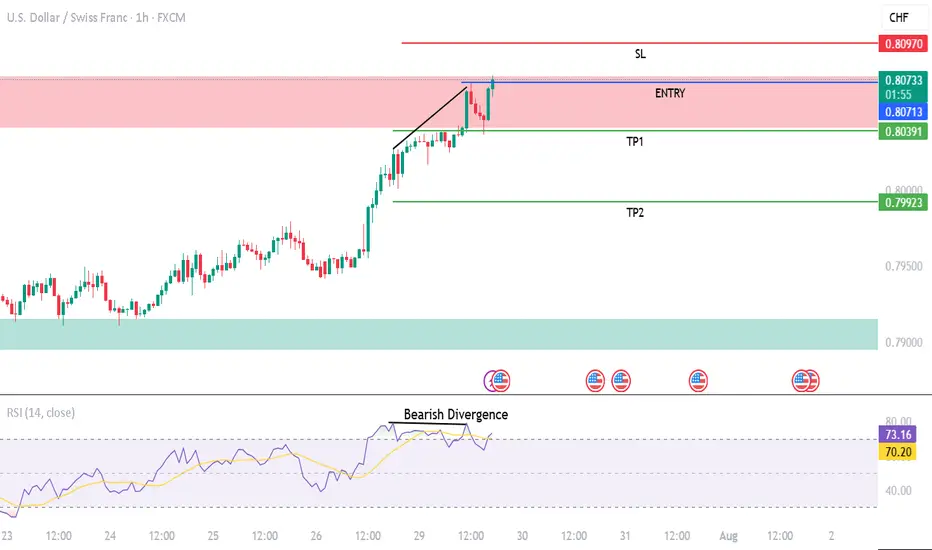
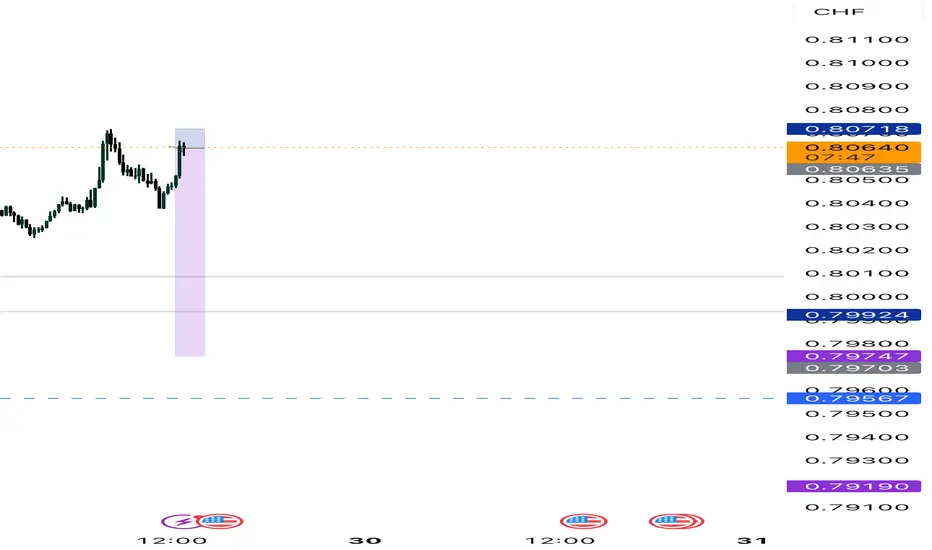
USDCHF - SellThere is a strong bearish divergence on USDCHF and a trend reversal could be possible therefore going short.

Sell gbpusdOur last selling idea already running 500+ pips in selling
More drop expected as USD gonna stronger all cross pairs
Daily support already breaks and also breaks the lower higher low

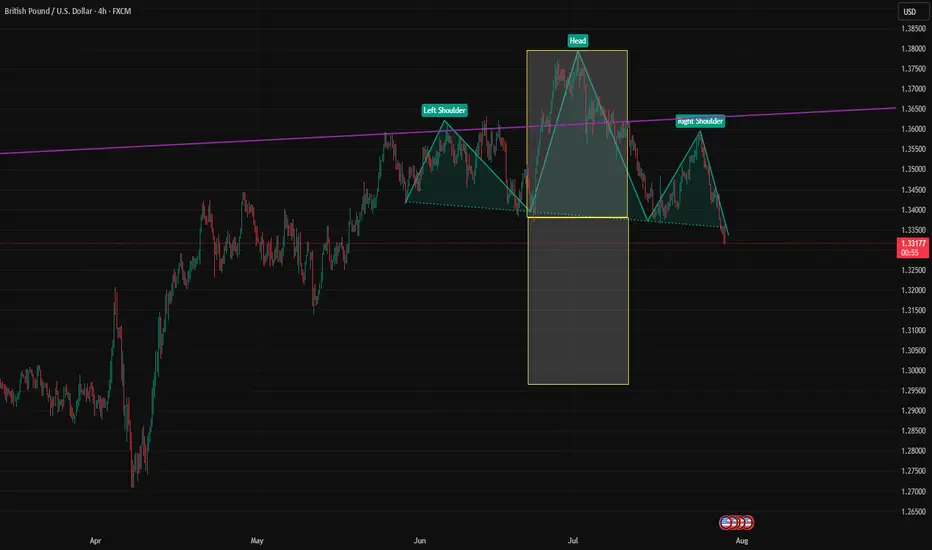
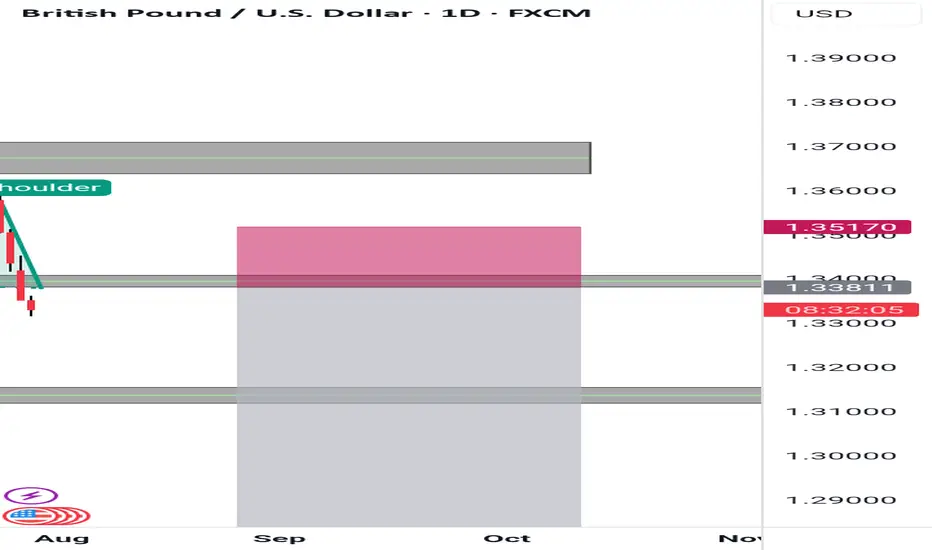
Gbpusd for short.Price was previously bullish, formed a head and shoulders pattern, broke the neckline. Wait for retest and short
NZDUSD long trade dated 29 July 2025- Breakout of last LH will suggest that the odds are in favour of the long trade
- Presence of a bullish AB=CD pattern increases our chances. However entry set via Buy Stop after confirmed trend reversal

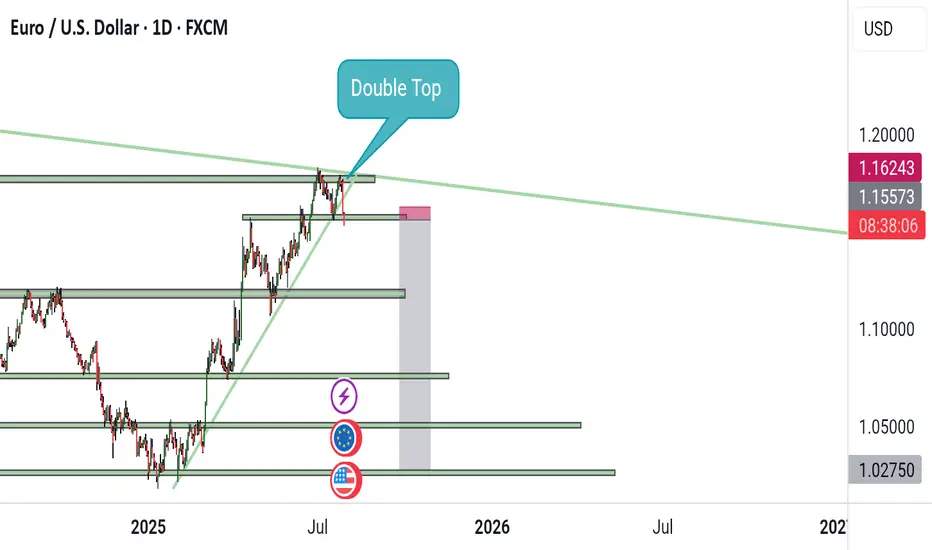
Eurusd is bearish Price was previously bullish, formed a double top on the Higher time frame. Wait for retest of the broken support zone and opt for a buy.


GBPUSD Bullish Retracement into NY KillzoneSetup Break above the Asian high (1.33600) leaves inverse SIBIs at:
4 h – 1.33610
1 h – 1.33440
15 m/5 m cluster – 1.33280
Entry & Stops
Primary: 1.33280–1.33320 (5 m/15 m cluster)
Alternate: 1.33440 retest (1 h SIBI)
Stop: below 1.33150 (Asian low)
Targets
1.33600 (Asian high)
1.33610 (4 h SIBI)
Trade Management
Move SL to breakeven at 1:1 R :R
Scale 20% at TP1
Trail SL beneath each lower‐timeframe SIBI
Watch for volume/VWAP confirmation into NY session
Chart markers: entry zone, SL line, TP levels, SIBI arrows. Trade your edge—let the killzone fuel it.

Sell eurusdOur last selling idea already running 300+ pips now
Still monthly overbought
Euro remains weak among all cross pairs
Daily buy trend already breaks and also lower high

EURUSD: Bullish Continuation is Expected! Here is Why:
Remember that we can not, and should not impose our will on the market but rather listen to its whims and make profit by following it. And thus shall be done today on the EURUSD pair which is likely to be pushed up by the bulls so we will buy!
Disclosure: I am part of Trade Nation's Influencer program and receive a monthly fee for using their TradingView charts in my analysis.
❤️ Please, support our work with like & comment! ❤️

GBP/USD Bearish Breakdown with Downside PotentialThe GBPUSD chart indicates a bearish trend, with price breaking below a key ascending support line. This breakdown suggests a shift in momentum, favoring sellers. The price is currently trading below the Ichimoku cloud, which reinforces the bearish bias. A pullback to the broken support zone may offer a retest before further decline. The structure points toward lower lows, and the chart outlines two potential support levels where price may react. Continued downside is expected if the current resistance zone holds. Bearish continuation appears likely as long as price remains below the recent high and beneath the cloud.
Entry Sell: 1.33360
First Target point: 1.32250
Second Target point: 1.30000
If you found this analysis helpful, don’t forget to drop a like and comment. Your support keeps quality ideas flowing—let’s grow and win together! 💪📈

AUDNZD: Short Signal Explained
AUDNZD
- Classic bearish formation
- Our team expects fall
SUGGESTED TRADE:
Swing Trade
Sell AUDNZD
Entry Level - 1.0926
Sl - 1.0929
Tp - 1.0920
Our Risk - 1%
Start protection of your profits from lower levels
Disclosure: I am part of Trade Nation's Influencer program and receive a monthly fee for using their TradingView charts in my analysis.
❤️ Please, support our work with like & comment! ❤️


GBPJPY SellLIT cycle combined with Daily cycle. Price is overall bearish as it took liquidity on higher time-frames and we should be trading away from the inducement.

Eyes on the Break USDJPY Approaches Key Resistance with Bullish.USDJPY Technical Outlook Bullish Momentum Gaining Strength
USDJPY is currently displaying a strong bullish structure, having taken a clean bounce from the ascending trendline support. This upward movement was further validated as the pair successfully broke through a significant resistance level, triggering a Market Structure Shift (MSS) a clear signal that the prior trend has potentially reversed or evolved.
Following the MSS, a Break of Structure (BoS) to the upside has confirmed the continuation of this bullish momentum. The price action is now navigating above the previous demand zone, indicating strong buying interest in that area.
Notably, the market retraced slightly to retest the bullish engulfing zone, reinforcing the strength of buyers at that level. After this healthy retest, price action is once again pushing upward.
Now, all eyes are on the next key resistance zone. If USDJPY manages to decisively break above this level and prints a valid bullish confirmation (such as another structure break, strong candlestick pattern, or liquidity sweep followed by a reversal), it would open the door for an extended upside move, potentially targeting higher time frame liquidity pools.
Traders should closely monitor price behavior around this resistance zone. A confirmed breakout with volume or institutional candle formations could provide an excellent opportunity for continuation buys, in alignment with the prevailing bullish sentiment.
