GBPNZD | 19.05.2025SELL 2.26800 | STOP 2.28800 | TAKE 2.24400 | The pound has been showing gains since the opening of this week's trading. In this pair we expect an approach to the strong resistance in the range of 2.26800 - 2.28500 and reversal of the movement down to the local support. We are also oriented on the publication of economic data this week.
Forex market

gbpcad bearish legstrong possibility of a bearish june for gbpcad. target towards 1.83/82 area near term

USDCADthis will continue his bearish movement probably throught this week . we can only join this trade on retracement if we see the opportunity to join. it is very expensive to buy usdcad for now.

USDJPY Short Setup – Bearish Reversal AnticipatedI'm currently looking for short opportunities on USDJPY. Price action is showing signs of exhaustion near key resistance levels, and I expect a potential reversal in the coming sessions. I'm watching for confirmation via bearish candlestick patterns and possible breakdowns from support zones.
Entry - 142.740
Target area: 142.240
Stop-loss: 142.940


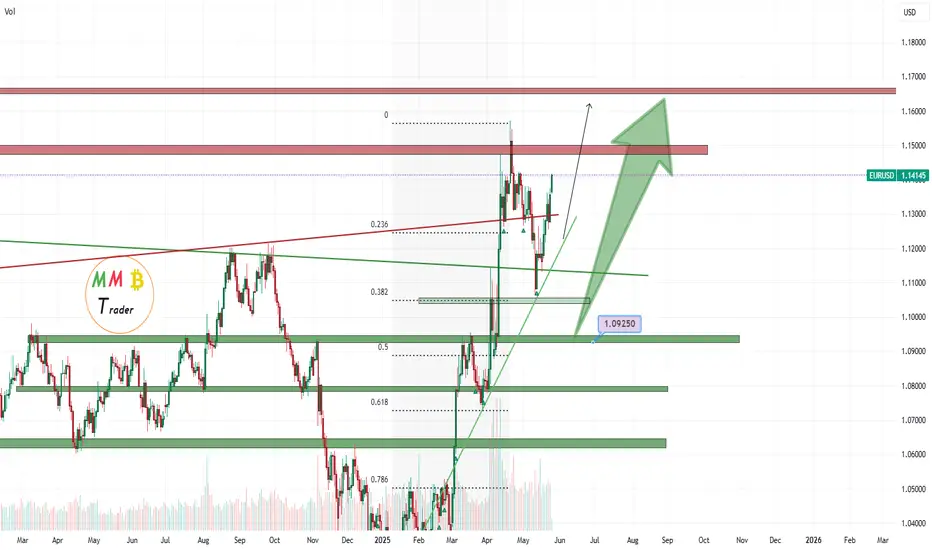
EURUSD 1.17 ahead As we said before major supports here like 1.1005 and 1.1450 can easily hold price and now can pump it to our bullish target which is 1.17 and this week the target can hit.
DISCLAIMER: ((trade based on your own decision))
<<press like👍 if you enjoy💚
GJ-Mon-26/05/25 TDA-Big range, possible scalping buy! Analysis done directly on the chart
Follow for more, possible live trades update!
There are periods when price will push smoothly,
others when price give little pushes and not so
clean. Understanding and reacting to how good
the volume is and price readiness is important to
create a consistent edge in your system.
Not financial advice, DYOR.
Market Flow Strategy
Mister Y

TECHNICAL HOT PICK - EURGBP SHORT FORECAST Q2 W22 D26 Y25🔥👀TECHNICAL HOT PICK
EURGBP SHORT FORECAST Q2 W22 D26 Y25
Professional Risk Managers👋
Welcome back to another FRGNT chart update📈
Diving into some Forex setups using predominantly higher time frame order blocks alongside confirmation breaks of structure.
Let’s see what price action is telling us today!
💡Here are some trade confluences📝
✅Weekly order block
✅15' order block
✅Intraday bearish breaks of structure
✅Tokyo ranges to be filled
🔑 Remember, to participate in trading comes always with a degree of risk, therefore as professional risk managers it remains vital that we stick to our risk management plan as well as our trading strategies.
📈The rest, we leave to the balance of probabilities.
💡Fail to plan. Plan to fail.
🏆It has always been that simple.
❤️Good luck with your trading journey, I shall see you at the very top.
🎯Trade consistent, FRGNT X

EURUSD Breaking Above Resistance Line; Wave 5 In PlayEURUSD moved nicely higher in April, into the 1.15–1.16 area, a resistance where pair slowed down at the end of wave 3, that put retracement in play. However, a pullback has been made in three waves, so its seen as temporary within the broader uptrend. We saw some deeper retracement down to 1,1, near the 38.2% Fib from where we can see some nice turn up, above the trendline resistance so it appears that bulls are in play for wave 5. Therefore, be aware of more upside afte some intraday dips. Support is at 1.1266 area.
GH

GU-Mon-26/05/25 TDA-WR 1.35790 hit, some pullback now?Analysis done directly on the chart
Follow for more, possible live trades update!
I can't, you can't. Nobody can catch every single
move on the chart. Knowing when there are higher
probabilities to win, it's a key to your long term edge.
Not financial advice, DYOR.
Market Flow Strategy
Mister Y

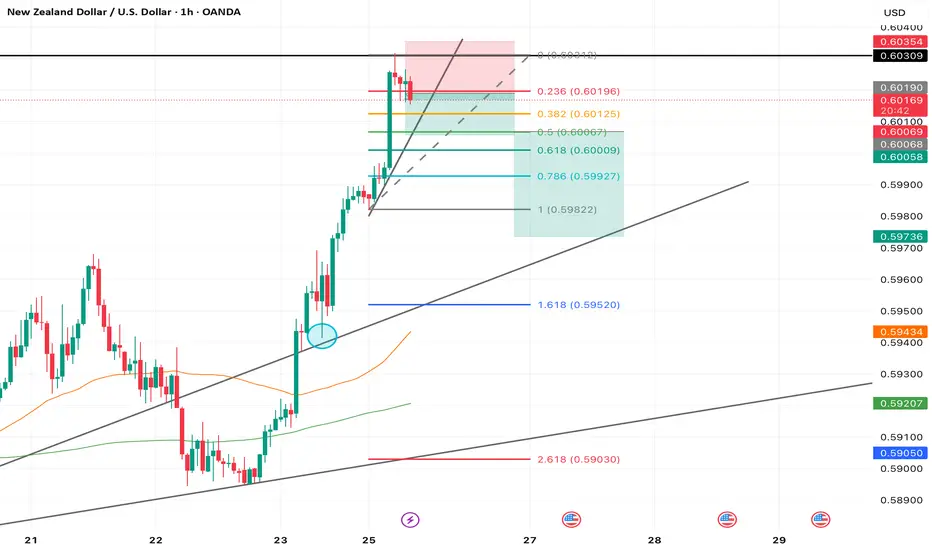
NZDUSD short ideanzdusd short idea price retested high zone resistance and rejected Im expecting price fall back to fib 0.50 or 0.61 level at least taking short
EURAUD Technical & Order Flow AnalysisOur analysis is based on multi-timeframe top-down analysis & fundamental analysis.
Based on our view the price will fall to the monthly level.
DISCLAIMER: This analysis can change anytime without notice and is only for assisting traders in making independent investment decisions. Please note that this is a prediction, and I have no reason to act on it, and neither should you.
Please support our analysis with a boost or comment!

GBPUSD Breaks Out – Is 1.40 Next?In my previous analysis, I highlighted that GBPUSD was trading in a strong resistance zone and warned of a potential correction toward the sub-1.31 support area.
While we did see a brief correction, bears lacked follow-through, and the pair reversed from 1.3136, never quite reaching the expected support zone.
🚀 Break Confirmed – Bulls in Control
After bouncing from just above the support zone at 1.3136, GBPUSD began to consolidate and build pressure right under the key resistance area.
That build-up acted as a launchpad, and now we have a clean breakout, with price trading well above 1.35, currently around 1.3577.
This is a genuine breakout, following a textbook sequence: rejection above support, tight consolidation, and then a decisive push higher — all favoring continuation to the upside.
🎯 W hat’s Next?
The next obvious target is the psychological level at 1.40, which aligns with previous key levels and the overall momentum.
📊 Trading Plan:
The strategy remains simple: buying dips is preferred.
The 1.3450 area is an ideal zone to look for long opportunities, especially if the breakout is retested and confirmed as support.
📌 Don’t chase — let the market pull back, then follow the strength. Momentum is clearly with the bulls. 🚀
Disclosure: I am part of Trade Nation's Influencer program and receive a monthly fee for using their TradingView charts in my analyses and educational articles.

EUR/USD at a Crossroads: Will the Bears Strike Back from 1.14? 📍1. TECHNICAL CONTEXT
EUR/USD is trading around 1.1405, inside an ascending channel and right within a supply zone (1.1370–1.1470), which already triggered a rejection on April 16. Price action currently shows hesitation, with three consecutive candles at the top of the channel and RSI divergence, suggesting a loss of bullish momentum after an overextension.
The bullish trendline from April remains intact and validated, but the upside is narrowing. Likely scenario: bullish exhaustion followed by a pullback towards 1.1270–1.1220, with a potential retest of both the trendline and the lower boundary of the channel.
📊2. COT REPORT (USD & EUR) – Updated to May 20
USD Index: Non-Commercials added +2,044 net longs, but also +1,975 new shorts. Open Interest rose by +2,207 → a more active market, but still mixed. Net exposure remains neutral to slightly bearish for the dollar.
EURO FX: Non-Commercials cut -3,587 longs and added +6,814 shorts, while Commercials increased longs by +16,796. Speculative funds are gradually shifting short on the Euro, while Commercials continue to hedge long.
→ Combined read: Large speculators are reducing their Euro exposure and staying cautious on the Dollar. Short-term pressure on EUR/USD remains bearish, though no macro reversal yet.
📉3. SENTIMENT & POSITIONING
Retail sentiment shows 71% of traders are short EUR/USD — a classically contrarian signal. However, price is now sitting in a liquidity cluster where smart money might exploit a final squeeze before a real reversal.
Market depth shows strong imbalance, with long orders stacked above current price — suggesting potential stop hunt already triggered or about to fade.
🧭4. SEASONALITY
Historically, May is a bearish month for EUR/USD: -0.0079 on 20-year average, and -0.0163 on 10-year average. Seasonality supports late May weakness and potential downside continuation into early June.
✅ TRADING OUTLOOK
📌 Primary Bias: short-term corrective bearish, waiting for clearer reversal signals.
📌 Key Reaction Zone: 1.1400–1.1470 → structural short area, already tested.
📌 Bearish Target: 1.1270 > 1.1210 (golden pocket + trendline confluence)
📌 Setup invalidation: daily close above 1.1470 with volume → possible extension to 1.1550/1.1580
📌 Macro support: Commercials remain long on the Euro → underlying structure still bullish, but too early to fade short-term bearish momentum.

GBPAUD Technical & Order Flow AnalysisOur analysis is based on multi-timeframe top-down analysis & fundamental analysis.
Based on our view the price will rise to the monthly level.
DISCLAIMER: This analysis can change anytime without notice and is only for assisting traders in making independent investment decisions. Please note that this is a prediction, and I have no reason to act on it, and neither should you.
Please support our analysis with a boost or comment!

EUR/USD Daily Analysis – Elliott Wave Structure UnfoldingThe EUR/USD pair continues to follow a well-structured impulsive wave count within an Elliott Wave framework.
🔹 Wave Count:
We appear to be in the early stages of wave (5) of a larger degree impulse. Wave (3) has already completed, followed by a clear ABC corrective structure forming wave (4). This correction retraced to the area around the 1.10636 level, coinciding with the 100-day EMA (blue), which acted as dynamic support.
🔹 Current Structure:
Wave (5) seems to be unfolding with bullish momentum resuming. Minor wave (a)-(b)-(c) correction looks complete, and price action is pushing higher again.
🔹 EMA Confluence:
Price is trading above all key EMAs:
Yellow EMA: short-term
Blue EMA (100): mid-term, recently retested as support
Pink EMA (200): long-term trend still rising
This alignment supports continued bullish bias.
🔹 Targets for Wave (5):
Based on Fibonacci extensions from wave (3):
1.382 extension at 1.17685
1.618 extension at 1.18893
These are potential take-profit zones if the impulsive wave structure completes as expected.
📈 Resistance to Watch:
1.15723: local horizontal resistance
Break above this level could confirm the start of wave (5) with increased momentum.
📉 Support Levels:
1.14088 (prior swing low)
1.10636 (EMA confluence + wave (4) bottom)
💡 Summary:
As long as EUR/USD holds above the 100 EMA and the wave (4) low, the bullish scenario remains valid. Watch for confirmation above 1.1572 to validate the beginning of wave (5) toward the 1.18–1.19 area.
📌 Trade with structure. Manage your risk. Let the wave guide the way.

AUDJPY SHORT FORECAST Q2 W22 D26 Y25AUDJPY SHORT FORECAST Q2 W22 D26 Y25
Professional Risk Managers👋
Welcome back to another FRGNT chart update📈
Diving into some Forex setups using predominantly higher time frame order blocks alongside confirmation breaks of structure.
Let’s see what price action is telling us today! 👀
💡Here are some trade confluences📝
✅Weekly Order block rejection
✅4H Order block identification
✅15' Order block identification
✅4H 50EMA target
✅Daily 50 EMA target
🔑 Remember, to participate in trading comes always with a degree of risk, therefore as professional risk managers it remains vital that we stick to our risk management plan as well as our trading strategies.
📈The rest, we leave to the balance of probabilities.
💡Fail to plan. Plan to fail.
🏆It has always been that simple.
❤️Good luck with your trading journey, I shall see you at the very top.
🎯Trade consistent, FRGNT X

Expectations for a short only if my trendline gets brokenExpectations for a short only if my trendline gets broken but if it holds, then we should be expecting more buys. More analysis coming soon for clarity. Follow for more.

USDJPY buy Swing WeekOpportunity For Buy This week.
Entry; 142.200
SL: 141:980
TP: 148:080
Comments your opinion
For Account management. Connect on X @shajudeakinoba1

USDCHF LONG FORECAST Q2 W22 D26 Y15👀 USDCHF LONG FORECAST Q2 W22 D26 Y25
Professional Risk Managers👋
Welcome back to another FRGNT chart update📈
Diving into some Forex setups using predominantly higher time frame order blocks alongside intraday confirmation & breaks of structure.
Let’s see what price action is telling us today! 🔥
💡Here are some trade confluences📝
✅Weekly order block rejection
✅Daily order block rejection
✅15’ order block
✅Intraday bullish breaks of structure
🔑 Remember, to participate in trading comes always with a degree of risk, therefore as professional risk managers it remains vital that we stick to our risk management plan as well as our trading strategies.
📈The rest, we leave to the balance of probabilities.
💡Fail to plan. Plan to fail.
🏆It has always been that simple.
❤️Good luck with your trading journey, I shall see you at the very top.
🎯Trade consistent, FRGNT X

uptrendThe price is expected to consolidate above the support area and continue the upward trend. A break above the 161.8% level can be a confirmation of the continuation of the upward trend.

EURUSD on the riseEURUSD continues its bullish trend and has broken above 1,1400.
All open buy positions should now be managed with reduced risk.
We expect the trend to continue, but pullbacks are entirely possible.
These corrections will present great opportunities for additional entries and further profits!

IN DEPTH HOT PICK ALERT AUDCAD SHORT FORECAST Q2 W22 D26 Y25🔥IN DEPTH HOT PICK ALERT AUDCAD SHORT FORECAST Q2 W22 D26 Y25
Professional Risk Managers👋
Welcome back to another FRGNT chart update📈
Diving into some Forex setups using predominantly higher time frame order blocks alongside intraday confirmation breaks of structure.
💡Here are some trade confluences📝
✅Weekly 50 EMA
✅Weekly order block rejection
✅Daily order block rejection
✅15’ order block identification
🔑 Remember, to participate in trading comes always with a degree of risk, therefore as professional risk managers it remains vital that we stick to our risk management plan as well as our trading strategies.
📈The rest, we leave to the balance of probabilities.
💡Fail to plan. Plan to fail.
🏆It has always been that simple.
❤️Good luck with your trading journey, I shall see you at the very top.
🎯Trade consistent, FRGNT X
