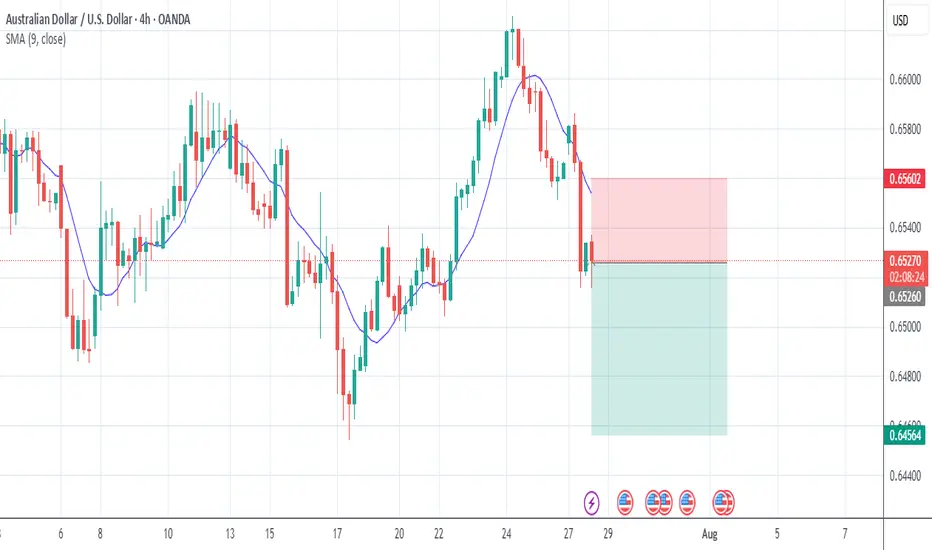
AUD/USD: Rising Wedge Breakdown Signals Bearish ShiftAUD/USD has broken down from a rising wedge formation after rejecting near the 61.8% Fibonacci retracement at 0.6558. This pattern, typically bearish, suggests the recent uptrend is losing steam — a view reinforced by Friday’s strong bearish candle closing below both the wedge support and the 50-day SMA (0.6510).
The price action now sits just above the 200-day SMA (0.6397), a level that could act as a short-term buffer. If this moving average gives way, focus shifts to the prior horizontal support at 0.6170. Meanwhile, upside attempts may find resistance at the broken wedge support and Fib zone near 0.6550.
Momentum indicators support the bearish case:
MACD is flat but biased lower, hovering near the zero line.
RSI has dipped below 50 (currently ~47.7), indicating weakening bullish momentum.
Unless AUD/USD quickly reclaims 0.6550, the path appears tilted toward further losses, potentially targeting the 0.63–0.62 zone.
Bias: Bearish breakdown with downside pressure while below 0.6550. Watch 0.6397 and 0.6170 as key support levels.
-MW
Forex market

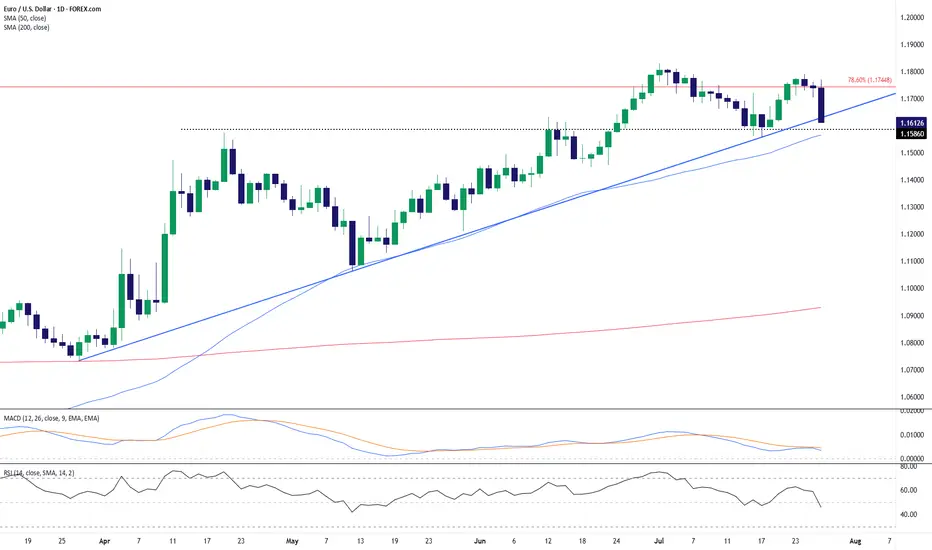
EUR/USD: Breakdown From Key Fib Confluence Threatens UptrendEUR/USD has snapped a key confluence zone after rejecting the 78.6% Fibonacci retracement level near 1.1745. The latest daily candle shows a sharp bearish engulfing bar that sliced below both the ascending trendline and the 50-day SMA (1.1565), signaling a potential trend reversal or deeper correction.
This breakdown follows a multi-week uptrend, and momentum indicators are starting to confirm the bearish shift:
MACD is showing a bearish crossover below the signal line.
RSI has dropped below 50 (currently around 45.8), reflecting weakening bullish momentum.
The pair has now settled just above horizontal support near 1.1586. A decisive close below this level could open the door toward the next support zone around 1.1450–1.1500, where prior consolidation and the rising 200-day SMA (1.0929) may act as stronger demand.
Bulls will need to reclaim the 1.1650–1.1700 zone and see a bullish crossover on momentum indicators to regain control. Until then, the path of least resistance appears tilted to the downside, especially with trendline and Fib support now breached.
Bias: Bearish while below 1.1700. Watch for continuation lower if 1.1586 fails to hold.
-MW
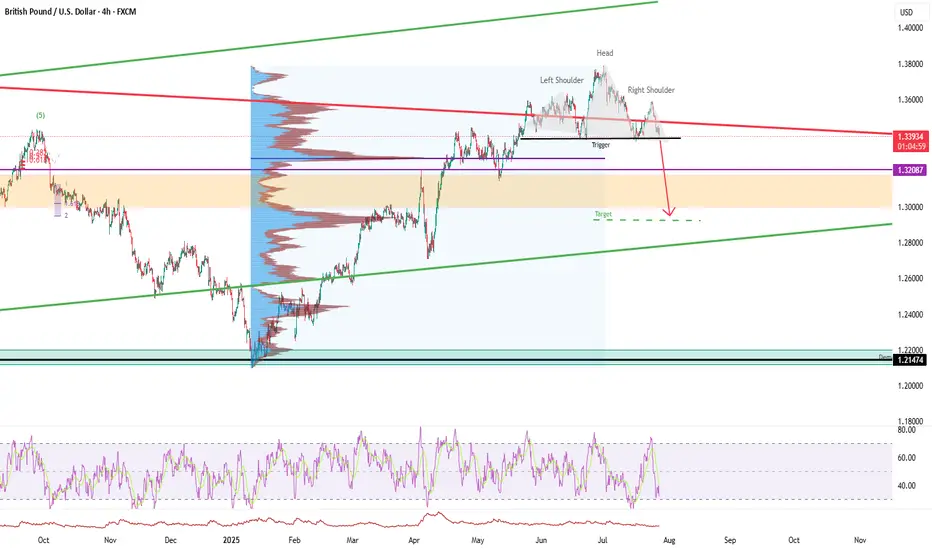
GBPUSD - Head and shoulder Potential break of neck line of H&S .. in this cas we can have a deep retest of support zone
EURUSD ~ Real Time Elliott Wave UpdatesThis is an update of a chart I had previously posted. Here, we can see that Wave 1(Red) has already completed and a pullback occurred soon after, marked as Wave 2(Red) or Wave A(Blue). This has two markings because on one hand it could be a Zigzag formation or it could be the first wave of a Flat correction. All other analysis remains the same as I had previously posted. Sentiment still remains a sell.
@fabrx900

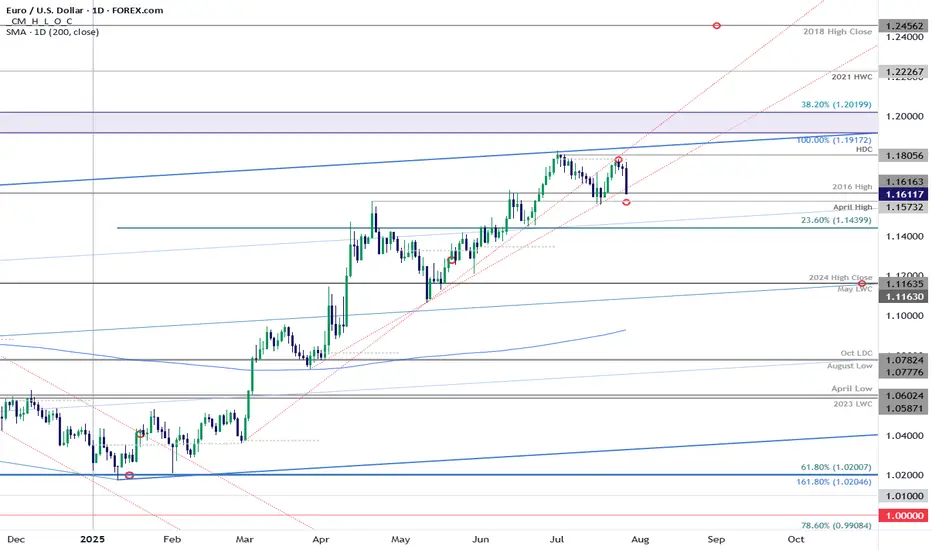
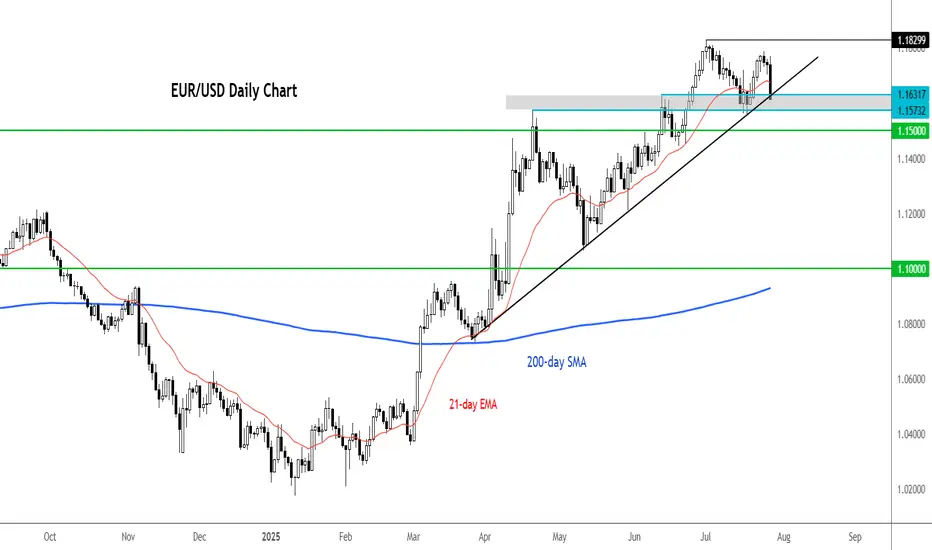
EUR/USD: Euro Poised for Monthly Range Breakout Ahead of FedEuro defended resistance at the monthly opening-range high / July open at 1.1787-1.1805 last week with price plunging back into support today at the late-February trendline / 2016 high at 1.1616.
Medium-term bullish invalidation rests with the April high at 1.1573 and a close below this level would suggest a more significant high is in place / a larger correction is underway. Stay nimble here into the monthly-cross and watch the weekly closes for guidance.
-MB

EUR/CAD: Shorting the Climactic Rally Near 1.6000The strong rally in EUR/CAD has pushed the pair into extreme territory, approaching a major psychological and structural resistance zone. While momentum has been strong, this looks like a potential climactic or "blow-off" top, offering a highly favorable risk/reward opportunity to short the pair in alignment with the weak underlying Euro fundamentals.
The Fundamental Why 📰
The core thesis remains bearish for the Euro. The European Central Bank (ECB) maintains a distinctly dovish tone, signaling a willingness to ease policy further to support a slowing Eurozone economy. This fundamental headwind suggests that extreme rallies in Euro pairs are often exhaustive and present prime shorting opportunities.
The Technical Picture 📊
Major Supply Zone: The price is entering a critical multi-month supply zone between 1.5950 and the key psychological level of 1.6000. This is a major ceiling where significant selling pressure is anticipated.
Fibonacci Extension: This area aligns with a key Fibonacci extension level (1.272) from the last major impulse wave, a common zone where trending moves become exhausted and reversals begin.
Pronounced RSI Divergence: A clear bearish divergence is forming on the daily chart. As price makes this final push to a new high, the Relative Strength Index (RSI) is making a significantly lower high, signaling a deep exhaustion of buying momentum.
The Counter-Trade Rationale 🧠
This is a high-level fade. We are positioning for a reversal at a major, technically significant ceiling. The extreme price extension, combined with clear momentum divergence, indicates that the risk of buying at these highs is substantial. By shorting here, we are betting that the powerful technical resistance and weak fundamentals will trigger a significant correction.
The Setup ✅
📉 Pair: EUR/CAD
👉 Direction: Short
⛔️ Stop Loss: 1.63230
🎯 Entry: 1.59490
✅ Take Profit: 1.52008
⚖️ Risk/Reward: ≈ 2:1

EUR/USD testing bull trend after 1% dropThere are multiple factors weighing on the EUR/USD today. We have seen a broad dollar rally, suggesting that the trade agreements are seen as net positive for the US economy, even it means rising inflation risks. With higher tariffs and Trump’s inflationary fiscal agenda, interest rates in the US are likely to remain elevated for longer.
As far as the euro itself is concerned, the single currency fell all major currencies, which suggests investors were not impressed by the EU’s negotiation tactics. Accepting a 15% tariff on most of its exports to the US while reducing levies on some American products to zero, means the deal will make companies in Europe less competitive. Still, it could have been a far worse situation had we seen a trade war similar to the US-China situation in April. It means that there is now some stability and businesses can get on with things. On balance, though, European leaders will feel that they may have compromised a little too much.
Technically, the EUR/USD is still not in a bearish trend despite today’s sizeable drop. But that could change if the bullish trend line breaks now. If that happens 1.15 could be the next stop. Resistance is now 1.1650 followed by 1.1700.
By Fawad Razaqzada, market analyst with FOREX.com
GBPCHF SHORT Market structure bearish on HTFs 3
Entry at Daily AOi
Weekly Rejection at AOi
Daily Rejection at AOi
Previous Structure point Daily
Around Psychological Level 1.07500
H4 EMA retest
H4 Candlestick rejection
Rejection from Previous structure
Levels 2.98
Entry 100%
REMEMBER : Trading is a Game Of Probability
: Manage Your Risk
: Be Patient
: Every Moment Is Unique
: Rinse, Wash, Repeat!
: Christ is King.

USDJPY LONG setupsimply
we have demand
and the price can't lower low
end we have break of structure on low time frame
and we have more but i don't have enough time to tell you
Look the photo well
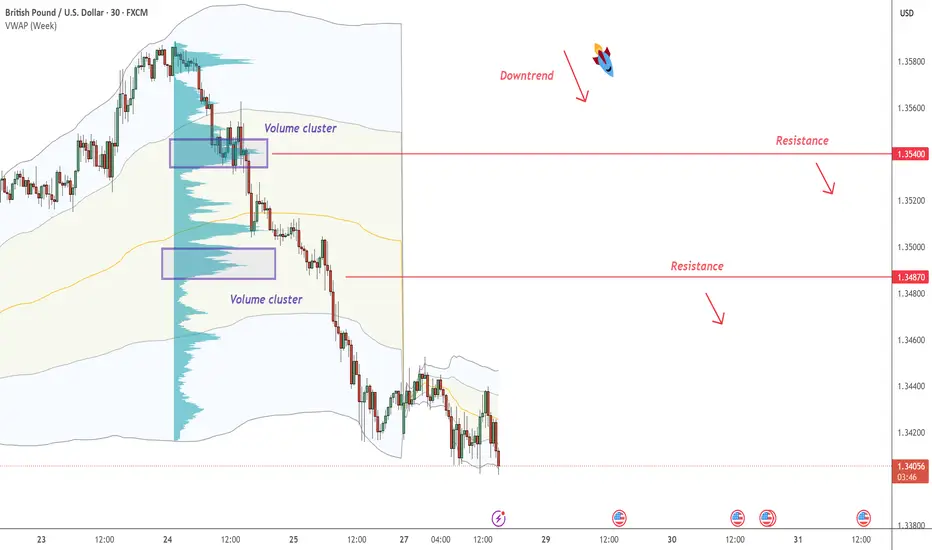
GBP/USD - continues the downtrendOn GBP/USD , it's nice to see a strong sell-off from the price of 1.34870 and 1.35400 . It's also encouraging to observe a strong volume area where a lot of contracts are accumulated.
I believe that sellers from this area will defend their short positions. When the price returns to this area, strong sellers will push the market down again.
Downtrend and high volume cluster are the main reasons for my decision to go short on this trade.
Happy trading,
Dale

EUR USD buy setupHello traders!
This is a possible reversal scenario. Today, we had a pump following Trump’s EU deal, which gave the market a bullish push.
However, just like every mountain climb requires a descent, I’m considering this setup as a potential correction.
⚠️ Important: Keep in mind that this trade goes against the trend! So, it's crucial to wait for a confirmed price close above the marked line before taking action.
If the setup offers a favorable risk-to-reward ratio, you may consider an instant execution. If not, you can place a buy limit order instead.
Also, keep an eye on the upcoming JOLTS Job Openings data—it could shift the market sentiment significantly.
Disclaimer: This is just an idea and not a trading signal. It’s shared for educational and backtesting purposes only. Please do your own analysis before making any trading decisions.

AUD/JPY: Fading the Rally at a Major Resistance ZoneWhile AUD/JPY has been in a clear uptrend, the rally is now approaching a significant technical ceiling where sellers have previously stepped in. We see a compelling opportunity for a counter-trend short, betting that this resistance level will hold and that the current bullish momentum is showing signs of exhaustion.
This trade is for those watching for a market turn, offering a well-defined risk-to-reward setup for a swing position.
🤔 The "Why" Behind the Short Setup
📰 The Fundamental Risk
The Australian Dollar is a "risk-on" currency, meaning it performs well when global markets are optimistic. The Japanese Yen, however, is a classic "safe-haven" asset that strengthens during times of uncertainty. With the upcoming high-impact Australian CPI data, any sign of economic weakness could disappoint the market, increase pressure on the RBA, and trigger a "risk-off" move that would benefit the Yen and send AUD/JPY lower.
📊 The Technical Ceiling
The chart tells a clear story. The price is currently testing a major resistance zone. Attempting to short near a strong ceiling like this provides a strategic entry to capture a potential trend reversal. We are essentially betting that the trend's multi-week momentum will stall and reverse from this key technical juncture.
✅ The High-Clarity SHORT Trade Setup
📉 Pair: AUD/JPY
👉 Direction: Short
⛔️ Entry: 96.716
🎯 Take Profit: 92.080
🛑 Stop Loss: 98.907
Rationale: This setup plays for a significant swing move. The wide stop loss is designed to withstand volatility from news events, while the deep take profit targets a full reversal back to major support levels seen earlier in the year.

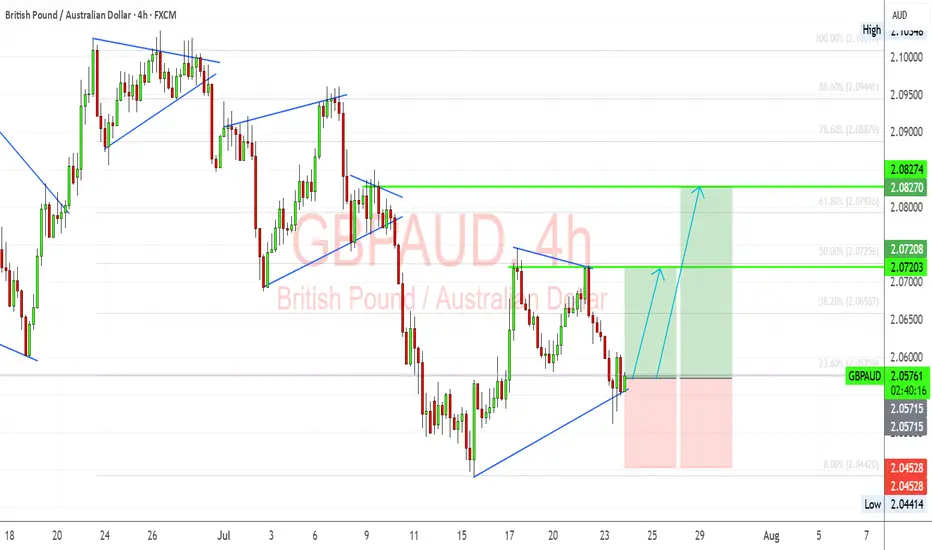
GBP/AUD Trade Setup – Bullish Flag Breakout in PlayGBPAUD has formed a clean bullish flag structure after a significant impulsive move upward. Following the correction, we’re now testing breakout levels with clear Fibonacci confluence and bullish structure support around 2.0560. I'm anticipating a push toward the next resistance levels if buyers defend this trendline.
🔎 Technical Highlights (My View):
Bullish Flag Pattern: The corrective flag has broken to the upside and is being retested. This suggests a possible continuation of the bullish trend.
Fibonacci Support: Price bounced near the 23.6% retracement of the previous bullish leg, which acts as a minor but effective support in trending moves.
Bullish Trendline Holding: The ascending trendline from the July lows continues to act as dynamic support. This shows sustained buyer interest.
Target Zones:
TP1: 2.0720 – aligns with 50% retracement and recent structure.
TP2: 2.0827 – aligns with 78.6% retracement and past resistance.
SL: Below 2.0450 to invalidate the setup.
🏦 Fundamental Context:
GBP Strength: The Bank of England remains more hawkish than the RBA. UK inflation data remains sticky, and traders are still pricing in the potential for another hike if services inflation remains elevated.
AUD Weakness: AUD is under pressure due to soft labor market data and declining commodity demand from China. RBA minutes also struck a cautious tone, which weighs on the Aussie.
China Risk: AUD is sensitive to Chinese sentiment. Current trade and tariff tensions are adding indirect bearish pressure to the AUD.
⚠️ Risks to My Setup:
If Aussie labor or CPI data surprises to the upside, AUD could regain strength.
UK economic data deterioration (e.g., services PMI, wage inflation) could weaken GBP.
Break below 2.0450 would invalidate the bullish setup and suggest potential range continuation.
📅 Upcoming Catalysts to Watch:
UK Retail Sales – A strong print supports GBP continuation.
AU CPI (Trimmed Mean) – Any upside surprise could limit AUD downside.
China Industrial & Services PMI (if released soon) – indirect AUD mover.
⚖️ Summary – Bias & Trade Logic
I’m currently bullish GBP/AUD, expecting a continuation of the prior uptrend now that price has broken and retested the flag structure. Fundamentally, GBP is supported by relatively hawkish BoE expectations, while AUD remains pressured by RBA caution and China-linked macro weakness. My bias stays bullish as long as the trendline holds and Aussie data doesn’t surprise significantly.
audusd sell tradeThe Relative Strength Index (RSI) is showing a downward trend, indicating weakening momentum. Additionally, the Moving Average Convergence Divergence (MACD) is showing a bearish crossover, further supporting the potential for a downward move
Potentially, A Safer Way To Long The EURUSDIn contrast to my previous outlook, the current price action suggests an increased probability of a deeper bearish move—potentially invalidating the buy zone marked out in the previous analysis. This sudden change is largely driven by the prospect of untapped liquidity residing beneath that zone, reinforcing the well-known market principle that price seeks out liquidity before committing to directional moves.
Given this development, the newly identified zone on the chart emerges as a more technically sound and reliable area from which to anticipate bullish interest. It aligns better with the broader liquidity profile and offers a stronger base for accumulation. Traders may opt to wait for confirmations within this zone or, depending on their risk appetite, consider executing buy positions upon price entry.
As always, patience and clarity are key as we allow price to reveal its intention.
Fingers crossed 🤞
Wishing you all a focused and profitable trading week.
Catch you on the next one. 🫡

GBPAUD looks promising individuallybut EURAUD seems to be the leader alone
everyone else is lag behind by far degree
there must be something with eur group

GBPCAD - Long-Term Long!Hello TradingView Family / Fellow Traders. This is Richard, also known as theSignalyst.
📈GBPCAD has been overall bullish trading within the rising wedge pattern marked in blue.
This week, GBPCAD has been retesting the lower bound of the wedge.
Moreover, the red zone is a strong weekly structure.
🏹 Thus, the highlighted blue circle is a strong area to look for buy setups as it is the intersection of the lower blue trendline and red structure.
📚 As per my trading style:
As #GBPCAD approaches the blue circle zone, I will be looking for trend-following bullish reversal setups (like a double bottom pattern, trendline break , and so on...)
📚 Always follow your trading plan regarding entry, risk management, and trade management.
Good luck!
All Strategies Are Good; If Managed Properly!
~Rich
Disclosure: I am part of Trade Nation's Influencer program and receive a monthly fee for using their TradingView charts in my analysis.

chfjpy looks like retracingbut looking from CHF group, most pair not yet make higher low
waiting market to calm down

NZDCHF – Bullish Breakout Sets Stage for ReversalNZDCHF has broken decisively out of a long-term descending channel, signaling a potential trend reversal. Price action confirmed multiple bullish flags within the falling structure, followed by a clean breakout and higher low retest, supporting a bullish continuation bias.
Currently, the pair is stabilizing just above prior resistance turned support around 0.4760–0.4780, forming a potential launchpad for the next leg higher.
Upside Targets:
TP1: 0.48336
TP2: 0.48844
TP3: 0.49319
Invalidation Zone:
A drop below 0.4720 would invalidate the breakout structure and expose the downside.
Fundamental Drivers:
🇳🇿 NZD Strength: RBNZ remains relatively hawkish compared to other central banks, and the Kiwi may gain from improving risk sentiment and easing global recession fears.
🇨🇭 CHF Weakness: Swiss Franc is under mild pressure as safe-haven flows weaken amid improving tone on US-China-EU trade headlines and fading ECB rate cut bets.
🗓️ Macro Flow: Upcoming risk events (Fed comments, trade updates, and NZ economic prints) could inject momentum into the pair, especially if risk appetite improves.
Bias: ✅ Bullish (Buy)
Confidence: ★★★★☆
Watch for: Clean hold above 0.4770 zone + bullish momentum continuation.
