Forex market

Is There Any Chance To Enter Again To Get Extra 250 Pips ?After First Entry Hit My Target +250 Pips , I`m Looking to Enter This pair again next week , we still have a long way to downside , already the new place to sell shown in the chart , don`t miss this chance !
This Is An Educational + Analytic Content That Will Teach Why And How To Enter A Trade
Make Sure You Watch The Price Action Closely In Each Analysis As This Is A Very Important Part Of Our Method
Disclaimer : This Analysis Can Change At Anytime Without Notice And It Is Only For The Purpose Of Assisting Traders To Make Independent Investments Decisions.

My post analysis on GBPCAD tradeMy post analysis on GBPCAD trade. Actually, I was planning to buy GBPCAD in this New York session. Later i discover the trade has change from 1hr/4hrs trade into 4hrs/Daily. We have a guy given us issues on 15mins/1hr timeframe. So we just have to abandon our buy idea till further notice

EUR/USD 3-Year Highs After 200-DMA SupportEUR/USD had pushed six consecutive days of losses after recoiling from Fiboancci resistance late last month. The 1.0943 level held two different resistance tests, with prices pulling back after the FOMC meeting saw Jerome Powell take a wait-and-see approach with regards to both inflation and possible rate cuts.
Normally, a backdrop like that would allow for a build of USD-strength, and we saw that show up as EUR/USD dropped down for a test of the 200-day moving average, but that's around when the weakness started to slow. Buyers responded in a big way and that led to a breakout and fresh three-year highs just a week later.
Notably, before those highs could print it was the same 1.0943 Fibonacci level that held support, and that has some relation to another key level that's so far held support for this week at 1.1275, which is the 61.8% retracement of the 2021-2022 major move.
At this point bulls have retained control of the pair and this week presented another couple of fundamental drivers that would seem to point at reversal, with a strong U.S. retail sales report, a Jerome Powell that sounded somewhat hawkish with inflation expectations around tariffs; and then the dovish ECB rate cut on Thursday. Despite all that - EUR/USD has held up fairly well and it's that deduction that illustrates bullish potential into next week.
For resistance - 1.1500 is huge. This was last in-play in early-2022 and it was resistance on multiple occasions before bears were able to take care of matters. So, chasing breakouts at the big figure could be challenging. Pullbacks could remain attractive and given the response to 1.1275, we can see where buyers had responded quickly to that. Of interest is the 1.1200 level that was hardened resistance in Q3 of last year, and then possibly even the 1.1100 level that held the highs earlier in April. For invalidation of trend, it's the 1.0900-1.0943 zone that I think remains of interest. - js

CHF/JPY At The Same Res Again , Great Chance To Sell & Get 200 PHere is my opinion about CHF/JPY , You can see on D TF , We have a very strong res area forced the price many times to go down hard , so after this big movement to upside we need a little correction to downside , so i`m waiting the price at this res to give me any bearish P.A And then we can enter a sell trade with 250 pips target .

USDJPY 1 HR ChartThis is the 1 HR Chart of USDJPY, I am publishing this chart for further informational analysis. Ideally, further analysis will use smart money concepts, ICT, and wick candle analysis.

USDJPY 15M ChartThis is the 15 M Chart of USDJPY, I am publishing this chart for further informational analysis. Ideally, further analysis will use smart money concepts, ICT, and wick candle analysis.

GBPUSD – Liquidity Sweep & Bearish Market Structure ShiftGBPUSD is showing signs of a potential liquidity grab above a key high. Just above that liquidity area, there’s a Fair Value Gap (FVG), which adds confluence for a potential bearish reversal.
Once the buy-side liquidity is swept, I’m anticipating a bearish Market Structure Shift (MSS). If price returns to the FVG after the shift, that zone would be a potential area for a short entry.
Confluences:
Liquidity above a key high
FVG located just above the liquidity zone
Expected bearish MSS after the sweep
Looking for price to revisit the FVG to confirm a short setup with clean risk management.

USDJPY 1 D ChartThis is the 1 D Chart of USDJPY, I am publishing this chart for further informational analysis. Ideally, further analysis will use smart money concepts, ICT, and wick candle analysis.

NZDUSD 1 D ChartThis is the 1 D Chart of NZDUSD, I am publishing this chart for further informational analysis. Ideally, further analysis will use smart money concepts, ICT, and wick candle analysis.

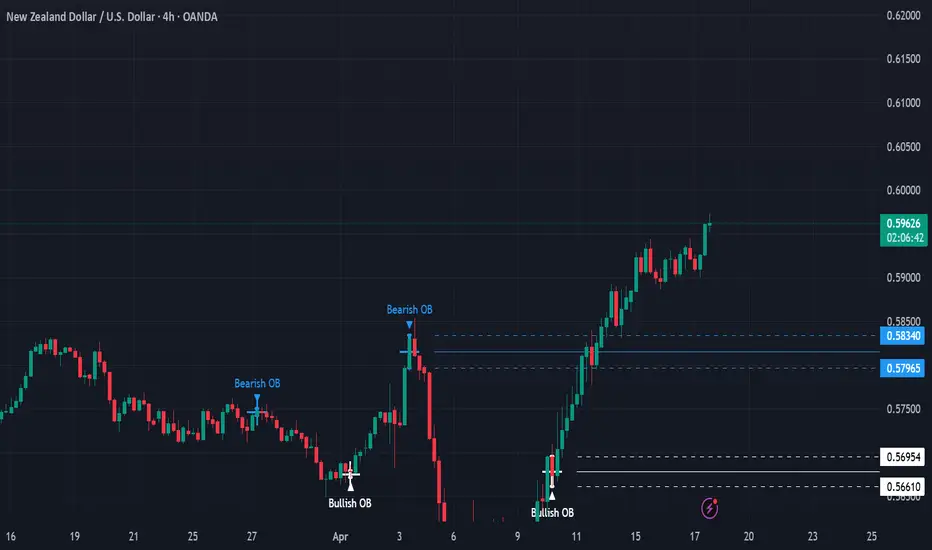
NZDUSD 4 HR ChartThis is the 4 HR Chart of NZDUSD, I am publishing this chart for further informational analysis. Ideally, further analysis will use smart money concepts, ICT, and wick candle analysis.
Update idea
Add note
NZDUSD 1 HR ChartThis is the 1 HR Chart of NZDUSD, I am publishing this chart for further informational analysis. Ideally, further analysis will use smart money concepts, ICT, and wick candle analysis.

NZDUSD 15 M ChartThis is the 15 M Chart of NZDUSD, I am publishing this chart for further informational analysis. Ideally, further analysis will use smart money concepts, ICT, and wick candle analysis.

TRADING PLAN: USDJPY SHORT TRADE SETUP Considering the bearish sentiment in UJ today, and the successful liquidity grab at the Asian session high, we'll take a short position. Our initial target is a 1:1 risk-reward ratio, followed by a 1:2 ratio after securing some profits.

USDCAD 1D ChartThis is the 1 D chart of usdcad, I am publishing this chart for further informational analysis. Ideally, further analysis will use smart money concepts, ICT, and wick candle analysis.

USDCAD 4HR ChartThis is the 4 hr chart of usdcad, I am publishing this chart for further informational analysis. Ideally, further analysis will use smart money concepts, ICT, and wick candle analysis.

USDJPY (1h) sell updateEarlier this week we had this USDJPY sell setup where price perfectly pulled back into our entry price and even though it's been ranging the trade is now running in profit so if you did take this trade move the stop-loss to break-even (to the entry level) & watch it play out till it hits take profit or you can manually close the trade in profit.

EUR/AUD "Euro vs Aussie" Forex Bank Heist Plan (Swing/Day)🌟Hi! Hola! Ola! Bonjour! Hallo! Marhaba!🌟
Dear Money Makers & Robbers, 🤑💰✈️
Based on 🔥Thief Trading style technical and fundamental analysis🔥, here is our master plan to heist the EUR/AUD "Euro vs Aussie" Forex Market. Please adhere to the strategy I've outlined in the chart, which emphasizes short entry. Our aim is the high-risk Pink MA Zone. Risky level, oversold market, consolidation, trend reversal, trap at the level where traders and bullish robbers are stronger. 🏆💸"Take profit and treat yourself, traders. You deserve it!💪🏆🎉
Entry 📈 : "The vault is wide open! Swipe the Bearish loot at any price - the heist is on!
however I advise to Place sell limit orders within a 15 or 30 minute timeframe most recent or swing, low or high level for Pullback entries.
Stop Loss 🛑:
📌Thief SL placed at the nearest/swing High or Low level Using the 4H timeframe (1.81000) Day/Swing trade basis.
📌SL is based on your risk of the trade, lot size and how many multiple orders you have to take.
Target 🎯: 1.74500 (or) Escape Before the Target
💰💵💴💸EUR/AUD "Euro vs Aussie" Forex Market Heist Plan (Day / Swing Trade) is currently experiencing a Bearish trend.., driven by several key factors.👇👇👇
📰🗞️Get & Read the Fundamental, Macro, COT Report, Quantitative Analysis, Sentimental Outlook, Intermarket Analysis, Future trend targets... go ahead to check 👉👉👉🔗🔗
⚠️Trading Alert : News Releases and Position Management 📰 🗞️ 🚫🚏
As a reminder, news releases can have a significant impact on market prices and volatility. To minimize potential losses and protect your running positions,
we recommend the following:
Avoid taking new trades during news releases
Use trailing stop-loss orders to protect your running positions and lock in profits
💖Supporting our robbery plan 💥Hit the Boost Button💥 will enable us to effortlessly make and steal money 💰💵. Boost the strength of our robbery team. Every day in this market make money with ease by using the Thief Trading Style.🏆💪🤝❤️🎉🚀
I'll see you soon with another heist plan, so stay tuned 🤑🐱👤🤗🤩

Custom Indicator in Action - EUR/USD 1H Setup’ve taken a trade on EUR/USD based on a signal from my custom indicator (designed and fine-tuned by yours truly). The setup is built on the 1-hour timeframe with a 1:1 risk-to-reward ratio.
The trade aligns with a short-term support level and is in confluence with the recent movement of the DXY (Dollar Index), which adds extra weight to the idea. No higher timeframes were involved in this entry — it's a clean 1H play based on structure and indicator confirmation.
Let’s see how it plays out. I'll keep you updated!

Is GBPAUD Finally Ready to Drop?Price is currently struggling to break through a key resistance area. That’s not a problem – I’m not looking to catch the entire move, I only need a clean 1:3 RR and potentially the completion of the Asia range.
🔻 Bias: Bearish
On the 4H chart, I’ve identified the 50 EMA as a possible point of rejection, and it lines up perfectly with a 15m POI (Orderblock).
Since the Asia session opened higher, this creates a solid intraday short opportunity targeting the unfilled Asian range.
✅ I’ve marked two potential zones where price could react. If I get clean bearish price action in either zone – such as a BOS on the 1m or strong rejection patterns – I’ll look to execute the short.
Patience until the setup aligns. Let's see how it plays out. 🔍💯

GBPAUDselling gbpaud
sl 2.08668
tp 2.07465
1% risk on each trade
short on GBP/AUD
note: risk 1% on every trade.
if you like to talk to me about anything my private chat is open

AUDUSD 30M CHART PATTERNThis chart is for the AUD/USD currency pair on a 30-minute timeframe. It appears to be a double top pattern, which is typically a bearish reversal pattern. Here's a breakdown of the strategy implied in the chart:
Key Elements:
Double Top (Red Arrows): Indicates a strong resistance zone around the 0.6389 area.
Neckline (Blue Horizontal Line): Around 0.637

Daily Price Action: AUDCAD Thursday 4/17/2025In this video, we will be looking into the potential price action of AUDCAD.
