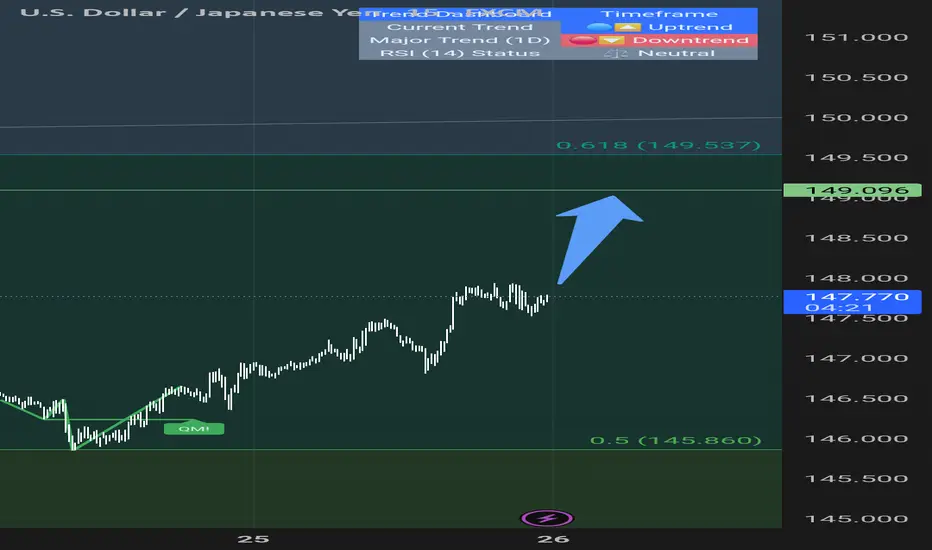
USD JPY shortthe sl is a bit short and narrow but yet lets see the rr is very good 1 to 3 lets see
Please note: This is for educational purposes only and not a trading signal. These ideas are shared purely for back testing and to exchange views. The goal is to inspire ideas and encourage discussion. If you notice anything wrong, feel free to share your thoughts. In the end, to learn is to share !
Forex market

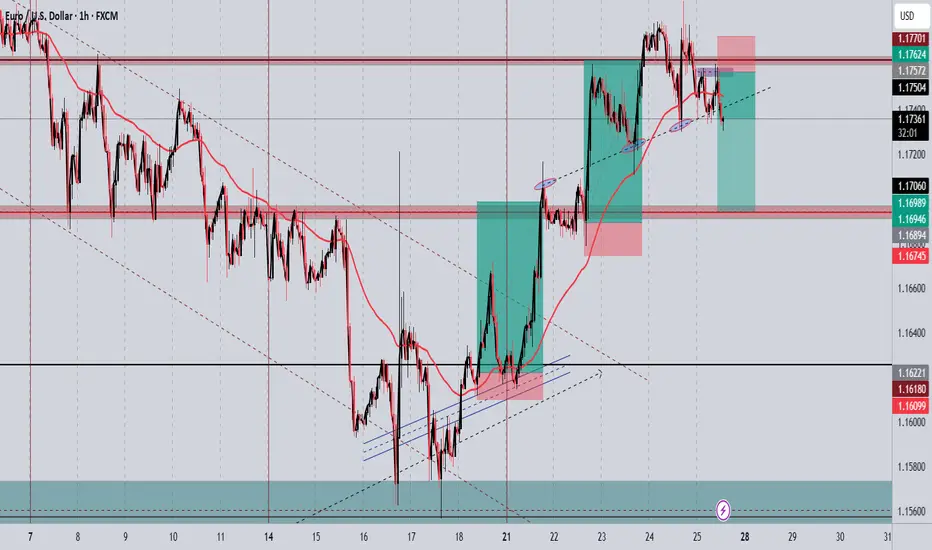
EUR/USD Short Setup – Bearish Reversal OpportunityPrice has rejected near resistance, forming lower highs.
Potential bearish divergence on momentum indicators (RSI/MACD).
Market sentiment suggests euro strength may be cooling after recent ECB hold.
Dollar shows signs of stabilization, adding downward pressure to the pair.
🔹 Trade Details:
Entry: 1.17572
Take Profit: 1.16946
GBPJPY Is Very Bearish! Sell!
Please, check our technical outlook for GBPJPY.
Time Frame: 7h
Current Trend: Bearish
Sentiment: Overbought (based on 7-period RSI)
Forecast: Bearish
The market is trading around a solid horizontal structure 199.004.
The above observations make me that the market will inevitably achieve 198.074 level.
P.S
Please, note that an oversold/overbought condition can last for a long time, and therefore being oversold/overbought doesn't mean a price rally will come soon, or at all.
Disclosure: I am part of Trade Nation's Influencer program and receive a monthly fee for using their TradingView charts in my analysis.
Like and subscribe and comment my ideas if you enjoy them!

BUY USDJPYThe price drop on UJ has been wild however price is at a good support zone, we see the ABCD pattern by way of a bullish Fibonacci invasion setup hoping it will give good liquidity. Buy wisely.

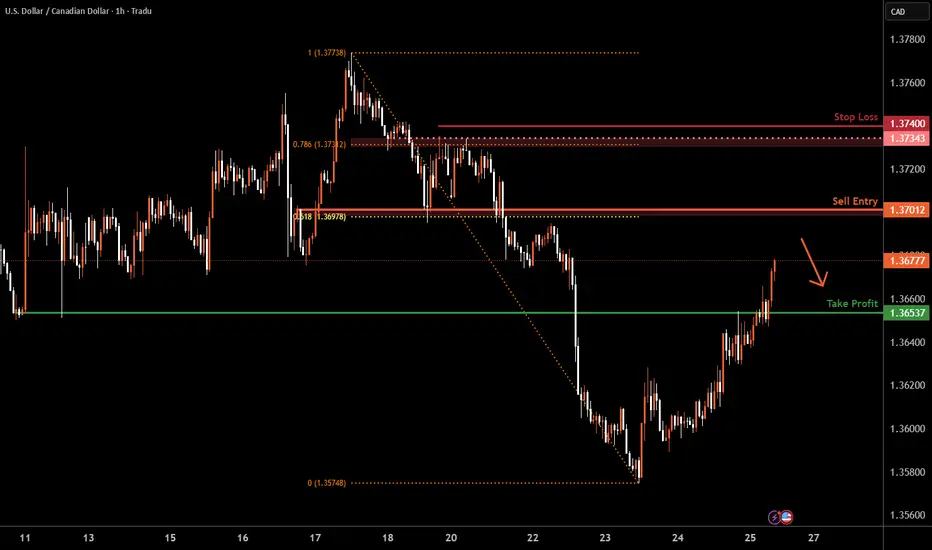
USD/CAD H4 | Potential bearish reversalUSD/CAD is rising towards an overlap resistance and could potentially reverse off this level to drop lower.
Sell entry is at 1.3701 which is an overlap resistance that aligns with the 61.8% Fibonacci retracement.
Stop loss is at 1.3740 which is a level that sits above the 78.6% Fibonacci retracement and an overlap resistance.
Take profit is at 1.3653 which is a pullback support.
High Risk Investment Warning
Trading Forex/CFDs on margin carries a high level of risk and may not be suitable for all investors. Leverage can work against you.
Stratos Markets Limited (tradu.com ):
CFDs are complex instruments and come with a high risk of losing money rapidly due to leverage. 66% of retail investor accounts lose money when trading CFDs with this provider. You should consider whether you understand how CFDs work and whether you can afford to take the high risk of losing your money.
Stratos Europe Ltd (tradu.com ):
CFDs are complex instruments and come with a high risk of losing money rapidly due to leverage. 66% of retail investor accounts lose money when trading CFDs with this provider. You should consider whether you understand how CFDs work and whether you can afford to take the high risk of losing your money.
Stratos Global LLC (tradu.com ):
Losses can exceed deposits.
Please be advised that the information presented on TradingView is provided to Tradu (‘Company’, ‘we’) by a third-party provider (‘TFA Global Pte Ltd’). Please be reminded that you are solely responsible for the trading decisions on your account. There is a very high degree of risk involved in trading. Any information and/or content is intended entirely for research, educational and informational purposes only and does not constitute investment or consultation advice or investment strategy. The information is not tailored to the investment needs of any specific person and therefore does not involve a consideration of any of the investment objectives, financial situation or needs of any viewer that may receive it. Kindly also note that past performance is not a reliable indicator of future results. Actual results may differ materially from those anticipated in forward-looking or past performance statements. We assume no liability as to the accuracy or completeness of any of the information and/or content provided herein and the Company cannot be held responsible for any omission, mistake nor for any loss or damage including without limitation to any loss of profit which may arise from reliance on any information supplied by TFA Global Pte Ltd.
The speaker(s) is neither an employee, agent nor representative of Tradu and is therefore acting independently. The opinions given are their own, constitute general market commentary, and do not constitute the opinion or advice of Tradu or any form of personal or investment advice. Tradu neither endorses nor guarantees offerings of third-party speakers, nor is Tradu responsible for the content, veracity or opinions of third-party speakers, presenters or participants.
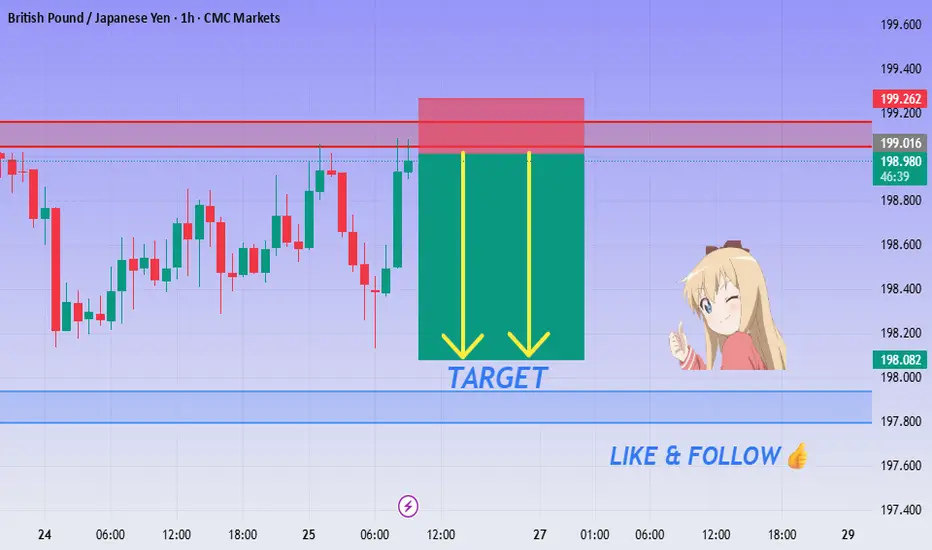
GBP/JPY Breakdown Alert - Bears Taking Control!💙 GBP/JPY Resistance Rejection ! SELL Setup Activated!
👩💻 Dear traders,
After analyzing GBP/JPY on the 1H timeframe, we have a clean short opportunity developing from a key resistance zone around 199.00 – 199.26. Price has stalled and rejected strongly, signaling potential for a bearish move.
Bias – Bearish
🎯 Target – 198.20
🎯 Target – 197.90
🎯 Final Target – 197.70
🛑 Safe Stop Loss – 199.26
📊 Reasoning:
– Price rejected a clear resistance/supply zone
– Red box marks historical rejection area
– Yellow arrows indicate downside momentum zone
– Bearish pressure forming at the top of the range
– Excellent intraday short with clean R:R structure
🍀 Stay patient, trust your levels, and trade smart!
I'm optymist. 1.183-1.185 In front us3 year channel saying that we should to touch it.
Yellow line.
Before us
In my opinion before us is level. 1.18-1.20 before bigger correction until 1.12 even.
Then in few month i see 1.4-1.6

CHECK EURJPY SIGNAL UPDATE GO AND READ CAPTAINEntry Point: Around 173.350 TO 173.200
Take Profit 1: 172.600
Take Profit 2: 171.900
Last Target: 171.200
Stop Loss: 173.900

GBPCAD: Growth & Bullish Continuation
The price of GBPCAD will most likely increase soon enough, due to the demand beginning to exceed supply which we can see by looking at the chart of the pair.
Disclosure: I am part of Trade Nation's Influencer program and receive a monthly fee for using their TradingView charts in my analysis.
❤️ Please, support our work with like & comment! ❤️

EURGBP: Bearish Forecast & Outlook
The charts are full of distraction, disturbance and are a graveyard of fear and greed which shall not cloud our judgement on the current state of affairs in the EURGBP pair price action which suggests a high likelihood of a coming move down.
Disclosure: I am part of Trade Nation's Influencer program and receive a monthly fee for using their TradingView charts in my analysis.
❤️ Please, support our work with like & comment! ❤️

Bull Trap Confirmed: GBPUSD's 8% Rally Faces ExhaustionLets Face it we had a great 6 months already clocking 60%+ Returns already.
And after sitting ducks for almost 2 months now we finally have a trade.
- Its a very self explanatory chart
- Trading at resistance
- Head & Shoulder pattern
And the best part the right shoulder is still yet to be formed! My favourite type of entry.
1.It gives a better risk reward ratio (1:7 expected)
2.Better Entry (No long red candles)
3. And even if the pattern fails it we may still reach the neck line which is target 1.
Entry Criteria
- A Red candle at the entry Line Marked
- Stoploss Above the Entry Candle
Target 1- 1.3361
Target 2- 1.3252
Target 3- 1.3169
Keep Your Risk Reward Intact! Not An investment Advice

GBPUSD Q3 | D25 | W30 | Y25 FUN COUPON FRIDAYGBPUSD Q3 | D25 | W30 | Y25
Daily Forecast🔍📅
Here’s a short diagnosis of the current chart setup 🧠📈
Higher time frame order blocks have been identified — these are our patient points of interest 🎯🧭.
It’s crucial to wait for a confirmed break of structure 🧱✅ before forming a directional bias.
This keeps us disciplined and aligned with what price action is truly telling us.
📈 Risk Management Protocols
🔑 Core principles:
Max 1% risk per trade
Only execute at pre-identified levels
Use alerts, not emotion
Stick to your RR plan — minimum 1:2
🧠 You’re not paid for how many trades you take, you’re paid for how well you manage risk.
🧠 Weekly FRGNT Insight
"Trade what the market gives, not what your ego wants."
Stay mechanical. Stay focused. Let the probabilities work.
FRGNT
FX:GBPUSD

NZD/USD – 1H | Bearish Setup at Breakout of LL| AB=CD HarmonicsWe’re currently eyeing a bearish continuation on NZD/USD based on clear market structure and harmonic confirmation.
📉 Trend: Bearish
🔍 Divergence: Bearish
📐 Harmonics: AB=CD pattern
📊 Bias: Bearish
🧠 Technical Breakdown
✅ Price has broken the previous Higher Low , confirming a structural shift.
✅ A Lower High is about to form — Now we’re waiting for the breakout of the previous Lower Low to confirm trend continuation.
✅ We’ve placed a Sell Stop below that Lower L ow, targeting bearish continuation.
✅ The AB=CD harmonic pattern shows potential for extended downside — reversal zone still far.
📌 Trade Setup
🔹 Entry: Sell Stop @ 0.59965 (breakout of Lower Low)
🔹 Stop Loss: 0.60614
🔹 Take Profit: 0.59316
🔹 Risk/Reward: 1:1
🔹 Lot Size: 0.38
🔹 Risk: $200
🔹 Reward: $200
⚠️ Note: This is a pending setup. Trade only triggers on the breakout of the previous Lower Low, keeping the bearish structure intact.
#NZDUSD #ForexSetup #BearishBreakout #LowerLow #PriceAction #SmartMoney #ABCDPattern
#HarmonicTrading #ForexStrategy #SellSetup #TradingView #FXMarket #ForexSignals
#DayTrading #SwingTrading #ChartAnalysis #TradeSmart #ForexTrader #RiskManagement
#ForexEducation #BearishStructure #FibonacciTrading #MarketStructure #BreakoutTrade
#TradersOfInstagram #TradersOfTradingView #CryptoAndForex

CHECK USDJPY SIGNAL UPDATE GO AND READ THE CAPTAINEntry Point: Around 147.750 TO 147.650
Take Profit 1: 147.200
Take Profit 2: 146.650
Last Target: 146.050
Stop Loss: 148.250

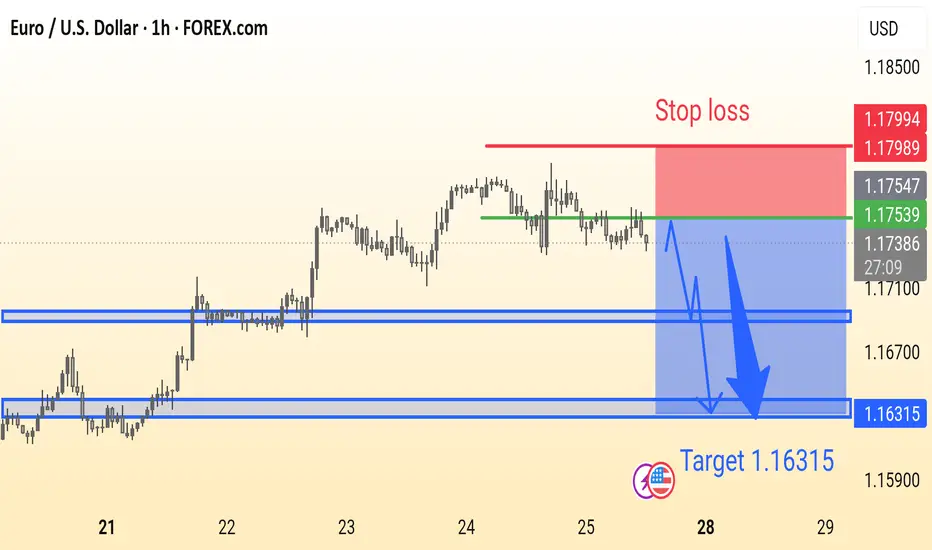
EURUSD Analysis is ReadyEUR/USD Trade Idea (1H Chart):
Price is ranging below resistance with a potential bearish breakout. Suggested Sell near 1.1753 with Stop Loss at 1.1799 and Target at 1.16315. Strong support zones marked for possible reaction.
NZDUSD: Free Trading Signal
NZDUSD
- Classic bullish setup
- Our team expects bullish continuation
SUGGESTED TRADE:
Swing Trade
Long NZDUSD
Entry Point - 0.6013
Stop Loss - 0.6004
Take Profit - 0.6028
Our Risk - 1%
Start protection of your profits from lower levels
Disclosure: I am part of Trade Nation's Influencer program and receive a monthly fee for using their TradingView charts in my analysis.
❤️ Please, support our work with like & comment! ❤️

potential here with a bearish moveThis is a continuation pattern to the downside that we are watching for a good short entry on. It could still push up to around 201.125 ish area, so no move yet, just on the radar.

Confirmed Breakout SetupThe 1-hour candle **closed cleanly and strongly** above the 147.050 resistance zone. No upper wick rejection, no weakness


EURGBP 2nd Buy EntryEntry: 0.86533
Stop Loss (R): 0.86379
Take Profit (4R): 0.87149
*Disclaimer: I will not accept liability for any loss or damage, including without limitation to any loss of profit, which may arise directly or indirectly from use of or reliance on such information.

AUDCAD SHORTMarket structure bearish on HTFs DW
Entry at both Weekly and Daily AOi
Weekly Rejection at AOi
Weekly Previous Structure Point
Weekly Rejection at AOi
Daily Rejection at AOi
Daily Previous Structure Point
Around Psychological Level 0.89500
H4 EMA retest
H4 Candlestick rejection
Levels 4.17
Entry 100%
REMEMBER : Trading is a Game Of Probability
: Manage Your Risk
: Be Patient
: Every Moment Is Unique
: Rinse, Wash, Repeat!
: Christ is King.

Eurgbp sellI'm just waiting now for confirmation candles but looks good too sell from this current mark , and I can see a take profits area at 0.8669 will probably pull a lot further down but I'm fine with that and on to the next little and often is my philosophy to trade let's not get greedy belly
