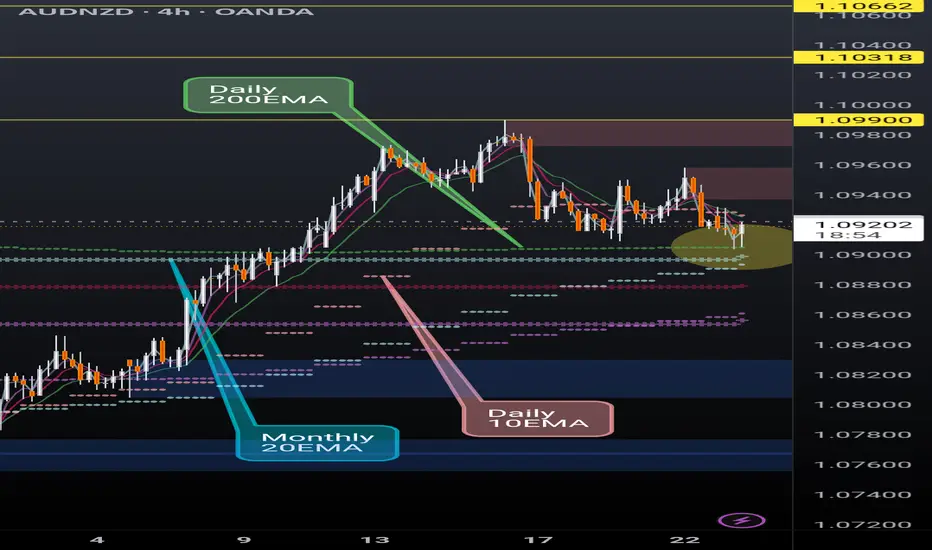
AUDNZD finding support on critical EMAsAUDNZD is finding support at the daily 200EMA (overlayed on 4H chart) and, more significantly, above the monthly 20EMA (overlayed). Break and hold the daily 10EMA (overlayed) will be key.
If the momentum continues we could see a continuation of the ongoing rally however recent AUD monetary policy meeting minutes seemed to lean dovish.
I'm a cat not a financial advisor.
Forex market
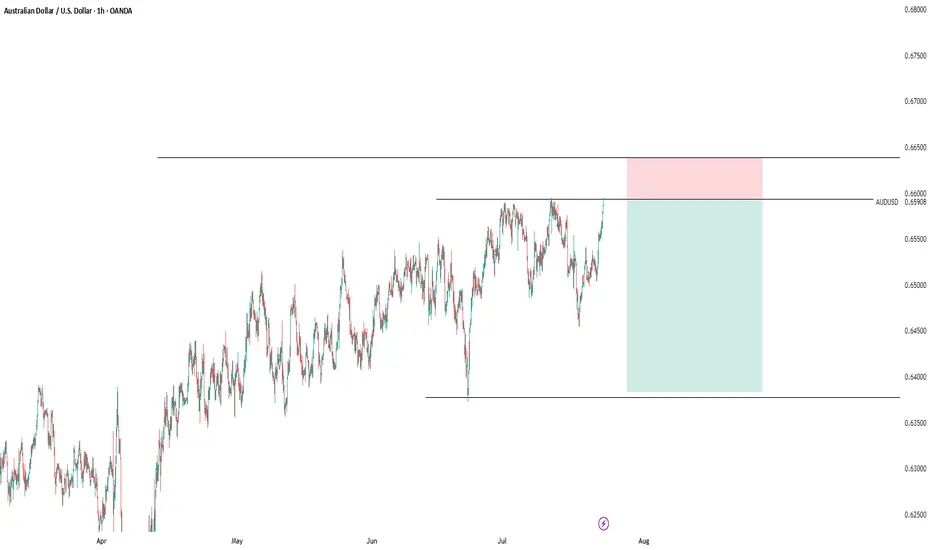
audusd sell signal. Don't forget about stop-loss.
Write in the comments all your questions and instruments analysis of which you want to see.
Friends, push the like button, write a comment, and share with your mates - that would be the best THANK YOU.
P.S. I personally will open entry if the price will show it according to my strategy.
Always make your analysis before a trade
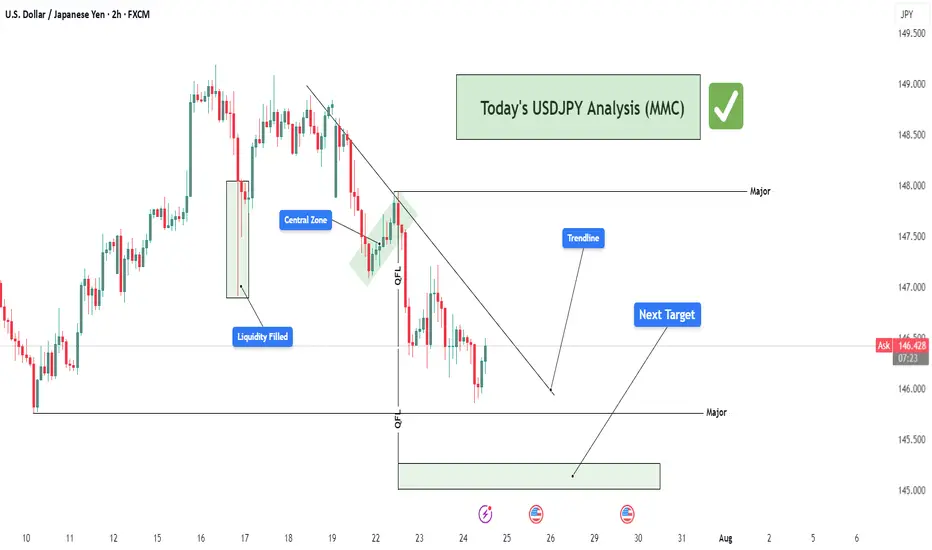
USDJPY Structure Analysis – Liquidity Filled, Rejection + Target🧠 Overview:
This 2-hour chart of USDJPY highlights a clear bearish structure following a smart money-driven move. The price action reflects market maker behavior, liquidity manipulation, trendline rejections, and strategic zone targeting. Let's break down the key elements for today’s USDJPY analysis.
🔍 Key Technical Breakdown:
1. 🏦 Liquidity Grab & Fill (July 17th)
The marked green zone shows an aggressive liquidity sweep where the price dipped sharply into a previous demand zone, triggering stop losses and collecting institutional orders.
This movement represents a classic "liquidity fill", often engineered by market makers to trap retail buyers/sellers.
After sweeping liquidity, price quickly reversed upwards — a signal that large buy orders were triggered and filled.
2. 🎯 Central Zone as a Distribution Region
The market retraced to the "Central Zone", highlighted on the chart, which acted as a distribution area:
Price consolidated and created indecision before rejecting sharply again.
This zone reflects a short-term supply where institutional players may have offloaded positions.
Key clue: This consolidation occurred below the major trendline, increasing its strength as resistance.
3. 🔻 QFL Zones (Quasimodo Failure Levels)
Two QFL levels are marked, which denote structure breaks and retracements in MMC/SMC strategy:
First QFL marks a major support break – a signal of shifting market sentiment from bullish to bearish.
Second QFL confirms continued lower lows formation – solidifying bearish market structure.
These levels are critical in identifying market intent and anticipating future moves.
4. 📉 Descending Trendline Rejection
The descending trendline drawn from recent highs is being respected continuously:
Price tested the trendline multiple times but failed to break above.
These rejections represent seller dominance and validate the trendline as a dynamic resistance.
A break above this line would invalidate the current bearish structure.
5. 🎯 Next Target – Major Demand Zone (145.00–145.20)
Price is heading toward a major demand zone marked in green around 145.000:
This area is a strong buy-side liquidity zone, where institutional buyers may show interest again.
If this zone is tapped, we may see either:
A bounce (bullish reaction), or
A breakdown and continuation lower if bearish momentum continues.
Traders should monitor this area closely for price action signals (engulfing candles, rejection wicks, or bullish divergence).
🧠 Strategic View:
Bias: Bearish, unless trendline breaks with strong volume.
Ideal Entry: Look for short entries on lower timeframe pullbacks into minor resistance (like trendline or last supply zone).
Target Area: 145.00 – ideal zone to book profits or switch bias.
Invalidation: A break and close above the descending trendline + central zone.
🔑 Confluences in This Analysis:
Concept Details
✅ Liquidity Grab Trap & Fill strategy at prior lows
✅ Central Zone Bearish distribution and rejection
✅ Trendline Repeated resistance rejections
✅ Structure Lower lows and QFL confirmations
✅ Target Area Clear next demand zone identified
⚠️ Risk Note:
As always, wait for confirmation before entering trades. The market may fake out near zones. Use proper risk management (1-2% risk per trade) and adjust your strategy as new candles form.
📌 Conclusion:
This chart paints a textbook scenario of how institutional movements and structure-based analysis (MMC/SMC) can offer high-probability setups. We expect further downside toward the 145.00 region before any significant reversal. Keep an eye on reaction from this demand zone for the next play.
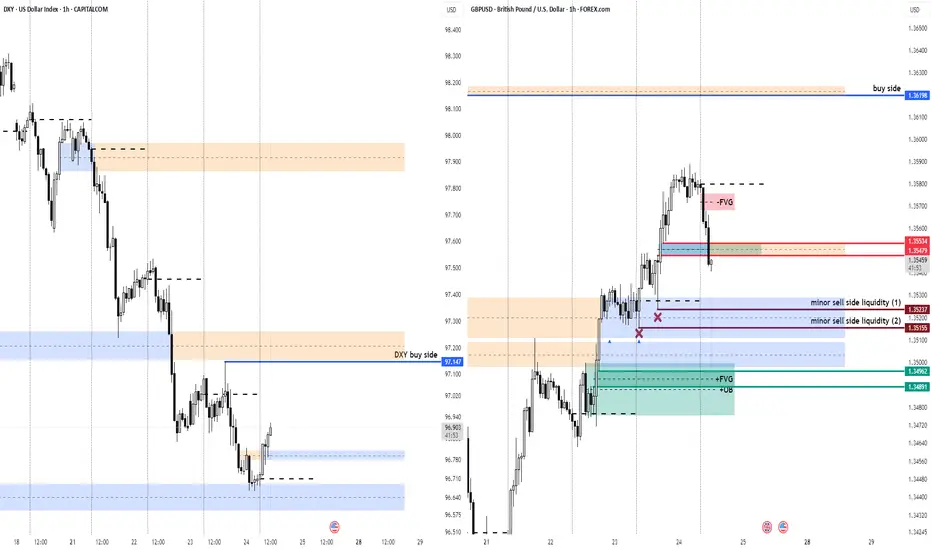
GBPUSD (Cable) – Retracement Potential as DXY ReboundsThe Dollar Index (DXY) is currently climbing out of an old inversion FVG, suggesting strength may continue short-term. This aligns with a likely retracement scenario for Cable, which has just traded into a bearish FVG and is beginning to pull back.
⚠️ I'm watching the minor sell-side liquidity zones at 1.3523 and 1.3515 for potential reaction points or even inducement setups. If price dips deeper, the 1.3496 FVG + OB zone may offer rebuy opportunities, depending on structure and displacement.
💡 Scalpers might find short-term setups on the retrace, but caution is warranted — narrative can flip quickly as we approach deeper liquidity zones.
If DXY continues higher toward the 97.147 buy-side, expect pressure on GBPUSD until that draw is satisfied.
USD/JPY: A Bullish Thesis for Trend ContinuationThis analysis outlines a data-driven, bullish thesis for USD/JPY, identifying a strategic long entry within an established market trend. The setup is supported by a combination of fundamental catalysts and a clear technical structure.
📰 The Fundamental Picture
The primary driver for this trade will be the high-impact US economic data scheduled for release. This release is expected to inject significant volatility into the market. Fundamentally, this trade is a play on the deep policy differences between the US Federal Reserve and the Bank of Japan. While the Fed's future steps are a topic of debate, the Bank of Japan's policy remains one of the most accommodative in the world, creating a long-term headwind for the Japanese Yen. This dynamic provides a strong fundamental basis for relative US Dollar strength against the Yen.
📊 The Technical Structure
Chart analysis reveals that USD/JPY is in a confirmed and healthy uptrend. The current price action indicates a constructive pullback, presenting a strategic opportunity to join the dominant trend at a favorable price. The proposed entry point is positioned at a key technical level that offers a low-risk entry. Technical indicators support the continuation of the trend, suggesting that momentum remains with the bulls.
✅ The Trade Plan
This trade is structured with a clear and favorable risk-to-reward profile, aiming to capitalize on the established trend.
👉 Entry: 146.343
⛔️ Stop Loss: 145.233
🎯 Take Profit: 148.560
⚖️ Risk/Reward Ratio: 1:2

Lingrid | EURUSD Potential Surge Following Channel BreakoutFX:EURUSD is consolidating after bouncing from a key confluence of support around 1.16000 and forming a higher low within the upward channel. The recent corrective pullback through a downward channel now appears complete, with bullish structure resuming. Price is likely to advance toward the 1.18300 resistance as long as the 1.15900 zone holds. Momentum favors a continuation of the A-B-C and trend continuation sequences already established.
📉 Key Levels
Buy trigger: Break above 1.16500
Buy zone: 1.16000–1.16250
Target: 1.18300
Invalidation: Close below 1.14500
💡 Risks
Failure to break the corrective channel resistance
Bearish divergence on lower timeframes
Broader USD strength reversal
If this idea resonates with you or you have your own opinion, traders, hit the comments. I’m excited to read your thoughts!

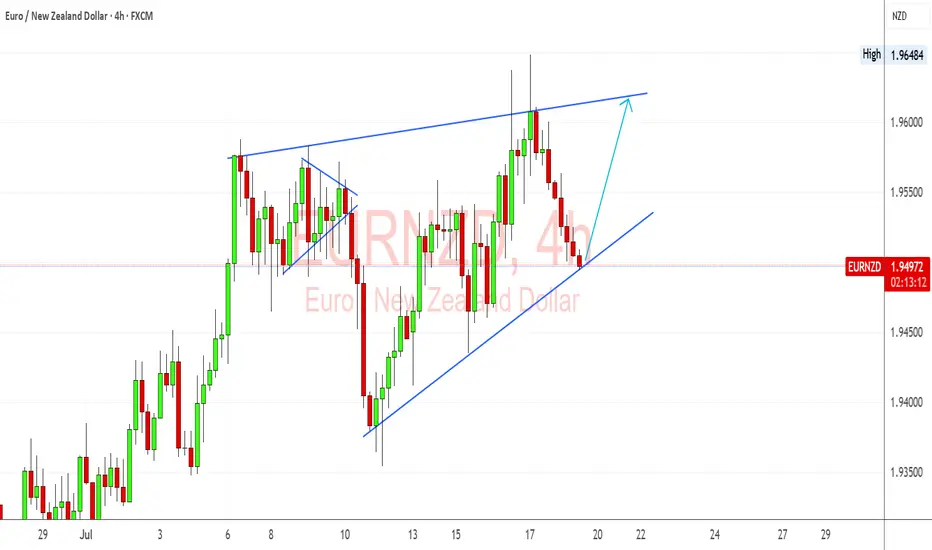
EURNZD Trendline & Hawkish ECB Bias Support Bullish ContinuationEURNZD is holding beautifully above the ascending trendline on the 4H, and I’m watching this level closely for a bounce continuation setup. Fundamentally, the euro remains supported by sticky inflation and hawkish ECB commentary, while the kiwi is showing softness after dovish signals from the RBNZ and mixed jobs data. If this trendline holds, I’ll be targeting a retest of the upper wedge resistance near 1.9640.
🔍 Technical Setup (4H):
Structure: Ascending triangle forming – price is pressing into dynamic support.
Support Zone: Around 1.9480 trendline area – price rejected this level several times in July.
Resistance Target: 1.9640 highs – double top and triangle resistance.
Bullish Confirmation: Rebound with bullish engulfing or strong 4H close above 1.9525 could trigger long setup.
Invalidation: Clean break below trendline and 1.9440 invalidates bullish scenario short-term.
💡 Fundamental Insight:
EUR Drivers:
ECB members remain cautious about declaring victory on inflation.
German and Eurozone CPI data remain above target, supporting higher-for-longer ECB stance.
Speculation that ECB won't cut aggressively compared to RBNZ.
NZD Weakness:
RBNZ minutes show concern over downside inflation risks.
Labor market cooling, and migration pressures remain high.
Commodity and China-linked sentiment weakening NZD.
⚠️ Key Risks:
If Eurozone inflation or PMI data surprises to the downside, EUR may weaken.
RBNZ hawkish pivot or surprise tightening would flip sentiment toward NZD.
Global risk-on could favor NZD as a high-beta currency.
🧭 Summary:
I’m bullish on EURNZD as long as price holds above the trendline near 1.9480. The technical structure shows a clean ascending pattern, and the fundamentals currently favor EUR strength over NZD. My eyes are on a potential move toward 1.9640, especially if upcoming ECB rhetoric stays hawkish. EURNZD tends to lead NZD-crosses like NZDJPY or NZDCHF in risk-off regimes and could signal euro strength if it breaks out. Watching closely for price action confirmation.
EURUSD BUY SETUPFOLLOW THE PRICE WILL GO UP
BECAUSE WE HAVE PATTERN ON 5 M
WE have strong candle on frame 4h

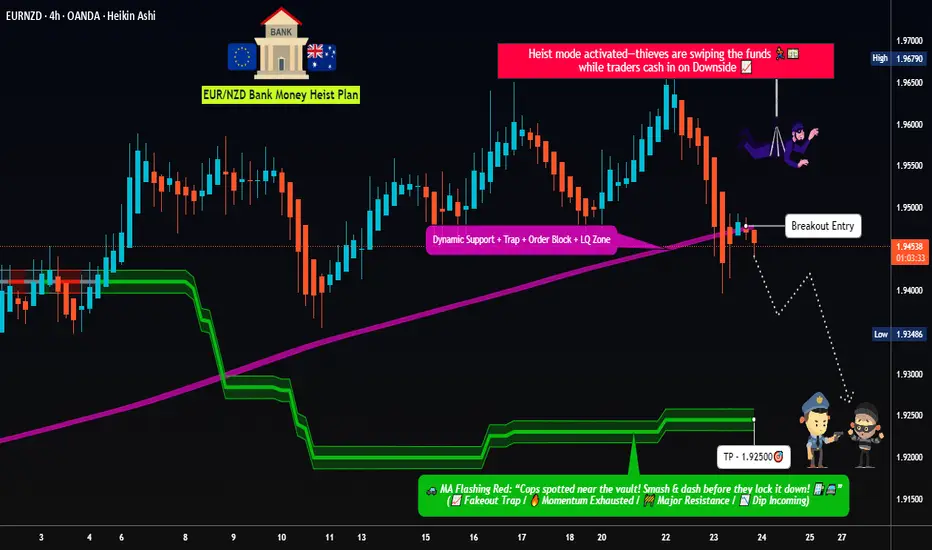
Dynamic Entry Alert – EUR/NZD Bearish Heist Execution!💣 EUR/NZD Robbery Blueprint: The Kiwi Vault Bearish Heist Plan 💰🕵️♂️
🌟Hi! Hola! Ola! Bonjour! Hallo! Marhaba!🌟
Dear Money Makers & Robbers, 🤑💰✈️
This ain't your usual trading tip — it’s a Thief Trading Masterstroke 🎯. We're gearing up for a high-stakes heist on the EUR/NZD forex market. Time to crack open the Kiwi vault and rob those bullish bandits blind! 😼💣
🧠 Strategic Mindset:
🔍 We're targeting the oversold consolidation zone. Bullish traders think they’re safe? Think again. This area is a trap — the perfect bait for our bearish ambush. Expect trend reversal vibes, layered with juicy liquidity grabs.
🕵️♂️ Entry Plan:
🎯 Sell Entry Trigger: Wait for a clean break below 1.94500.
💣 Setup:
Place Sell Stop Orders below the MA Support Breakout
Or... go stealth: Sell Limit Orders at nearest swing highs (15m or 30m timeframe)
Use DCA / Layering Method for multiple entries (scalp or swing tactics)
📌 Set your Alert 🚨 — no breakout, no entry. Patience pays.
🛑 Stop Loss Strategy (SL):
No premature moves! Don’t place that SL till we get the confirmed break.
🔥 SL Recommendation:
Just above 1.95700 (4H candle wick swing high)
Adjust based on lot size and number of layers
📍 Remember, the market’s a jungle — stay sharp or get sliced.
🎯 Take Profit (TP):
💵 Target Zone: 1.92500
(But hey, escape early if the vault starts shaking. Protect your gains like a pro.)
📊 Macro Intel – Why This Works:
This isn’t random — it's backed by our 🔥 combo of:
COT Reports
Sentiment Analysis
Quant/Algo Bias
Intermarket Correlation
Fundamental + Technical Confirmation
📌 You can dig deeper — but trust me, this setup’s been scouted like a pro job.
⚠️ Risk Protocols:
Avoid entries during high-impact news
Use Trailing SLs to lock in the loot
Adjust position size to suit your personal bankroll & risk appetite
🔥 Final Word from the Thief:
Smash that 💥Boost Button💥 if you're vibing with the heist plan!
Support the squad, stay profitable, and rob the market — legally, of course.
We don’t trade, we infiltrate.
We don’t predict, we execute.
📡 Stay tuned… More robbery blueprints coming soon!
🤑🐱👤🚨💸💪 #ThiefTrader #ForexHeist #EURNZDShortPlan
Bullish bounce?EUR/JPY is falling towards the pivot and could bounce to the 1st resistance, which acts as a swing high resistance.
Pivot: 171.05
1st Support: 169.69
1st Resistance: 173.27
Risk Warning:
Trading Forex and CFDs carries a high level of risk to your capital and you should only trade with money you can afford to lose. Trading Forex and CFDs may not be suitable for all investors, so please ensure that you fully understand the risks involved and seek independent advice if necessary.
Disclaimer:
The above opinions given constitute general market commentary, and do not constitute the opinion or advice of IC Markets or any form of personal or investment advice.
Any opinions, news, research, analyses, prices, other information, or links to third-party sites contained on this website are provided on an "as-is" basis, are intended only to be informative, is not an advice nor a recommendation, nor research, or a record of our trading prices, or an offer of, or solicitation for a transaction in any financial instrument and thus should not be treated as such. The information provided does not involve any specific investment objectives, financial situation and needs of any specific person who may receive it. Please be aware, that past performance is not a reliable indicator of future performance and/or results. Past Performance or Forward-looking scenarios based upon the reasonable beliefs of the third-party provider are not a guarantee of future performance. Actual results may differ materially from those anticipated in forward-looking or past performance statements. IC Markets makes no representation or warranty and assumes no liability as to the accuracy or completeness of the information provided, nor any loss arising from any investment based on a recommendation, forecast or any information supplied by any third-party.

EURUSD: Next Move Is Down! Short!
My dear friends,
Today we will analyse EURUSD together☺️
The price is near a wide key level
and the pair is approaching a significant decision level of 1.17658 Therefore, a strong bearish reaction here could determine the next move down.We will watch for a confirmation candle, and then target the next key level of 1.17506..Recommend Stop-loss is beyond the current level.
❤️Sending you lots of Love and Hugs❤️

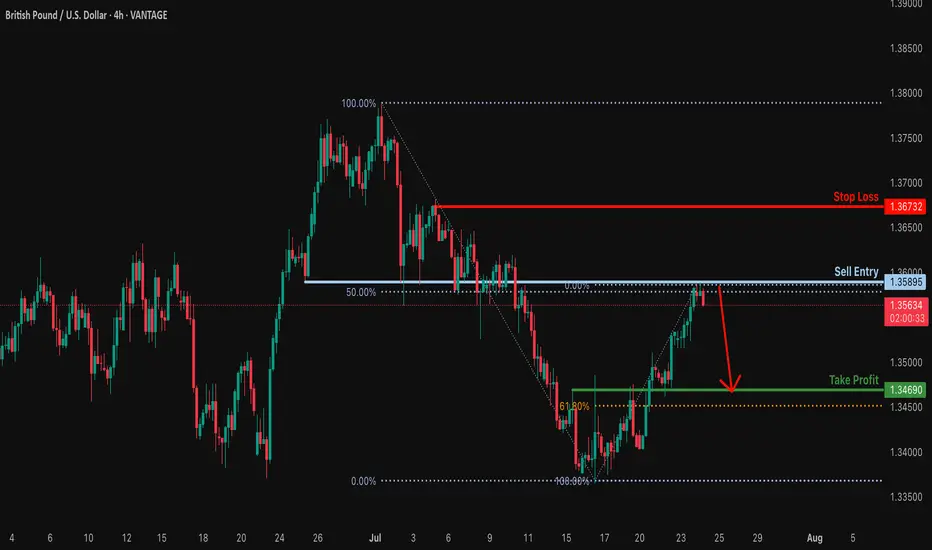
Bearish reversal off pullback resistance?The Cable (GBP/USD) is reacting off the resistance level, which is a pullback resistance that aligns with the 50% Fibonacci retracement and could drop from this level to our take profit.
Entry: 1.3589
Why we like it:
There is a pullback resistance that lines up with the 50% Fibonacci retracement.
Stop loss: 1.3673
Why we like it:
There is a swing high resistance.
Take profit: 1.3469
Why we like it:
There is an overlap support level that is slightly above the 61.8% Fibonacci retracement.
Enjoying your TradingView experience? Review us!
Please be advised that the information presented on TradingView is provided to Vantage (‘Vantage Global Limited’, ‘we’) by a third-party provider (‘Everest Fortune Group’). Please be reminded that you are solely responsible for the trading decisions on your account. There is a very high degree of risk involved in trading. Any information and/or content is intended entirely for research, educational and informational purposes only and does not constitute investment or consultation advice or investment strategy. The information is not tailored to the investment needs of any specific person and therefore does not involve a consideration of any of the investment objectives, financial situation or needs of any viewer that may receive it. Kindly also note that past performance is not a reliable indicator of future results. Actual results may differ materially from those anticipated in forward-looking or past performance statements. We assume no liability as to the accuracy or completeness of any of the information and/or content provided herein and the Company cannot be held responsible for any omission, mistake nor for any loss or damage including without limitation to any loss of profit which may arise from reliance on any information supplied by Everest Fortune Group.
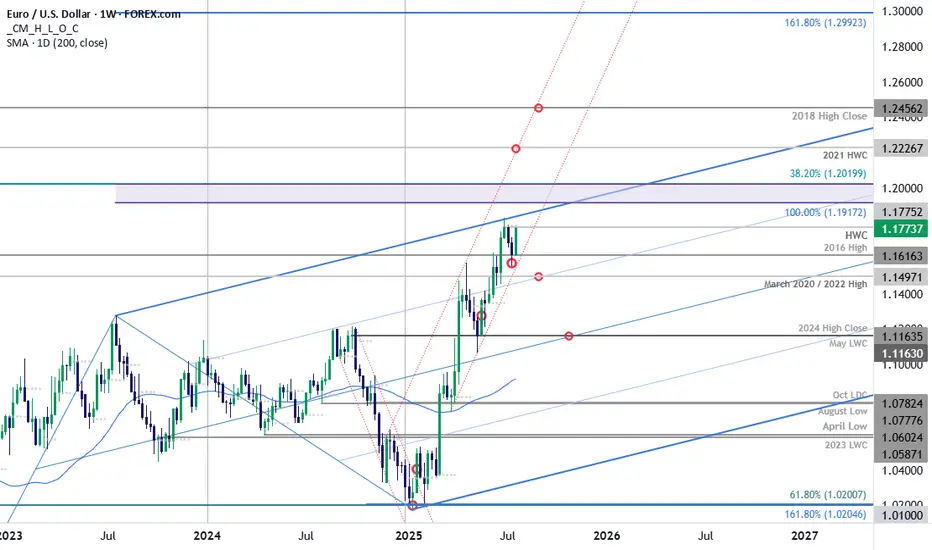
EUR/USD Surges into Resistance Ahead of ECBEuro is poised to snap a two-week losing streak with EUR/USD up more than 1.2% since the Sunday open. The advance takes price back into weekly resistance ahead of tomorrow’s European Central Bank rate decision and the focus now shifts to the weekly close for guidance.
Euro plunged more than 2.3% off the June high with price briefly registering an intraweek low at 1.1557 before rebounding. The rally takes EUR/USD into resistance at the objective high-week close (HWC) / high-close at 1.1775- looking for a reaction off this mark with a weekly close above needed to keep the immediate advance viable into the close of the month.
Initial weekly support remains with the 2016 swing high at 1.1616 with the medium-term outlook still constructive while above the March trendline (red). Ultimately, a break below the 2020 / 2022 highs at 1.1497 would be needed to suggest a more significant high is in place / a larger correction is underway with subsequent support seen at the 2024 high close / May low-week close (LWC) at 1.1164.
A breach / close above this pivot zone exposes the upper parallel (blue), currently near 1.1840s, with the next major technical consideration eyed at 1.1917-1.2020- a region defined by the 100% extension of the 2022 advance and the 38.2% retracement of the 2008 decline (area of interest for possible top-side exhaustion / price inflection IF reached). Subsequent resistance objectives eyed at the 2021 HWC at 1.2227 and the 2018 high-close at 1.2456.
Bottom line: Euro rebounded just ahead of the March uptrend with the rally now testing the yearly high-close ahead of the ECB- watch the Friday close with respect to 1.1775. From a trading standpoint, a good zone to reduce portions of long-exposure / raise protective stops- losses would need to be limited to this week’s low IF price is heading higher on this stretch with a close above the upper parallel still needed to fuel the next major leg of the advance.
-MB
GBPAUD Sellers In Panic! BUY!
My dear followers,
This is my opinion on the GBPAUD next move:
The asset is approaching an important pivot point 2.0491
Bias - Bullish
Technical Indicators: Supper Trend generates a clear long signal while Pivot Point HL is currently determining the overall Bullish trend of the market.
Goal - 2.0573
About Used Indicators:
For more efficient signals, super-trend is used in combination with other indicators like Pivot Points.
Disclosure: I am part of Trade Nation's Influencer program and receive a monthly fee for using their TradingView charts in my analysis.
———————————
WISH YOU ALL LUCK

USDJPY short position 24/07/2025English : According to our analysis, we anticipate a bearish scenario.
Morocan Darija : kanchofo d'apres l'analyse dyalna antsanaw hboot
ATENTION : I only share my ideas, not signals

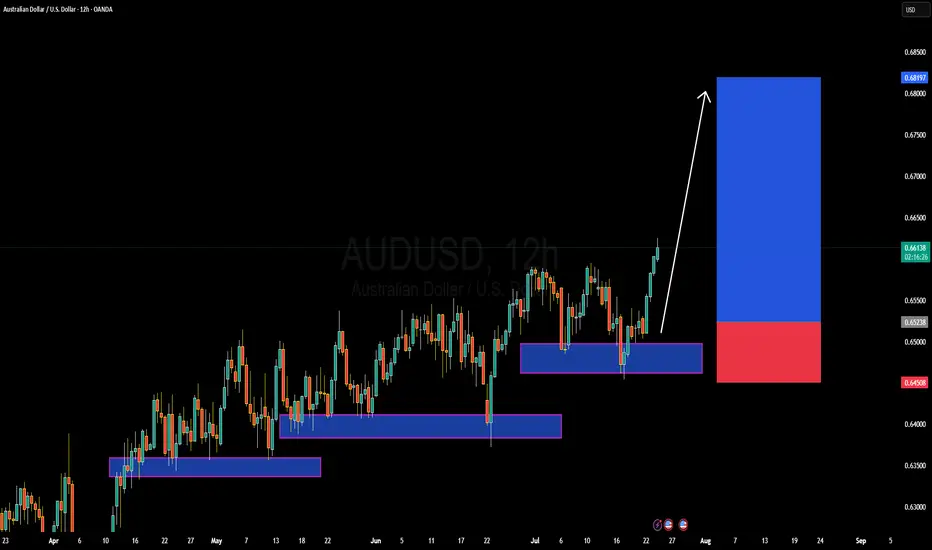
AUDUSD Forming Strong Bullish MomentumAUDUSD is currently showing strong bullish momentum, confirming a key breakout from recent consolidation. After multiple rejections at support zones, price action has now surged through previous resistance levels around 0.6600, signaling a bullish trend continuation. As seen on the 12H chart, the pair is respecting a series of higher lows and forming a clean ascending structure, with a fresh impulse wave now aiming toward the 0.6800–0.6820 target zone.
On the fundamental front, the Australian dollar is gaining strength as recent macro data supports a more optimistic economic outlook. Australia’s labor market remains tight, and inflation prints have come in hotter than expected, increasing speculation that the RBA may maintain a hawkish tone. Meanwhile, the US dollar is under pressure as markets continue to price in a potential Fed rate cut in the coming months, especially amid signs of slowing economic momentum and easing CPI. This divergence is helping AUDUSD push higher.
Technically, buyers are clearly in control. Each dip into demand zones has been aggressively bought, and the current price action confirms continuation. The recent break above 0.6600 is a significant technical development, and as long as price holds above the 0.6520–0.6500 support zone, I expect the pair to grind higher toward 0.6819 and beyond. Risk-reward remains favorable for buyers with a clear bullish structure intact.
With strong bullish confluence both fundamentally and technically, AUDUSD offers a high-probability long opportunity. I’ll be looking for continuation setups on lower timeframes while managing risk below key support. The trend is your friend here—stay with the bulls as the market positions ahead of upcoming US economic releases.
EURUSD ahead of the ECBYesterday, EURUSD continued its bullish movement, reaching 1,1780.
Today, the ECB will announce its decision on interest rates.
The news is scheduled for 1:15 PM, followed by a press conference 30 minutes later.
Expect possible sharp and misleading price movements — reduce your risk and avoid rushing into new positions!

EURUSD : Status @ 23/7Direction: Buy
Signal triggered: 23/7/2025
Stop when:
a) Stop Loss @ 1.1700 ; or if
b) Sell signal triggered
Action:
Buy the dip
Good luck.
P/S: Note that the Buyer finally won the battle. But it did so, fighting the Seller all the way to the top. Now, they are at 1.1790 resistance with a potential to reach the long-term D @ 1.1900/30. My preference is not to buy. Instead, wait for a SELL as it is a bit late now to buy.

GBP/JPY 4H - Rejection from Supply Zone and Key Fib AreaOverview:
GBP/JPY is trading near 197.91, and recent price action suggests a potential short opportunity. The pair has been rejected from a key Fibonacci resistance zone, and bearish momentum appears to be building beneath a fading ascending channel. Let’s break down why this chart leans more bearish.
Market Structure Breakdown:
* Price action failed to sustain new highs above 199.90 and is now forming lower highs, a potential early sign of trend exhaustion.
* The recent bounce from 197.40 was muted and rejected near the 0.5 and 0.618 retracement levels, indicating strong supply around the 198.68–198.98 zone.
Fibonacci Confluence:
* The rejection occurred right at the 0.618 retracement of the prior downswing — a key Fibonacci level often used by institutional traders to re-enter in the direction of the trend.
* Price is now hovering below the 0.382 (198.38) and 0.5 (198.68) levels, which may now act as resistance.
* If the current rejection holds, downside targets are:
* 0.0 (197.40) – recent low
* -0.27 extension (196.70) – potential bearish continuation target
* -0.618 extension (195.81) – extended downside objective
Trendline & Channel Considerations:
* The ascending channel is losing momentum.
Moving Averages:
* Price is now below the 50 EMA, and testing the 200 EMA, which is at risk of breaking.
* A clear close below both EMAs would confirm bearish momentum.
RSI & Momentum:
* The RSI shows bearish divergence on recent highs and is struggling to break above the midline (50).
* Momentum is tilting to the downside and failing to build higher on bounces.
Key Zones:
* Resistance Zone: 198.60–198.98
* Strong Fibonacci confluence + previous supply
* Support Zone: 197.40
* Prior swing low and 0.0 Fib level
* Bearish Continuation Zone: Below 197.30
* Breakout would confirm downside acceleration toward 196.70 and 195.80
Conclusion:
GBP/JPY is showing signs of bearish pressure beneath key resistance. With the rejection from the 0.618 Fib level and weakening channel structure, the path of least resistance may be to the downside — especially if price breaks and holds below 197.40.
A confirmed breakdown opens the door toward 196.70 and possibly 195.80, as bearish continuation unfolds. Overall we can even see price hitting past historical levels at 189.50

GBPUSD ENTRY CHARTOn this Pair, We are bullish, as the Dollar is still weak and the POUNDS DOLLAR is still in an UPTREND, on the HTF and the MID-TERM-TF, also on the Hourly, we got a Zone with additional confluences that are in align with the Trend, then on our Entry TF, We got a Sweep of LIQ, BOS and IND close to our POI, so we are IN, and if this matches with your TRADE IDEA, i advise you add a good risk management to manage your Trade, THANK YOU.

EURAUD: Bullish Forecast & Outlook
Our strategy, polished by years of trial and error has helped us identify what seems to be a great trading opportunity and we are here to share it with you as the time is ripe for us to buy EURAUD.
Disclosure: I am part of Trade Nation's Influencer program and receive a monthly fee for using their TradingView charts in my analysis.
❤️ Please, support our work with like & comment! ❤️

EURUSD NEW IDEASee the chart above, were on decling its momentum, I believe more trap longs this move.
SEE it in 2 days how things works. targets see charts.
I don't really explain to gain more tractions on how trading works.
I am here to understand the movement. Don't complicate too much, If you're a swing trader, take it a leap and have patience. stick to your own proper stoploss.
Trade it or leave it.
Goodluck folks.

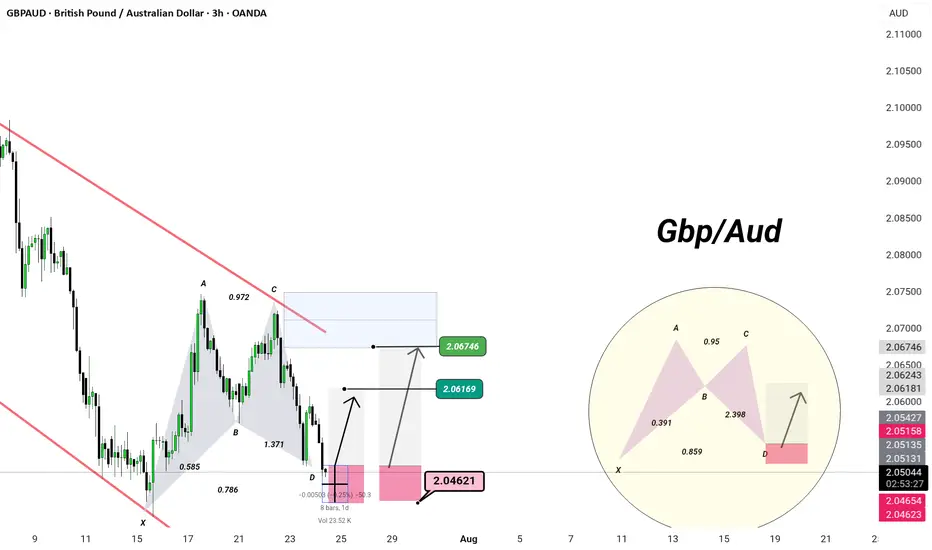
IGBPAUD | 3H Chart | Precision Setup –
🦋 Bullish Harmonic Activation – Deep Zone Precision
When elegance meets geometry — we trade like a Monaco man.
🔺 Pattern: Potential Bullish Bat/Alt Bat
XA → AB → BC → CD
Ideal D-point completion at 2.0462
88.6% XA retracement + 2.0+ BC extension = high-probability reaction zone
🛡️ Demand Zone:
Price is testing the PRZ (Potential Reversal Zone) at 2.0462
Reaction expected → projected targets:
🎯 TP1: 2.0616
🎯 TP2: 2.0674
⚙️ Entry Plan:
Long from 2.0462–2.0465
Invalidation below structure low
Maintain composure. Let the setup mature — precision > prediction
💡 Bias: Tactical long within channel, targeting liquidity above C
🎩