Forex market

EURUSD: Long Signal with Entry/SL/TP
EURUSD
- Classic bullish pattern
- Our team expects retracement
SUGGESTED TRADE:
Swing Trade
Buy EURUSD
Entry - 1.1724
Stop - 1.1714
Take - 1.1743
Our Risk - 1%
Start protection of your profits from lower levels
Disclosure: I am part of Trade Nation's Influencer program and receive a monthly fee for using their TradingView charts in my analysis.
❤️ Please, support our work with like & comment! ❤️

EURUSD OUTLOOK On EURUSD, the previous day closed bearish. I then identified the most recent and significant supply and demand zones. After that, I proceeded to map out a possible entry and exit based on price reaction within those key areas.

USD/JPY Bearish Setup Activated - Short from 148.00 Zone!💙 USD/JPY Resistance Rejection ! SELL Setup Activated!
👩💻 Dear traders,
USD/JPY is reacting to a strong supply zone between 147.85 – 148.15. After a sharp bullish move, price is showing early signs of rejection from this area — signaling a possible short setup.
Bias – Bearish
🎯 Target – 147.20
🎯 Target – 146.90
🎯 Final Target – 146.30
🛑 Safe Stop Loss – 148.20
📊 Reasoning:
– Price tapped into a clear resistance zone
– Previous rejections seen around the same level
– Two yellow arrows indicate short-term downside path
– Bearish setup forming after exhaustion push
– High R:R potential for intraday traders
🍀 Stay patient, wait for confirmation, and trade the reaction!

GBPUSD BULLISH Technically:
GBPUSD printed HH
GBPUSD retrace at golden zone
At entry point which is previous support most likely became resistance

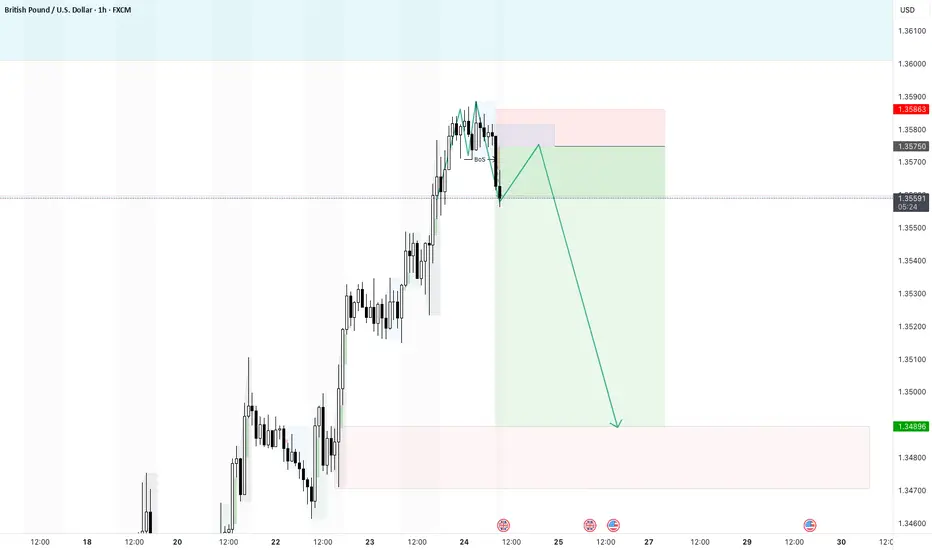
Pull back on GBPUSDThe clear break of structure gives me confidence that a short trade is possible today. Ideally i want a retest of the imbalance and then a push down. My TP is quite far at the moment and i may take profit earlier or move my SL.
GBPUSD Rebounds Strongly – Is the Uptrend Ready to Resume?Hello traders!
On the D1 chart, GBPUSD is showing a strong recovery after bouncing off the support zone around 1.33500–1.34500. This rebound happened right at the ascending trendline and the confluence with the EMA, reinforcing the strength of the bullish zone.
The overall bullish structure remains intact. As long as price stays above the trendline, I expect GBPUSD to continue its move toward the resistance area near the recent highs.
My strategy is to look for buying opportunities around the support zone or after a confirmation signal from price action following a minor pullback.
Good luck and happy trading!

EUR/USD – 1H Timeframe – Bearish Setup- Fibonacci levelsWe’re closely monitoring EUR/USD on the 1-hour chart.
🔻 Trend: Bearish
📉 Price action is clearly forming a series of Lower Highs (LH) and Lower Lows (LL) — a textbook downtrend.
🔎 Divergence: None observed, confirming trend strength.
📊 Current Action: Market is in a retracement phase.
We’ve used Fibonacci retracement, and price has now reached the 38.2% level, a key reversal zone. Based on this, we’ve entered a market sell position.
📌 Trade Setup:
🔹 Entry: Instant Sell @ 1.17302
🔹 Stop Loss: 1.17633
🔹 Take Profit 1: 1.17025
🔹 Take Profit 2: 1.16754
🔹 Risk/Reward: 1:1 and 1:2
🔹 Lot Size: 0.38
🔹 Risk: $200
🔹 Reward: $200 (TP1), $400 (TP2)
⚠️ Bias: Bearish
📍 This trade setup follows strict risk management principles and is based on solid technical confluence.
📈 Let’s see how the price reacts at the key Fib level. Always trade responsibly.
#EURUSD #ForexTrading #BearishSetup #FibonacciTrading #RiskManagement #PriceAction #TradingViewIdeas

EUR/USD - Sells on H1EUR/USD broke an Ascending Channel and have also shifted the trend downwards.
We will wait for a pullback to 0.5 - 0.618 Fib level for entry with the SL placed above the last high

EURUSD: Will Go Up! Long!
My dear friends,
Today we will analyse EURUSD together☺️
The price is near a wide key level
and the pair is approaching a significant decision level of 1.17201 Therefore, a strong bullish reaction here could determine the next move up.We will watch for a confirmation candle, and then target the next key level of 1.17348.Recommend Stop-loss is beyond the current level.
❤️Sending you lots of Love and Hugs❤️

eurusd sell tradeThe Relative Strength Index (RSI) is showing a downward trend, indicating weakening momentum. Additionally, the Moving Average Convergence Divergence (MACD) is showing a bearish crossover, further supporting the potential for a downward move

Flag ReversalWe might see this guy use this flag reversal to push down, we are currently at the sell side of the trend and we want to believe that the pair is going to push down even more

GBPUSD Support & Resistance Levels🚀 Here are some key zones I've identified on the H1/M15/M5 timeframe.
These zones are based on real-time data analysis performed by a custom software I personally developed.
The tool is designed to scan the market continuously and highlight potential areas of interest based on price action behavior and volume dynamics.
Your feedback is welcome!

CHECK EURJPY SIGNAL READ THE CAPTAINEntry Point: Around 173.000 172.900
Stop Loss: Around 173.450
🎯 Target Levels
Take Profit 1:
172.450
Take Profit 2:
171.850
last target
171.350

GBP USD shortpossible after bullish rally today is a busy day we may see a correction in the trend
Please note: This is for educational purposes only and not a trading signal. These ideas are shared purely for back testing and to exchange views. The goal is to inspire ideas and encourage discussion. If you notice anything wrong, feel free to share your thoughts. In the end, to learn is to share !


AUDUSD(20250725)Today's AnalysisMarket news:
The European Central Bank announced that it would maintain the three key interest rates unchanged, reiterated data dependence, warned that the external environment is highly uncertain, and President Lagarde did not rule out the possibility of future rate hikes. Traders reduced their bets on ECB rate cuts.
Technical analysis:
Today's buying and selling boundaries:
0.6598
Support and resistance levels:
0.6638
0.6623
0.6613
0.6583
0.6573
0.6559
Trading strategy:
If the price breaks through 0.6598, consider buying in, with the first target price of 0.6613
If the price breaks through 0.6583, consider selling in, with the first target price of 0.6573

EURUSD – The Comeback is Real! After weeks trapped in a descending channel, EURUSD has broken out in style, launching into a clean bullish channel. Price is now carving a staircase of FVG zones, with momentum clearly favoring the bulls.
What’s fueling the fire?
Flash Manufacturing PMI from Europe beat forecasts
Eurozone consumer confidence improved
Markets pricing in dovish Fed as jobless claims dropped but inflation expectations stall
As long as price stays above 1.1750 and respects the ascending channel, the 1.1850 zone is well within reach.
Strategy: Buy the dips inside the bullish channel. FVGs act as stepping stones for further upside.

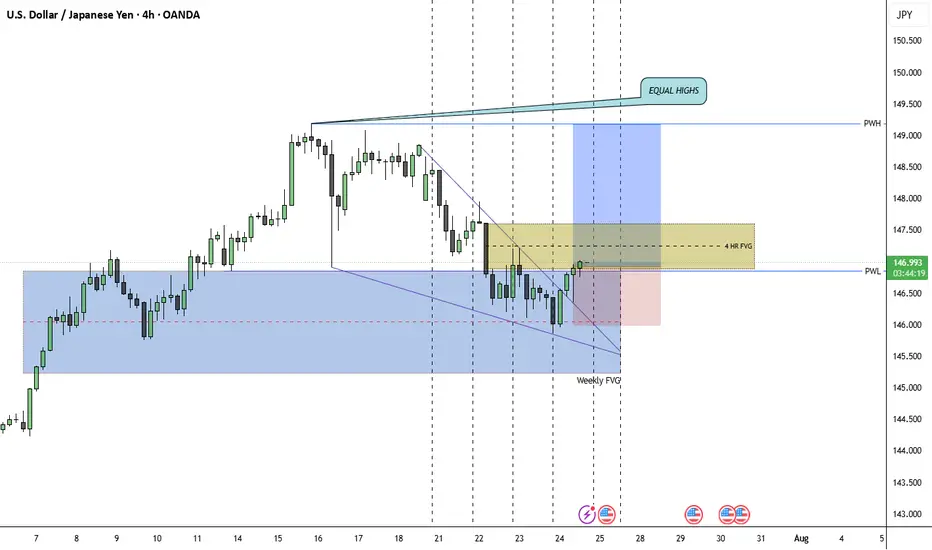
Bullish on usdjpyI am currently long USDJPY. It's Thursday, and there’s still plenty of buy-side liquidity left. The highs from Monday, Tuesday, and Wednesday remain unchallenged. We've also traded into a weekly PD array (weekly FVG), respecting the C.E. and moving away, which signals a local low for me. Additionally, we're breaking out of a falling wedge, with the breakout target being the top of the wedge. Lastly, DXY is beginning to show bullish market structure shifts on the 15m and 1h timeframes. I am targeting those relative equal highs. Invalidation lies at the most recent swing low.

EURCAD Wave Analysis – 24 July 2025- EURCAD reversed from support zone
- Likely to rise to resistance level 1.6100
EURCAD currency pair earlier reversed up from the support zone between the key support level 1.5950 (former monthly high from April), 20-day moving average and the 38.2% Fibonacci correction of the upward impulse from May.
The upward reversal from this support zone started the active minor impulse wave iii – which belongs to the intermediate impulse wave (3) from the end of 2024.
Given the overriding daily uptrend, EURCAD currency pair can be expected to rise to the next resistance level 1.6100 (which stopped the previous impulse wave i in June).

A PICTURE OF THE SURPOSE BULLISH MOVEMENT As analyzed in my previous poste , we had some quick fakes outs but the direction was confirmed to be bullish.
as we see we hope to ride it to the TF
THE TREND IS YOUR FRIEND

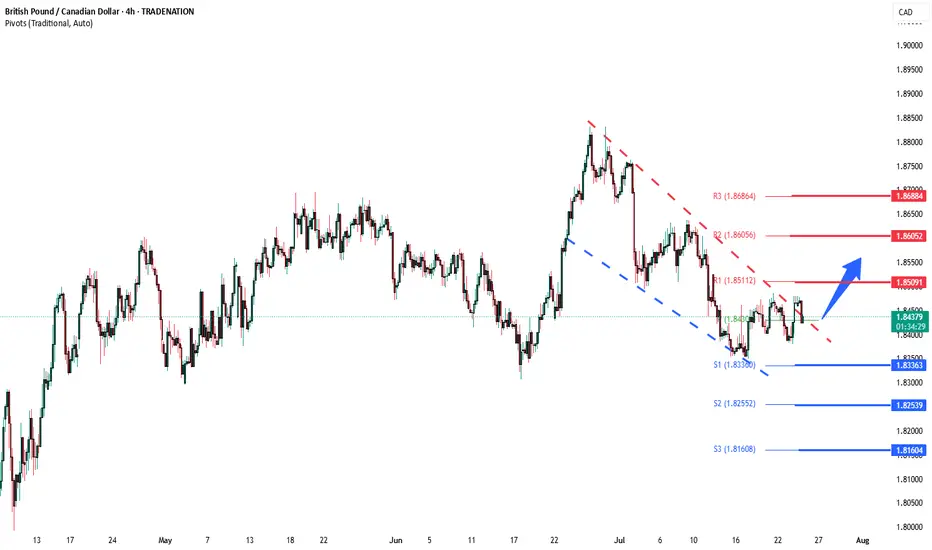
GBPCAD Bullish breakout supported at 1.8336The GBPCAD remains in a bullish trend, with recent price action showing signs of a corrective pullback within the broader uptrend.
Support Zone: 1.8336 – a key level from previous consolidation. Price is currently testing or approaching this level.
A bullish rebound from 1.8336 would confirm ongoing upside momentum, with potential targets at:
1.8510 – initial resistance
1.8600 – psychological and structural level
1.8690 – extended resistance on the longer-term chart
Bearish Scenario:
A confirmed break and daily close below 1.8336 would weaken the bullish outlook and suggest deeper downside risk toward:
1.8254 – minor support
1.8160 – stronger support and potential demand zone
Outlook:
Bullish bias remains intact while the GBPCAD holds above 1.8336. A sustained break below this level could shift momentum to the downside in the short term.
This communication is for informational purposes only and should not be viewed as any form of recommendation as to a particular course of action or as investment advice. It is not intended as an offer or solicitation for the purchase or sale of any financial instrument or as an official confirmation of any transaction. Opinions, estimates and assumptions expressed herein are made as of the date of this communication and are subject to change without notice. This communication has been prepared based upon information, including market prices, data and other information, believed to be reliable; however, Trade Nation does not warrant its completeness or accuracy. All market prices and market data contained in or attached to this communication are indicative and subject to change without notice.