July 21 Special Update : Metals, SPY & More. What's Next.This special update is to highlight why I continue to believe traders should stay very cautious of this rally in the SPY/QQQ/BTCUSD.
Underlying economic data suggest that this is one big speculative rally following the April Tariff collapse.
And, the economic data I see from my custom indexes sugg
ETF market

MSOS Long with 150% Upside - Cannabis Rescheduling Catalyst💠 Catalyst : Cannabis is currently classified as a schedule I drug alongside heroin, bath salts, and synthetic opioids that kill thousands every year — all while being safer than Tylenol and legal in over half the country. Cannabis is likely to be rescheduled to a schedule III drug soon after Terry

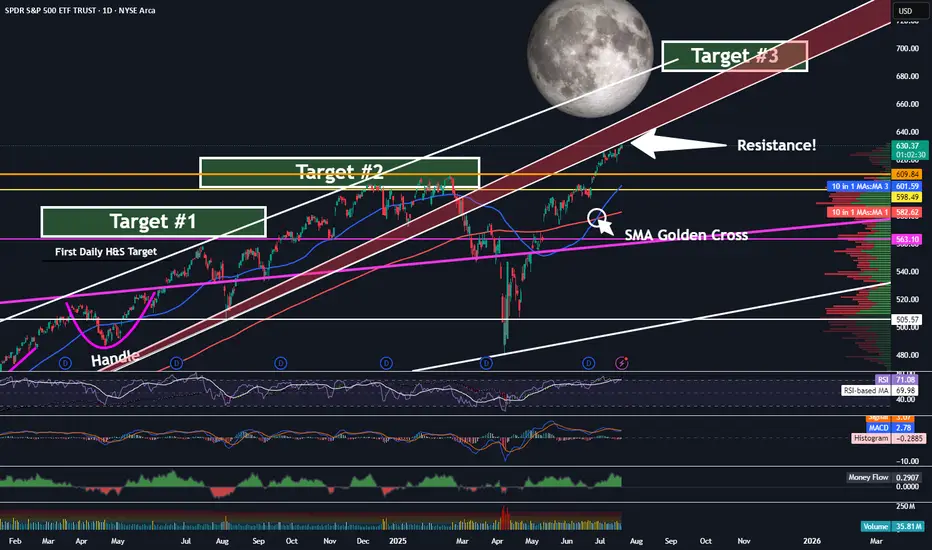
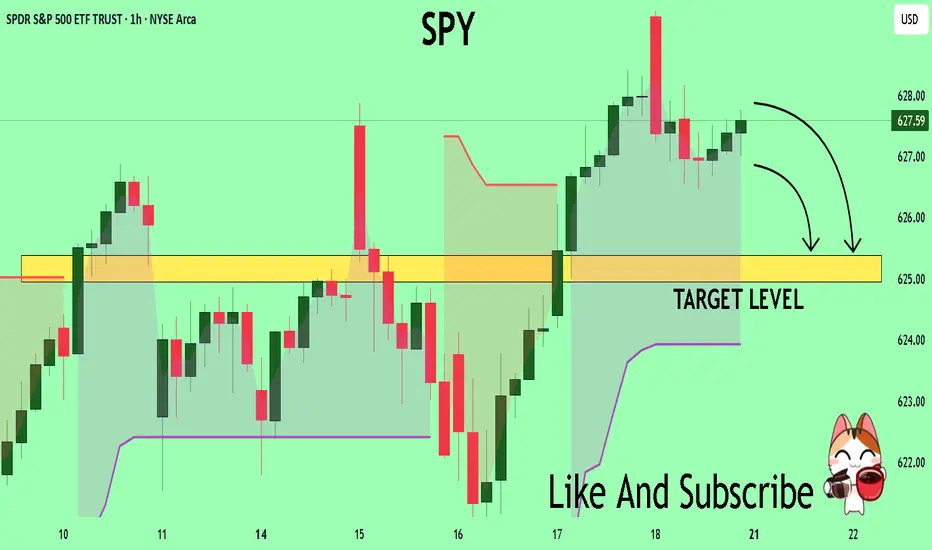
SPY - On Our Way To Target 3 ...But First?Trading Fam,
It's been a while since I updated you all on the SPY, which, as you know, we track closely to help us determine the overall market trend. Since we have now exceeded my Target #2, it's time for me to give you all another update. But first, a little context for my new readers which I hav
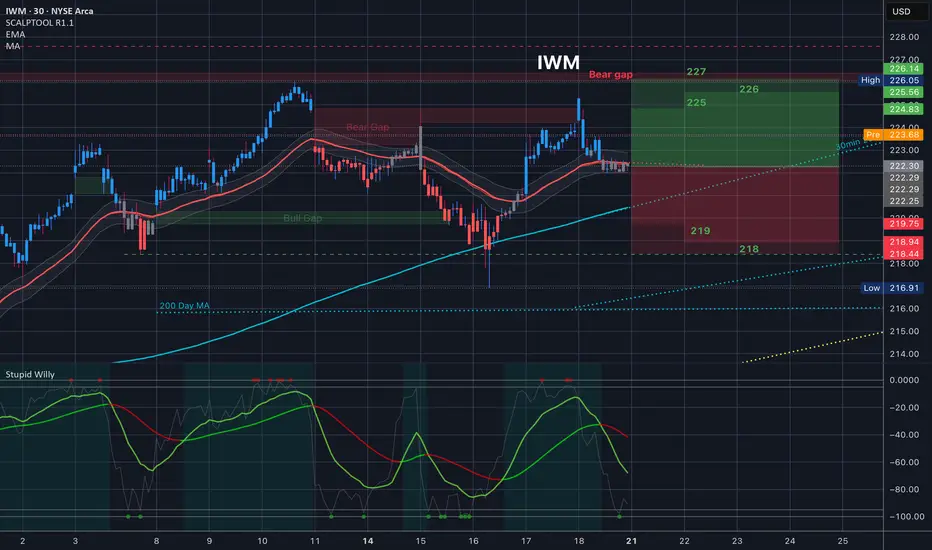
$IWM Trading Range for 7.21.25 and everything in itToday’s Trading range and everything in it. How are you playing it?
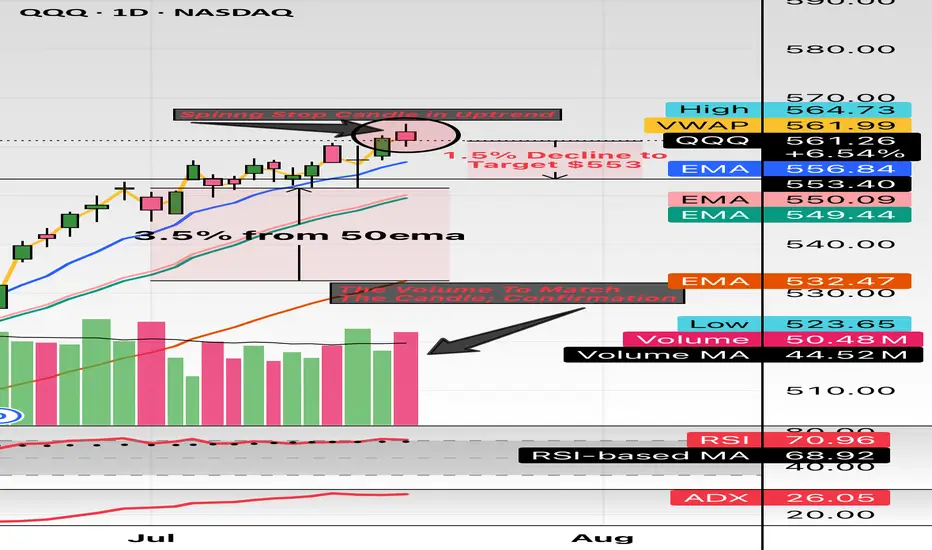
$QQQ this might the spot. Hello and good night, evening, afternoon, or morning wherever you may be. I have been looking at names all day and I wanted to check the indexes: NASDAQ:QQQ and $SPY.
Here we have the indexes up almost 30% from the April lows and sitting about 10% YTD. The candle highlighted is the spinning stop
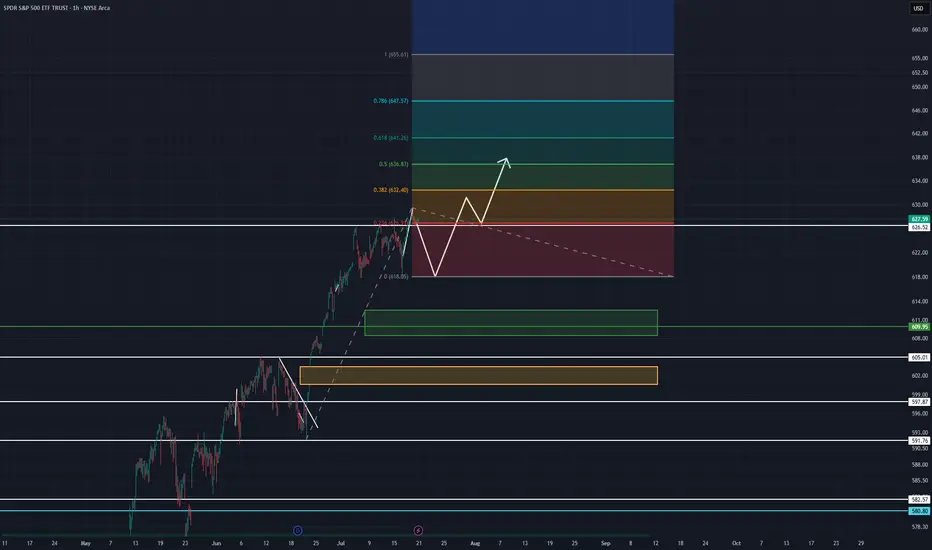
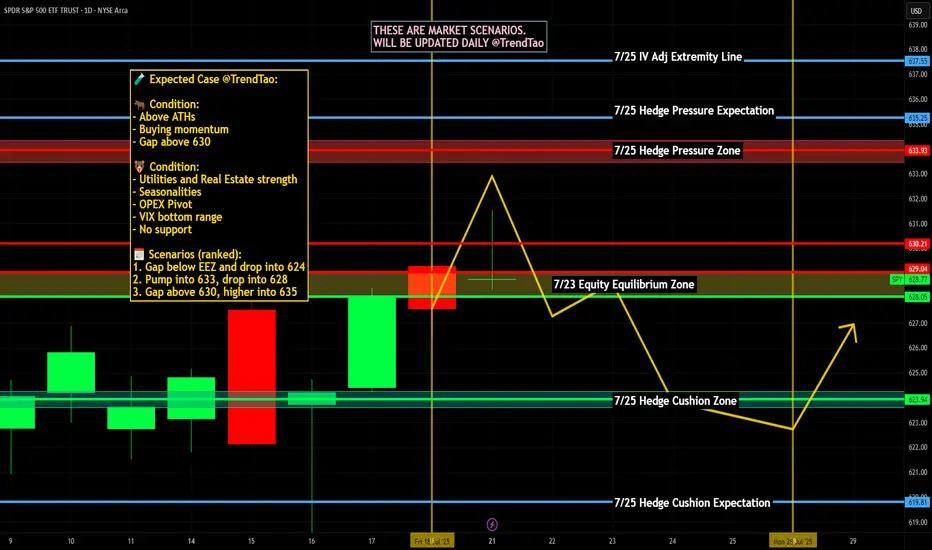
SPY July 21-25AMEX:SPY
Looking at the 4 hr. timeframe on SPY. Bearish divergence is signaling a need for some cool off. I assume this will happen almost immediately, Monday maybe into Tuesday. I expect to keep above strong support levels at 618 and 609.95. Drops below 609 will change my stance to a more beari
Nightly $SPY / $SPX Scenarios for July 22, 2025🔮 Nightly AMEX:SPY / SP:SPX Scenarios for July 22, 2025 🔮
🌍 Market-Moving News 🌍
🚀 Tech & EV Stocks in Focus Ahead of Earnings
Futures were quiet ahead of Tuesday’s open, but key movers included Astera Labs (+19%), Alphabet (+2.7%), Netflix +2%, and Robinhood –4.9% after being passed over for t
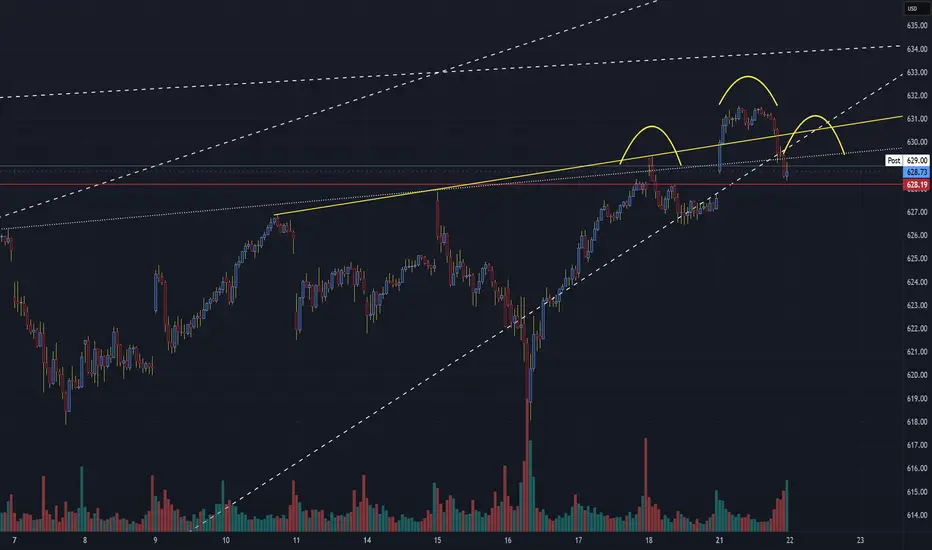
SPY Forming A Bearish Head and Shoulders PatternSPX Technical Update – Bearish Watch
Chart Focus: S&P 500 Index (30-Min Chart)
Date: July 21, 2025
🧠 Pattern Watch: Classic Head & Shoulders Formation
A clear head and shoulders pattern has emerged on the short-term 30-minute chart, signaling a potential bearish reversal after the recent uptrend.
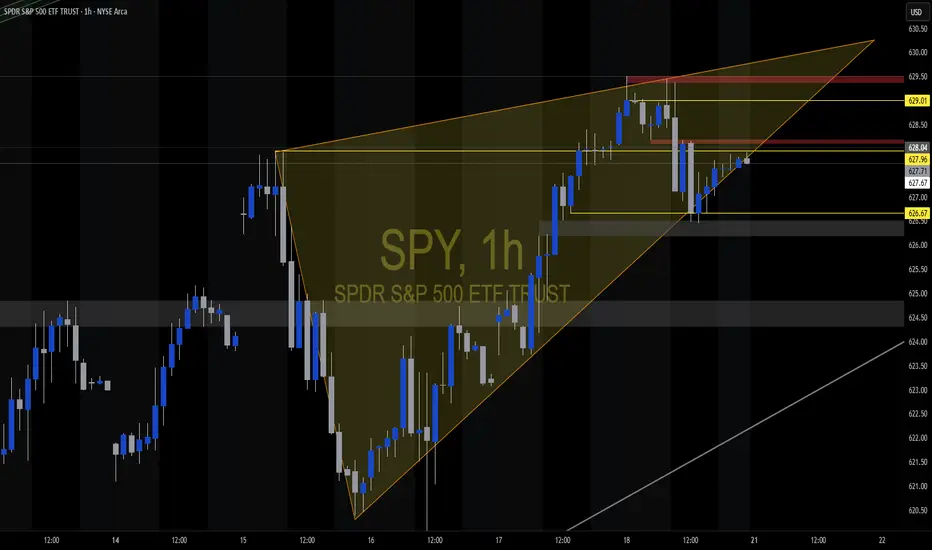
SPY What Next? SELL!
My dear friends,
Please, find my technical outlook for SPY below:
The instrument tests an important psychological level 627.59
Bias - Bearish
Technical Indicators: Supper Trend gives a precise Bearish signal, while Pivot Point HL predicts price changes and potential reversals in the market.
Ta
See all popular ideas
Community trends
SymbolPrice & chgNAV total return 1Y
SymbolNAV total return 1Y / Price
SymbolPrice & chgDividend yield FWD
SymbolDividend yield FWD / Price
ETF collections
LargestHighest AUM growthHighest returnsBiggest losersEquityBitcoinEthereumGoldFixed incomeReal estateTotal marketCommoditiesAsset allocationInverseLeveragedMost tradedLargest inflowsLargest outflowsHighest discount to NAVHighest premium to NAVHighest yieldDividendMonthly distributionsHighest diversificationActively managedSectorHighest betaLowest betaNegative betaHighest expense ratioAll-time highAll-time low52-week high52-week lowETFs of the USAETFs of CanadaETFs of the United KingdomETFs of GermanyETFs of JapanETFs of AustraliaSee all