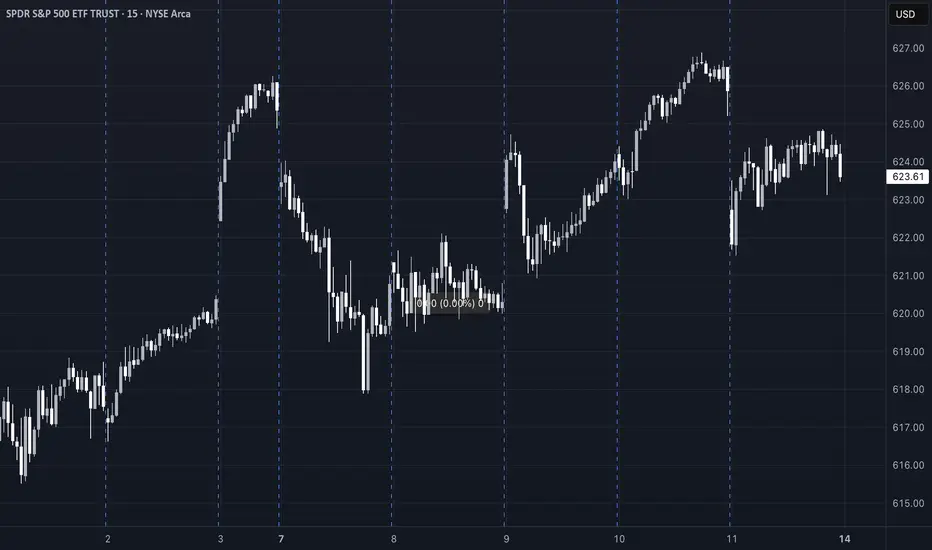
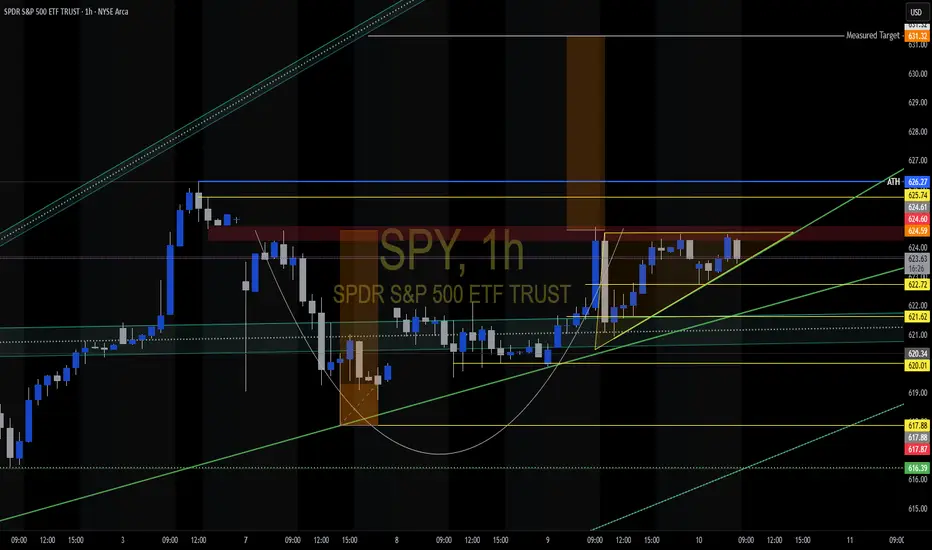
SPY: Short Signal Explained
SPY
- Classic bearish formation
- Our team expects pullback
SUGGESTED TRADE:
Swing Trade
Short SPY
Entry - 623.61
Sl - 633.09
Tp - 606.99
Our Risk - 1%
Start protection of your profits from lower levels
Disclosure: I am part of Trade Nation's Influencer program and receive a monthly fee for using their TradingView charts in my analysis.
❤️ Please, support our work with like & comment! ❤️
ETF market

How Much Risk Are You Really Taking?
I get two common horror stories from new QS members:
“I followed a few QS signals, nailed some wins… then bled it all back.”
“My first couple signals lost, and my account was toast.”
My first question to both groups is always the same:
“How much risk did you assign to that trade?”
❌ Why Most Traders Dodge This Question
Risk management isn’t sexy.
Green arrows and slam‑dunk gains are fun to talk about. Stop‑losses and position sizing? Not so much.
Gambling feels easier than math.
Going “all‑in” gives you the casino rush. Calculating max drawdown does not.
Accountability hurts.
If the trade blows up, there’s no one to blame except the person who sized it.
⚔️ Trading = War (No, It’s Not “Fun”)
Like I said in “What’s Your Catalyst?” — trading is financial warfare.
Show up without armor (risk rules) and you’re the first casualty.
In basketball you need defense before dunks.
In war you need body armor before bullets.
In trading you need risk management before any strategy.
📏 My Simple Rule
Only risk what you’re prepared to watch burn—completely.
If the idea of that money turning to ash makes you queasy, you’re oversized. Period.
🧠 Questions to Ask Before Every Trade
Position size: How many dollars exactly can I lose and still fight tomorrow?
Probability: Is this setup strong enough to justify that risk?
Stop‑loss: Where is my hard exit? No “I’ll see how it feels.”
Reward‑to‑risk: Is the upside worth at least 2–3× the downside?
Confidence check: If I’m not 100 % cool watching this cash burn, why am I risking it?
🚀 Pair Your Edge with Protection
AI and QS signals give you edge — a slightly better chance in a brutal game.
But edge without risk control is like a sniper without body armor: lethal until one bullet hits.
Next time you celebrate a hot streak or curse a quick wipe‑out, pause and ask:
“How much risk did I really assign to this trade, and was it worth it?”
If you can answer honestly and still sleep at night, proceed.
If not, size down, armor up, and protect your capital first.
Strong defense wins championships — and trading accounts. 🛡️💰

The Myth of Win RateOne of the most common questions I get from QS members:
“What’s the win rate of the signal?”
Sounds like a smart question. But it's often coming from the wrong mindset — the same mindset as a student cramming for a test, hoping for one perfect answer key that’ll give them a 90% score and an easy win.
Let me break this down for you:
🧮 The Only Two Numbers That Matter in Trading
There are only two math truths that actually grow your account:
Win Rate – how often you’re right
Win/Loss Ratio – how much you make when right vs. how much you lose when wrong
Everyone obsesses over #1.
Almost no one truly understands or applies #2 — and that’s the real killer.
---
🤔 So What’s the Ideal Setup?
In a perfect world, you’d have:
A high win rate (80–90%)
AND a high win/loss ratio (make $3, lose $1)
But guess what?
This isn’t a perfect world — this is a war.
See my earlier post: "What’s your catalyst?"
---
⚔️ Trading Is Like War (or Sports)
In war, victory is rare and costly.
In sports, scoring takes hard work, timing, and discipline.
In trading:
You win big when the odds are stacked in your favor
You cut losses quickly when you’re on the wrong side
That's the gold standard — but few do it.
Even worse, many do the exact opposite:
Take quick profits to “lock in a win”
Let losers run hoping for a miracle
Then they wonder why their account bleeds over time.
---
🎰 Vegas Was Built on 51% Win Rate
Casinos don’t need to win every game. They just need:
Slightly better than 50% edge
Strict control over risk and payout
That 1–2% edge? It built every billion-dollar casino on the Strip.
Now think again:
Why are you chasing a 90% win rate when even 55% + smart risk control can make you rich?
---
🧠 Profitability > Win Rate
You don’t need to win all the time.
You need to win big enough and lose small enough.
Your goal should be:
3 steps forward, 1 step back.
That’s the realistic rhythm of trading success.
---
✅ So Next Time You Ask About a Signal...
Don’t just ask:
“What’s the win rate?”
Instead ask:
“What’s the reward if I’m right?”
“What’s the damage if I’m wrong?”
“How do I size this trade so my wins outgrow my losses over time?”
This is how real traders think.
Not about perfection — but about probability, edge, and sustainability.
---
💬 TL;DR
Win rate is just one piece.
Your win/loss ratio and risk management matter more.
Profitability > accuracy.
The market doesn’t reward perfection. It rewards preparation, defense, and discipline.
Keep playing smart, not perfect.
And remember — it’s a long game. 🧠📈
Select Your Trading Time
There’s an old saying:
“Plan your trade, and trade your plan.”
But I want to add something even more important:
“Pick your time to trade.”
---
💰 The Market Is Not Your ATM
Everyone enters trading with one goal: make money.
Some even think of the market as an ATM — pull the handle, cash comes out.
But the truth is:
❌ The market doesn’t care about your goals
❌ It won’t move just because you need to make money today
This is a brutal game. And you don’t control the clock.
---
⚠️ When You Force a Trade...
Too many traders say:
“I have to make money today.”
“I need to hit $X this week.”
“I just took a loss, I must come back now.”
That kind of thinking leads to:
Bad entries
Overtrading
Emotional decisions
Big losses
❗ Trading success doesn’t come from forcing outcomes — it comes from waiting for the right moments.
---
🧠 What Happens on Low-Volatility Days
Let’s take today as an example.
SPY moved in a 2-point range all day.
No momentum, no trend, just chop.
Some traders:
Ran one QS signal after another
Forced trades just to feel busy
Got chopped up by fast reversals
Then blamed the signals
But here’s the truth:
AI or not , you can’t expect any long-volatility trade to work when the market is dead still.
The only winners on days like today? Market makers and options sellers.
---
❓ Why Trade at All on a Day Like This?
If the market isn’t offering opportunity,
Why force it? Why chase trades? Why burn your energy?
The smarter move is:
Sit out
Observe
Wait for better setups
Preserve your mental and financial capital
---
🔄 Recovery? Yes — But on Your Terms
Some traders lose money and say:
“I need to make it back today.”
That’s emotional revenge trading.
What if the market doesn’t give you a clean opportunity today?
Are you still going to go all-in, out of frustration?
❌ That’s not a strategy. That’s gambling.
---
📍 QS Signals Are a Map — Not a Magic Button
QS AI signals help you find opportunities — but even the best map won’t help if:
You're in the wrong city (bad market environment)
You’re rushing without checking road conditions (volatility, news, timing)
Even with QS, you don’t have to trade every day, every hour.
---
✅ What You Should Do
Be patient
Respect market conditions
Take a break on slow or tricky days
Come back when the odds are in your favor
---
🧘♂️ Final Words
You don’t have to win every day.
You don’t have to trade every day.
You don’t even have to be active to be successful.
🎯 Trade less. Trade smarter. Select your time wisely.
That’s how real traders survive and thrive in this game.
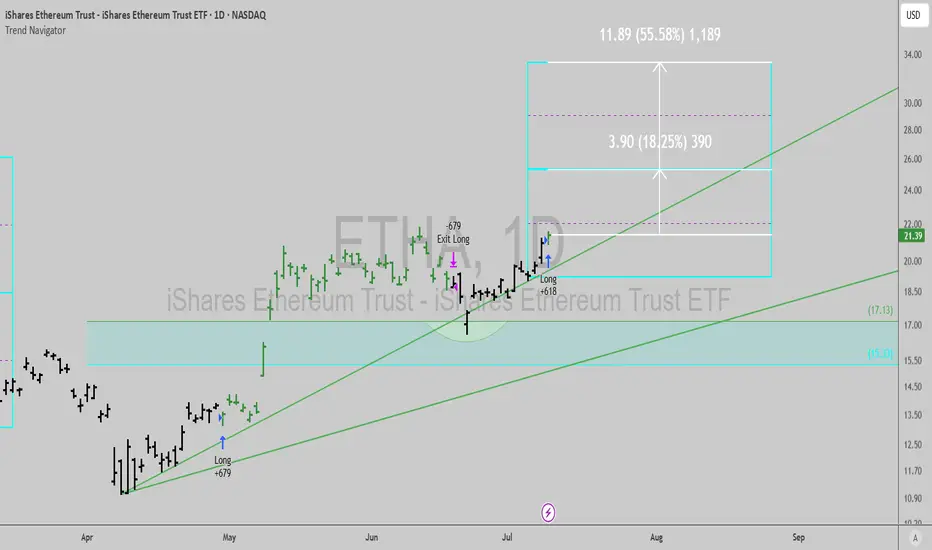
$ETHA: ETH ETF about to explode higher...For now, ETF buyers are down since inception, but that is about to change.
The Trend Navigator algo is flashing a buy signal today, as weekly flashes a Time@Mode signal.
(obligatory to mention that the Trend Navigator algo is up 30% ish in this chart in the same period)
A lot of people are either sidelined or looking to exit the market right as it's about to trend up steadily for months it seems. Don't be like them and hodl.
Best of luck!
Cheers,
Ivan Labrie.
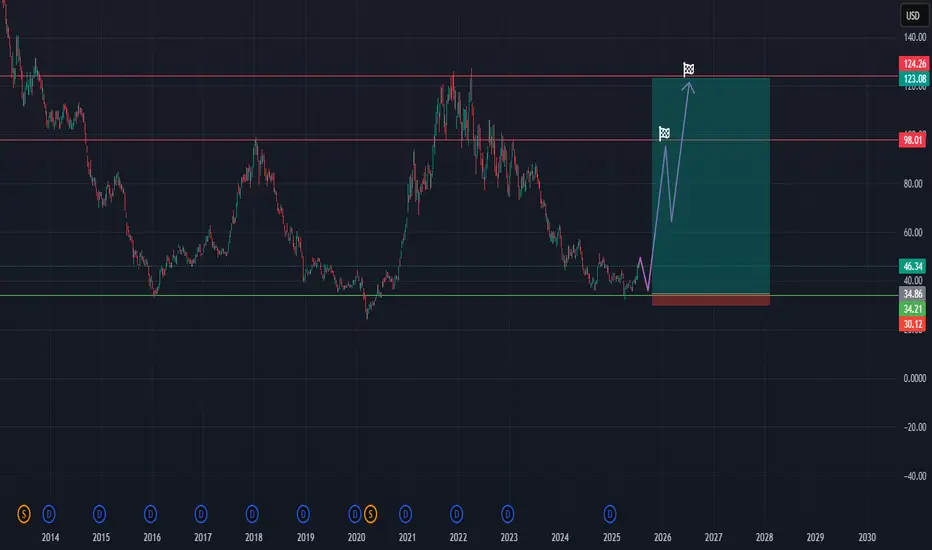
Long REMX (Rare Earth/Strategic Metals ETF)hi traders,
1. The chart shows REMX has experienced a significant downtrend since late 2021/early 2022, reaching levels last seen around 2020.
2. Entry Strategy (Green Box):
The idea is to enter long positions as the price approaches or bounces from this established support area, anticipating a reversal or a significant rebound.
3. Stop-Loss ($30):
A stop-loss is crucial to limit potential losses if the support level fails and the price continues to decline, invalidating the bullish thesis.
4. Price Targets (Purple Arrows and Red Lines):
Target 1 (First Purple Arrow & Red Line): The first target is around $98.01. This level acted as significant resistance/support in the past (around mid-2022 and early 2021).
Target 2 (Second Purple Arrow & Red Line): The second, more ambitious target is around $124.26 to $123.08. This represents a major resistance level from the 2021-2022 peaks.
These targets are based on previous price action, aiming to capture a substantial portion of a potential recovery. The two targets allow for a tiered profit-taking strategy.
* Summary of the Trading Idea:
This trading idea is a long-term bullish bet on REMX, based on the assumption that the ETF is currently near a significant historical support level and is due for a substantial rebound. The strategy involves accumulating positions in the identified entry zone, setting a stop-loss below the key support, and aiming for two distinct profit targets corresponding to prior resistance levels. The time horizon for this trade appears to be medium to long-term, potentially extending into 2026-2028,
Friday afternoon UpdateSPX looks like it's consolidating only. Gold has broken above resistance. OIL and Nat Gas looks like they want to go higher. BTC should go higher, but not too much more.

SOXL Will FLY!Just look at the AD line:
With its sharp V-shaped recovery, the A/D Line (middle area) shows that the recent price rise is being driven by significant capital inflows and strong buying interest.
The Accumulation/Distribution Oscillator (lower panel) underlines this with an exceptionally high green bar, indicating massive buying pressure in the recent trading period.
At the moment there are no obvious negative divergences between price and indicators. Rather, the indicators are signaling strong bullish momentum, which is supporting the current upswing. For an instrument as volatile as a leveraged ETF, this is a remarkable sign of the strength of the current move.
I don't want to sound euphoric, but THIS is a BIG BUY!

Opening (IRA): TLT Sept 19th 83 Short Put... for an .88 credit.
Comments: Camping out with a strike slightly below the 52-week low, where the options contract is paying a smidge more than 1% of the strike price in credit.
I don't really need more TLT, but wouldn't mind being assigned more at a lower price than the stock element of my covered calls.

ITB WAVE B BOTTOM WAVE C UP moving long calls marketThe chart posted is that of the housing Market for builders .I have what looks to be a clean wave count . And should have an upward rally back above the wave a up wave C up should get to 50% most likely . I am long in the money 2027 calls now

$SPY Today’s Trading Range and everything in it /// 7.11.25Beautiful start here right at the bottom of the expected move for the day.
Today’s Trading range and everything in it. How are you playing it?

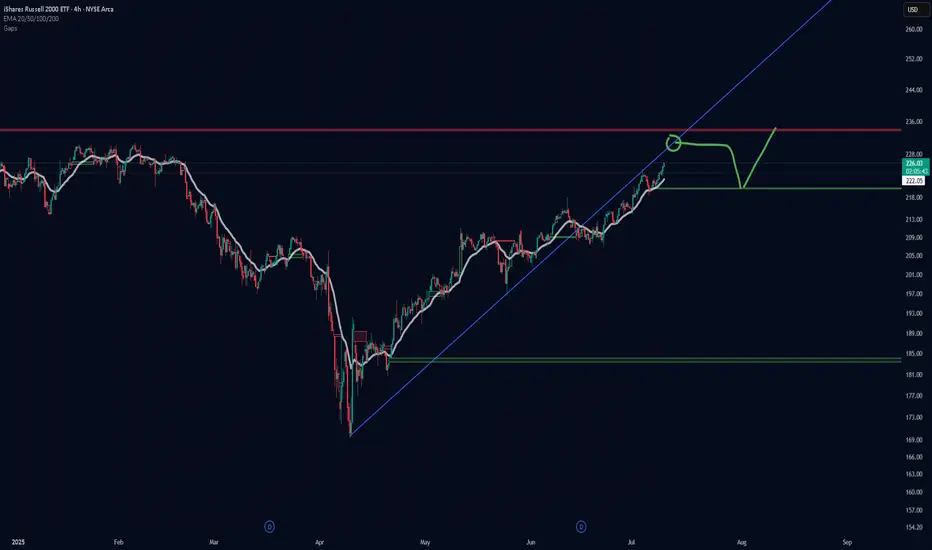
IWM projected pathI have three rooms full of supercomputers and then a few laptops in a spare bathroom plus a refrigerator in my wife's cardboard box running simulations 24/7 about the projected path of the Russell. Based on their findings I have determined that our previous support is now the resistance. When we come into contact with this resistance we will begin to work our way back down to fill the gap before continuing up to achieve a new all time high. When we hit resistance I have prophesized that will go mostly sideways for a numbers of days before we drop down to fill the gap. Thank you. Praise the Lord.
Nightly $SPY / $SPX Scenarios for July 11, 2025🔮 Nightly AMEX:SPY / SP:SPX Scenarios for July 11, 2025 🔮
🌍 Market-Moving News 🌍
🏦 Strong Bank Earnings Amid Tariff Churn
Next week’s Q2 forecasts point to robust earnings from U.S. banks—JPMorgan, Citi, Bank of America, Goldman Sachs, Morgan Stanley, and Wells Fargo—as trading and investment-banking revenue recover, offsetting uncertainties from ongoing tariffs
💬 Dimon Flags Fed Risk Pricing
JPMorgan’s Jamie Dimon cautioned that markets may be underestimating upside in interest rates. He sees a 40–50% probability of higher U.S. rates, driven by inflation from tariffs, migration, and fiscal deficits
⚖️ Tariff “Scattergun” Sparks Sector Disconnect
Trump’s plans to levy up to 200% tariffs on pharma and 50% on copper triggered uneven market reactions—copper prices rose 30% in six months, while European drugmakers remain flat, highlighting divergent sector sensitivities
📉 Tech & Macro Still Bullish
Despite policy turbulence, Nvidia climbed back above a $4 trillion valuation, and JPMorgan projects a $500 billion inflow into equities in H2—supporting gains even as broader macro pressures linger
📊 Key Data & Events
📅 Friday, July 11:
(No major U.S. economic data scheduled)
Markets will focus on bank earnings previews, tariff headlines, and the hold of the tech rally into a thin summer trading week.
⚠️ Disclaimer:
This information is for educational and informational purposes only and should not be construed as financial advice. Always consult a licensed financial advisor before making investment decisions.
📌 #trading #stockmarket #economy #tariffs #banks #tech #Fed #investing

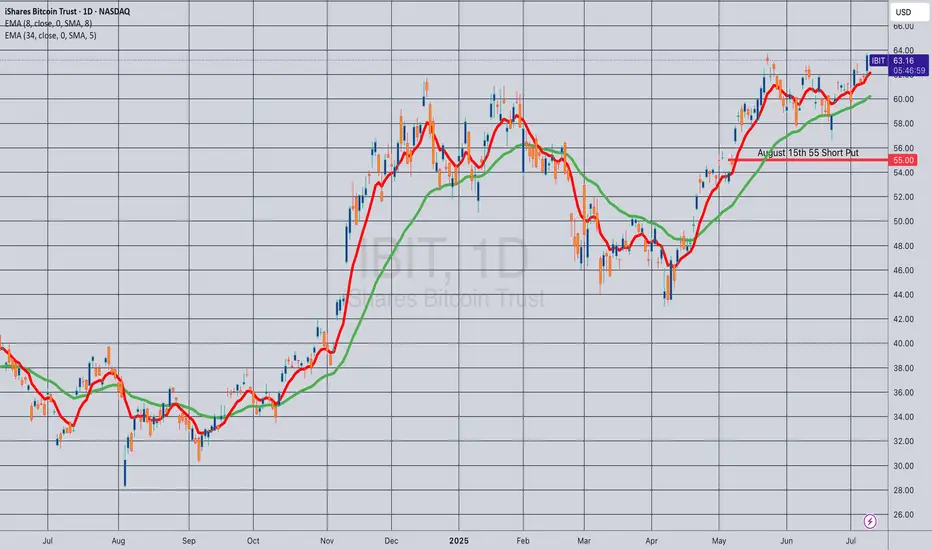
Opening (IRA): IBIT August 15th 55 Short Put... for a .62 credit.
Comments: One of the higher IV ETF's on my board. Targeting the strike paying around 1% of the strike price in credit.
Opening (IRA): IBIT July 18th 51 Short Put... for a .59 credit.
Comments: One of the higher IV ETF's on my board at the moment. A starter position, targeting the strike paying around 1% of the strike price in credit.
Will look to ladder out at intervals ... .

SPY Bullish Patterns C&H Pattern W/ Right Angle Wedge. Wait for confirmation and retest to have a high probability of success.
$DIA Tomorrow’s Trading Range and everything in it /// 7.10.25
Today’s Trading range and everything in it. How are you playing it?
Amazing here how we've stayed right in the iplied move. Green signal line today

$IWM Tomorrow’s Trading Range and everything in it /// 7.10.25
Today’s Trading range and everything in it. How are you playing it?
Really the only thing in the trading range is a bear gap and 35EMA. Easy Trading Range

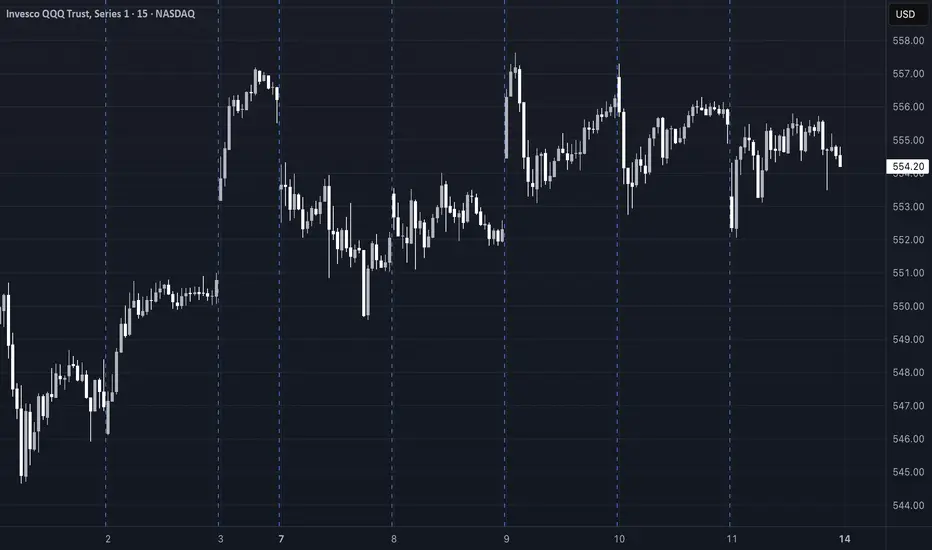
$QQQ Tomorrow’s Trading Range and everything in it /// 7.10.25
Today’s Trading range and everything in it. How are you playing it?

$SPY Tomorrow’s Trading Range and everything in it /// 7.8.25Today’s Trading range and everything in it. How are you playing it?

$QQQ Tomorrow’s Trading Range and everything in it /// 7.8.25Tomorrow’s Trading range and everything in it. How are you playing it?


Rare Earth super cycle ?If we clear $43 and hold this level, this thing could fly. I’m not going to go too much into this but don’t be surprised if we get an aggressive move up. Not financial advice
