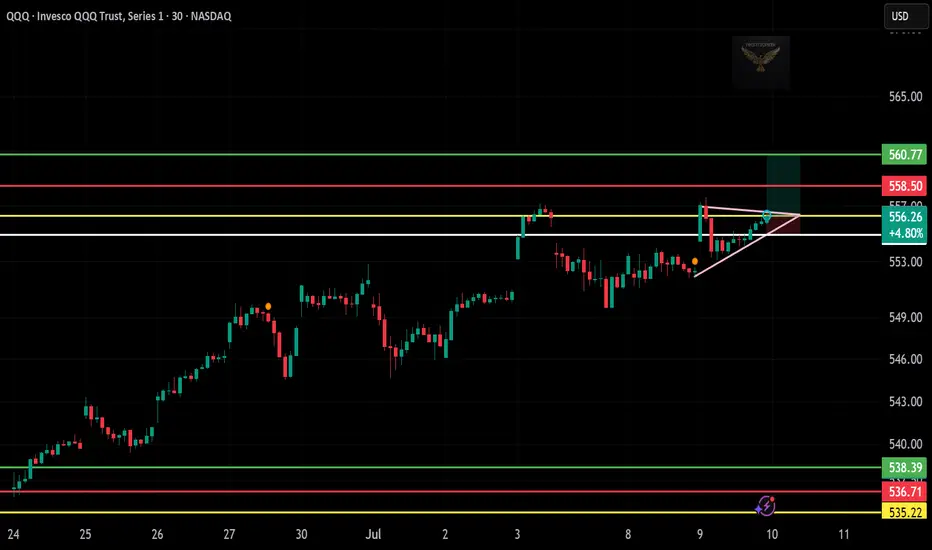
$QQQ Long Trade Setup – July 10📈
Price formed a tight triangle right at resistance—and today we got the breakout. Looks ready for continuation if volume steps in.
📌 Entry: $556.26
🎯 Target: $560.77
🛑 Stop Loss: Below $554.00
⏱️ Timeframe: 30-min chart
🔍 Why I Like This Trade:
Strong bullish flag breakout after retest
Holding above structure with higher lows
Clean path toward the upper resistance zone
🧠 This setup aligns with the overall tech strength—riding the momentum with tight risk!
ETF market
Nightly $SPY / $SPX Scenarios for July 10, 2025🔮 Nightly AMEX:SPY / SP:SPX Scenarios for July 10, 2025 🔮
🌍 Market-Moving News 🌍
🏦 Global Banks Profit from Tariff Volatility
Major banks like JPMorgan, BofA, and Citigroup are expected to see ~10% growth in trading revenue in Q2, fueled by volatility from President Trump’s tariff policy shifts. Treasury trading volumes hit record highs as markets priced in policy swings
📈 S&P 500 Nears Lull Amid Bull Market Strains
Despite record highs in 2025, investors are warning that the rally may be reaching its limit. Bullish sentiment is strong, but analysts caution that sluggish consumer spending, rising inflation from tariffs, and few rate-cut signals from the Fed could cap downside momentum
🐻 Bear Case Gains Ground
Stifel’s Barry Bannister projected a potential ~12% correction in the second half of 2025. Key risks include slowing consumer spending, weak capital investment under tariff uncertainty, and persistent core inflation above 3%, negatively impacting earnings and growth outlooks
⚖️ “One Big Beautiful Bill” Could Add Trillions in Debt
The new fiscal package signed July 4 will add $3–4 trillion to national debt over the next decade while extending tax cuts and revising EV incentives. Bond market and Fed policy implications may become more pronounced if growth fails to keep pace
📊 Stocks vs Bonds: Diverging Signals
While equities climb and megacaps extend gains, Treasury yields have risen five days straight—signaling growing caution over real growth prospects. The yield curve steepening hints at mixed signals: growth optimism in stocks, but bond market signaling economic risk ahead
📊 Key Data & Events
📅 Thursday, July 10:
No major scheduled economic releases. Markets remain driven by tariff headlines, bank earnings reactions, and evolving Fed signals.
⚠️ Disclaimer:
This is for informational and educational purposes only—not financial advice. Consult a licensed advisor before making investment decisions.
📌 #trading #marketvolatility #tariffs #banks #Fed #debt #technicalanalysis

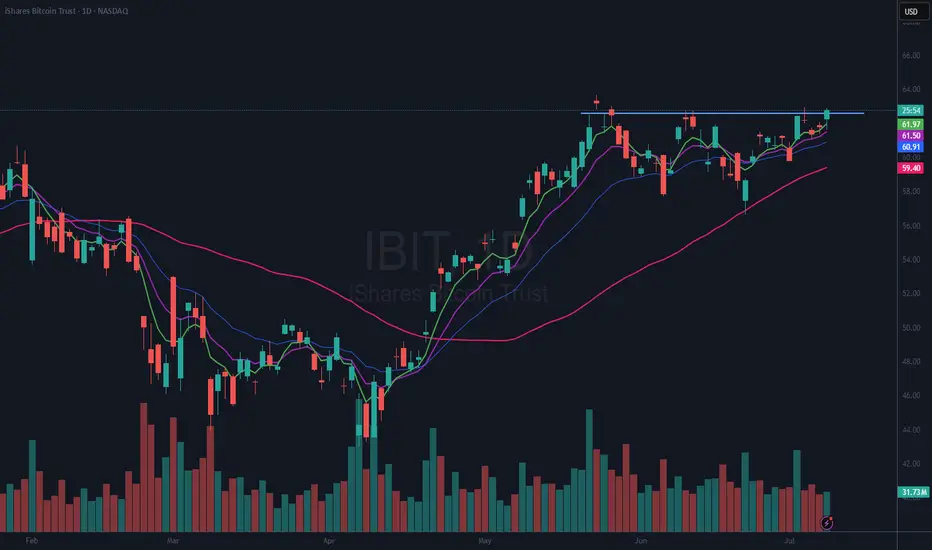
$IBIT a BITCOIN ETF Is Breaking Out of a Flat BaseNASDAQ:IBIT I have been looking at this for quite awhile now. I drew in an “area” of resistance, and it has hit that twice in the last few days. I bought a position on Jul 3rd and was stopped out. It just broke again so I have opened yet another position and will use a stop on a close below the 21 EMA (blue).
If you like this idea, please make it your own and trade it only using your own trading plan. Remember, it is YOUR money at risk.
TOM LEE leading the charge in this new BULL MarketThank you for providing excellent analysis,
being on the right side of the trade
and helping retail with your public speaking on your own channel, podcasts, and of course CNBC.
I wish you continued success in you Granny shots ETF which is already over $1.5 Billion in AUM!

Multi Market Update 7-9-2025SPY likely put in a C wave this morning, I expect a further move down for the rest of the week. Gold starting to look bullish again. Natural Gas likely keeps dropping towards 2.5. BTC at the top of it's range. USOIL is at resistance. The stock I'm trading - aapl - is showing a bear flag on small time frames

Sprott Copper Arbitrage against LME copper futures, discount 20%Currently COP.UN (traded on TSX, Toronto Stock Exchange) is showing some substantial discount again against NAV. Discount is more than 20% which basically means that you can buy copper on the world markets (LME) with a 20% discount! I expect discount will narrow again in coming weeks and wil go back to minus 10 or even better.
A more detailed description can be find below of all facts and figures.
Current Situation:
Discount to NAV: COP.UN is trading at just over a 20% discount to its net asset value (NAV). Essentially, this means you can buy copper exposure at a significant discount to the current market price.
Copper Storage and Transfers: The trust’s copper is stored in LME-approved warehouses and is increasingly being shipped to COMEX warehouses in the U.S. The reason is straightforward: copper prices on COMEX are currently higher than on the LME. By moving copper to COMEX, Sprott can sell inventory at better prices.
Mechanism for Payouts: The proceeds from selling copper at a premium on COMEX versus the LME can be distributed to unitholders as a special cash distribution (dividend). This provides a direct way for investors to benefit from arbitrage between exchanges.
Redemption Option: Institutional investors can redeem trust units for physical copper, subject to minimum tonnages and fees. This helps keep the trust price connected to physical copper markets and offers an arbitrage route if the discount remains wide.
The Opportunity:
This setup offers trading houses huge opportunities:
Arbitrage Play: Buy COP.UN units at a >20% discount, redeem them for physical copper, and sell the metal at spot prices, pocketing the spread (net of costs).
Dividend Upside: Hold COP.UN units and potentially benefit from future special dividends if Sprott continues moving copper to COMEX and realizing higher sales prices.
Useful Resources:
COP.UN Prospectus (Sprott Physical Copper Trust) cop-prospectus-en.pdf

URA Long CallURA and CCJ are sitting at Volume Support and Darvas support levels.
Prices have also set up a minor low signal.
The trend has started to move to sideways, would would be confirmed today. Therefore, we need to be more aggressive in our stop loss and profit target. I like a move back up to the $38 level.
Entry $36.62
Stop Loss: 20% - Due to trend change.
Profit Target - $37.95

Nightly $SPY / $SPX Scenarios for July 9, 2025🔮 Nightly AMEX:SPY / SP:SPX Scenarios for July 9, 2025 🔮
🌍 Market-Moving News 🌍
📦 Tariff Pause Extended to August 1
President Trump delayed the July 9 tariff deadline, pushing negotiations into early August. Markets reacted with muted volatility, suggesting growing comfort that deals will be struck—yet widespread uncertainty remains
💵 Junk Bonds Rally Amid Tariff Tangling
Despite ongoing tariff risks, investors are doubling down on U.S. high-yield (junk) bonds. They anticipate the Fed may refrain from tightening further—favoring spread-tightening to around 7–8% yields—reflecting confidence in credit quality
🏦 Fed Faces Tough Call on Rate Path
New business surveys show conflicting signals: mixed revenue outlooks, cautious spending, and ongoing tariff pressures. The Fed must weigh slower growth against inflationary risks—keeping the door open to rate cuts in the autumn but unlikely before September
📊 Equities Firm Amid Tariff Uncertainty
Stocks showed resilience—S&P 500 and futures held position—after Monday’s tariff-triggered dip. Dip-buying and expectations of extended trade talks kept markets steady despite policy noise
📊 Key Data Releases & Events 📊
📅 Wednesday, July 9:
All Day – Ongoing U.S.–tariff negotiations; markets focused on any progress toward formal deal-making or extension terms.
Midday – Watch for headlines on tariff letters to 14 countries and any movement in trade discussions.
⚠️ Disclaimer:
This information is for educational and informational purposes only and should not be construed as financial advice. Always consult a licensed financial advisor before making investment decisions.
📌 #trading #stockmarket #economy #tariffs #Fed #fixedincome #credit #technicalanalysis

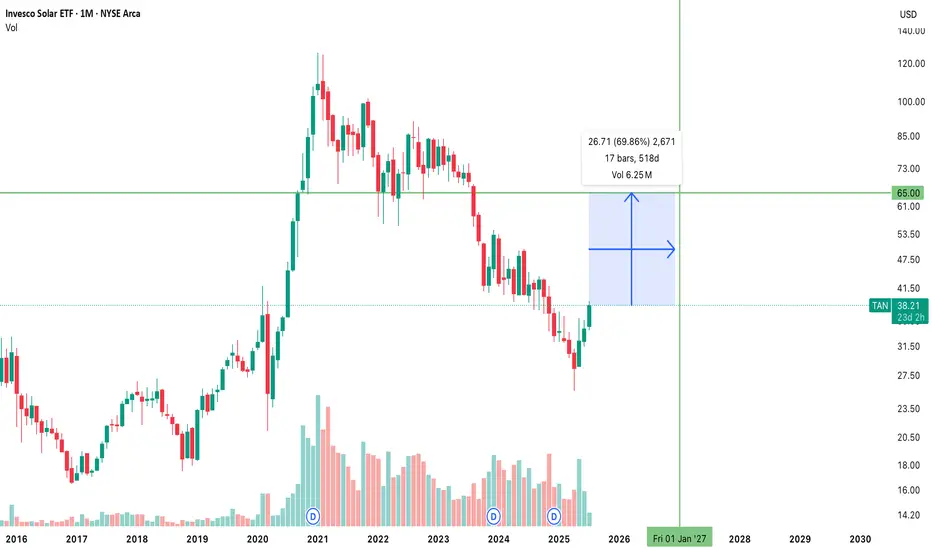
$TAN $65 STRIKE CALLS EXPIRING JAN 15, 2027 (17 MONTHS AWAY)WILL THIS PRINT???
AMERICA WILL RUN INTO A POWER CRISIS 2025-2035
The U.S. power grid is nearing a breaking point as AI, robotics, and data centers drive unprecedented electricity demand. By 2030, data centers could consume 9% of U.S. power, doubling from 2023, with AI queries alone using 10x the energy of a Google search. Robotics and manufacturing add further strain. The grid, however, is unprepared—aging infrastructure, permitting delays, and labor shortages hinder upgrades. Virginia and Texas already face shortages, with grid connection wait times up to 7 years. Renewables can’t scale fast enough without $720B in grid investments. Tech giants’ carbon-neutral goals may falter, relying on fossil fuels. Without urgent action—faster permitting, workforce growth, and innovations like microgrids—power shortages could cripple AI progress and the digital economy.
They can drill baby drill, but the private sector has solar. Tesla should be in this ETF. The US gov't may even print more billions and pump into this sector. ITS BLOODY OBVIOUS.
$SPY The BEAR flags are BACK!! AMEX:SPY Looking at bear flags on multiple time frames with an eye on a couple of potential support areas.

~ July 8th 2025 - New highs beget new highs on S&P 500 SPY ... All time highs beget new all time highs on Wed July 2nd ... S&P 500 SPY ETF hit all time high of 626.28 ... watching that level this week ... anticipating bounce as market tests support ....
Semis ready to rip to price discoveryAMEX:SOXL NASDAQ:SMH
Semiconductors just waiting for the tarrif announcements to pass to blast off to all time highs

IBIT - Trying to Confirm Upside BreakIf you are wanting BTC to breakout this is a very important chart. There is a chance IBIT is frontrunning the BTC breakout.
For the past 45 days IBIT has been forming some sort of parallel channel breakout with the top trendline being our orange trendline. We have had many touchpoints of resistance on this trendline (red arrows). Recently price broke out to the upside and re tested our orange trendline as new support (green arrow). This is a really good early signal of continuation to our 1.618 extension level. In addition to the trendline retest we have also seen the ltf 0.618 Fibonacci level holding as support.
However BTC is the main factor of if this will be a successful breakout or not. Right now BTC is still struggling with our red trendline of resistance. If BTC fails and starts to fade then IBIT will fall to and this will become a failed breakout. Will update this post when more confirmations develop.

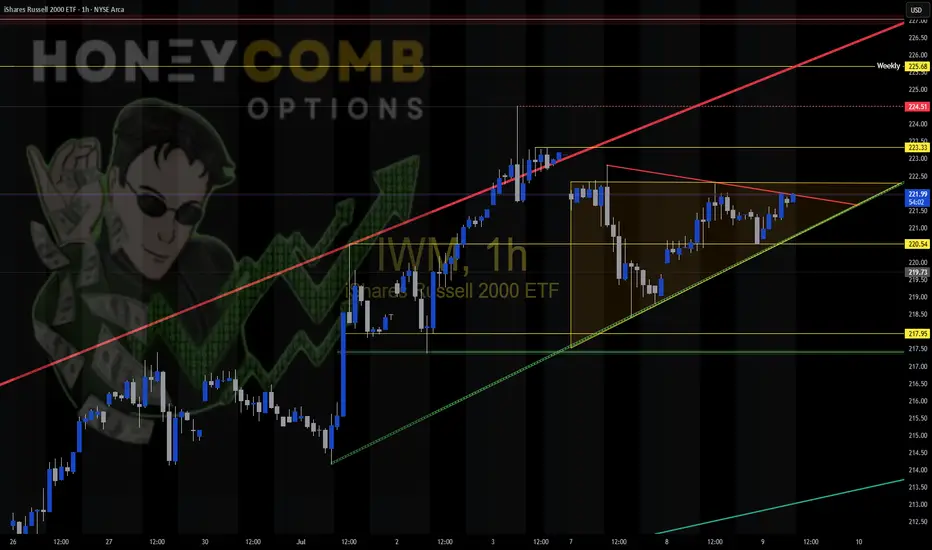
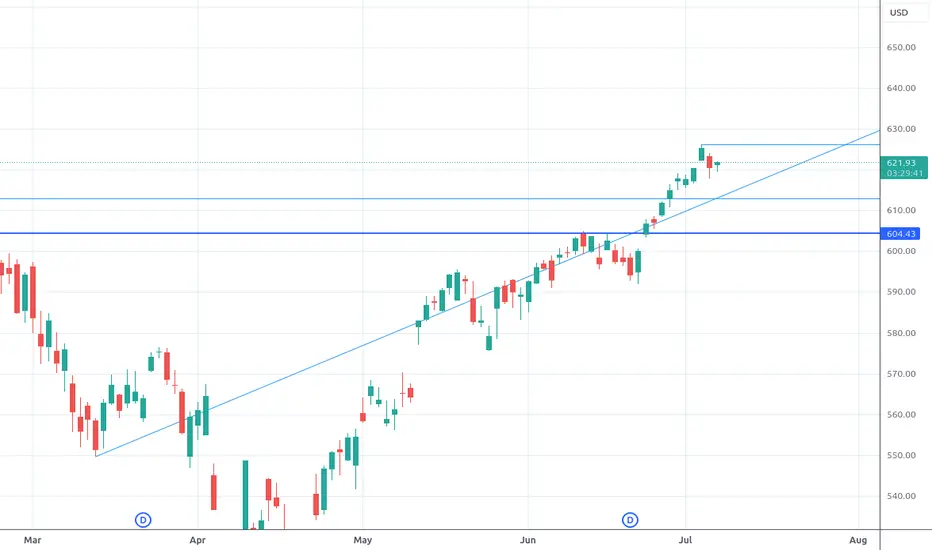
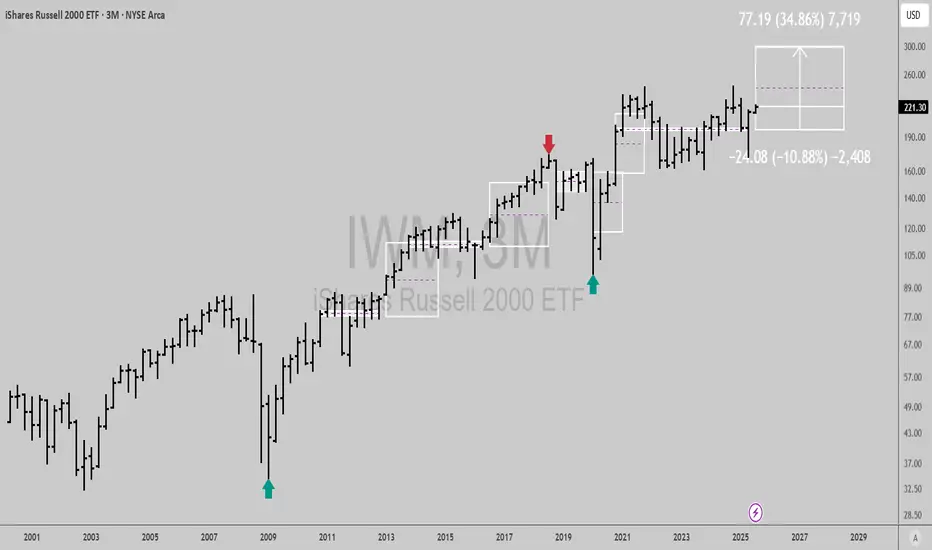
$IWM: Quarterly signal and Fundamental CatalystsQuarterly chart signals from time@mode show AMEX:IWM is bullish, with just 10% downside risk and over 34% upside potential into Q3 2028 or sooner.
Let's break down the key catalysts for the year ahead:
Fed rate cuts are expected to boost small cap stocks by lowering borrowing costs.
Small business sentiment is at multi year highs, supporting Russell 2000 earnings growth.
Valuations remain attractive: AMEX:IWM trades at a discount to large caps, with room for mean reversion.
Sector rotation: Money is flowing into industrials, financials, and cyclicals, core IWM sectors.
Risk reward is compelling: Upside vs risk and strong macro and earnings tailwinds make this a high conviction long idea for the next 12 months and beyond.
Best of luck!
Cheers,
Ivan Labrie.
How Will Uncle Sam Strike Back? – U.S. Treasuries on the Edge📉 How Will Uncle Sam Strike Back? – U.S. Treasuries on the Edge
After covering leveraged loans ( BKLN ), junk bonds ( HYG ), and investment-grade corporates ( LQD ), we now focus on the most important piece of the U.S. credit puzzle: Treasuries.
Specifically, the long end of the curve — tracked by TLT .
📊 What the Chart Shows
Left Panel (3D Chart)
• All-time highs in Feb 2020 at $179.80
• Long-term trendline going back to 2004
• Critical support was broken in 2022 — a structural breakdown
Right Panel (8H Chart)
• Clear descending channel since 2020
• Price has rejected from the channel top multiple times
• Recent bounces off the lower channel suggest a potential final flush
🧠 What Happened in 2022? (can't blame Trump for that...)
This wasn’t politics — it was policy.
• The Fed's fastest hiking cycle in decades
• Liquidity evaporated
• Long-duration bonds were abandoned
• The key trendline that had held for years was finally lost
That line — once support — is now resistance.
📐 My Technical Expectation
I expect one final slide before a reversal.
• Channel base sits at ~$76.32
• My projection targets $71.30 or even $68
• That would mark new all-time lows for TLT
🟡 After that? I expect a macro reversal , targeting:
• 🔼 $101 – mid-channel reversion
• 🔼 $112–115 – former support zone (2019–2022), now resistance
🔍 Macro Context
This chart isn’t just about price.
It reflects how markets are pricing confidence in U.S. debt .
And right now?
That confidence is shaky . With Trump turning 'orange' and taking it out against almost everyone else: China but also his allies(EU, Canada, Japan, etc )
🔄 Recap of the Series So Far:
• BKLN – record leveraged loan outflows
• HYG – junk bonds bounced at historical support
• LQD – investment grade bonds holding steady
• TLT – U.S. Treasuries under pressure, and possibly breaking down
📌 Next up?
🟧 CRYPTOCAP:BTC
Because when the world begins to question Treasuries , the search for alternative stores of value begins.
One Love,
The FXPROFESSOR 💙
ps. wait for the next posts...they might be epic!

[b]No Panic Here – Quality Credit Says Relax[/b]No Panic Here – Quality Credit Says Relax
After watching leveraged loans ( AMEX:BKLN ) and junk bonds ( AMEX:HYG ) take heavy hits, we shift to the quiet giant in the credit space: AMEX:LQD .
What is AMEX:LQD ?
It’s the ETF for investment-grade corporate bonds — meaning bonds issued by highly rated, stable companies.
We’re talking about names like Apple, Johnson & Johnson, Microsoft, JPMorgan, ExxonMobil — the blue-chip elite.
These aren’t the bonds you dump in a panic — they’re the ones you rotate into when credit stress builds.
What’s happening now?
📌 Price just bounced off 103.81 , a key support zone that also held:
• During the 2020 Covid crash
• In the 2022 banking mini-crisis
• Now in 2025 – mid macro uncertainty
From 2003 to 2021, this chart trended upward with pressure on resistance. Since 2022, the pressure flipped — testing support. But structure is still being respected perfectly .
🟢 The ascending channel remains intact
🧱 Support at 103.81 is holding
🔄 No breakdown, no fear — just rotation
Zoomed-in 30m chart shows a clean technical bounce .
If we revisit 100.33, that could be a final test of the base — but unless that breaks, this still looks bullish on a macro timeline.
What it means:
This is not a market panic .
It’s a rotation into quality.
• Junk bonds = sold but found support
• Leveraged loans = stress but not panic, on support
• Investment grade = stable
• ** CRYPTOCAP:BTC 🟧 = crypto wildcard in this macro unwind**
Bottom Line:
LQD is holding up, following the rules, and quietly saying:
"Relax, we've been here before."
One Love,
The FXPROFESSOR 💙

Junk Bonds: Risk Appetite Bounces on Support!Junk Bonds: Risk Appetite on Support!
Credit markets have been buzzing — headlines warn of record outflows and panic rotation. But AMEX:HYG , the high-yield bond ETF, just told a different story.
What is AMEX:HYG ?
It tracks “junk bonds” — loans to companies with weaker credit. They offer high yields, but carry high risk. When investors are confident, they chase these. When fear hits, they dump them — fast.
The Chart Setup:
We've just seen a clean rebound off 75.72 — a long-standing “fear line” going back to:
• 2008 GFC lows
• Covid crash in 2020
• And now, 2025 macro tension
Zooming into the 1H chart (see inset), the rebound off 75.72 was sharp and orderly — not panic-driven.
Why it matters:
📉 Last week: $9.6B exited junk bond funds (20-year record)
💣 AMEX:BKLN saw its biggest outflow ever
But technically? This support is still holding .
The message:
The market might be pricing fear — but not full-blown stress .
Break below 75.72? That changes everything.
Watchlist:
• AMEX:BKLN – leveraged loans
• AMEX:LQD – safer credit rotation?
• NASDAQ:TLT – treasury flow = fear gauge
• CRYPTOCAP:BTC 🟧 – Bitcoin as macro hedge again?
For now, risk appetite is hanging on by a technical thread. Let’s see if it holds.
One Love,
The FXPROFESSOR 💙
ps. things can change fast so we will monitor..alerts are ON

Credit Stress Panic? No, at least not yet!Credit Stress Panic? No, at least not yet!
A friend shared a viral X post claiming we just saw the biggest exodus in the leveraged loan space — and they’re right on the numbers:
• $6.5 billion pulled from US leveraged-loan funds in just a week
• $1.4 billion from AMEX:BKLN alone — the largest outflow in its 13-year history
• $9.6 billion also left high-yield bond funds — the most in nearly two decades
But here’s the thing... dollar flows can be misleading without context.
What is AMEX:BKLN ?
AMEX:BKLN is the Invesco Senior Loan ETF. It tracks floating-rate loans made to riskier corporations — offering higher yields tied to interest rates. These are popular in rising-rate environments… until credit stress kicks in.
So what’s the chart saying?
Despite the outflows, price just bounced off a key historical support level: $20.31 .
This zone has been tested before:
• 2018: Fed tightening – sharp but contained
• 2020: Covid crash – full panic
• 2022: Banking mini-crisis – 💥 and Bitcoin pumped from here 💰🟧…
Now in 2025, we’re seeing the biggest dollar outflow… but not the worst price action.
Perspective check:
The fund is much larger now. $1.4B today ≠ $1.4B in 2018. This move isn’t the apocalypse — not yet.
Final Takeaway:
If $20.31 holds, this may be just another macro shakeout.
Break that, and we enter “panic mode” — but we’re not there yet. (Thank God that Tradingview alerts exist. It's ON)
Watchlist:
• AMEX:BKLN – key support zone
• AMEX:HYG / AMEX:JNK – junk bonds under pressure
• NASDAQ:TLT – treasuries getting love
• CRYPTOCAP:BTC – does it act as safe haven again?
One Love,
The FXPROFESSOR 💙

SPY should continue downSPY bounces will likely be sold but it needs to break 618 for any real down move. Gold, stuck between support and resistance. USOIL at resistance. NG, difficult to say what is happening. BTC may pop the highs but it would likely be a false break.

IWM 4hr chart cannot tell a FIBIWM bouncing out of the FIB golden pocket.... With the daily and this I like the odds of upside continuation..
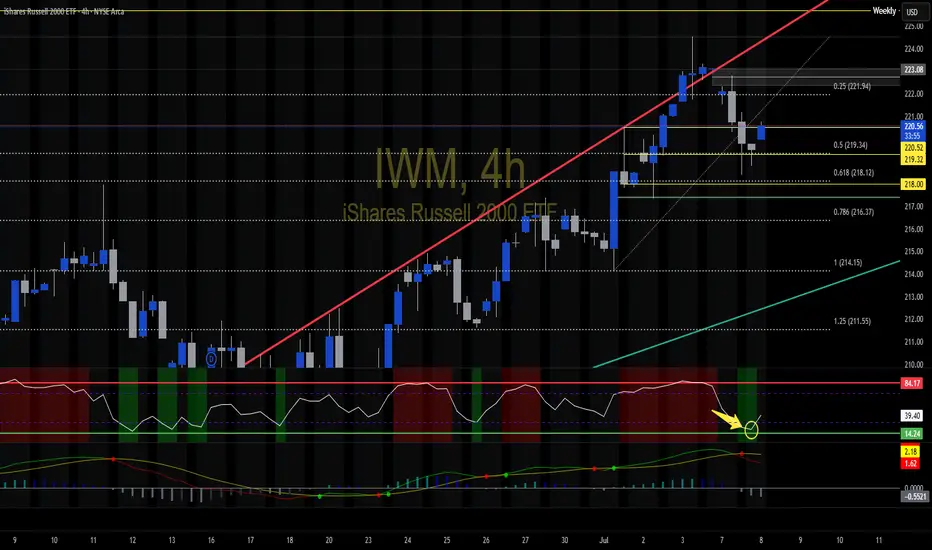
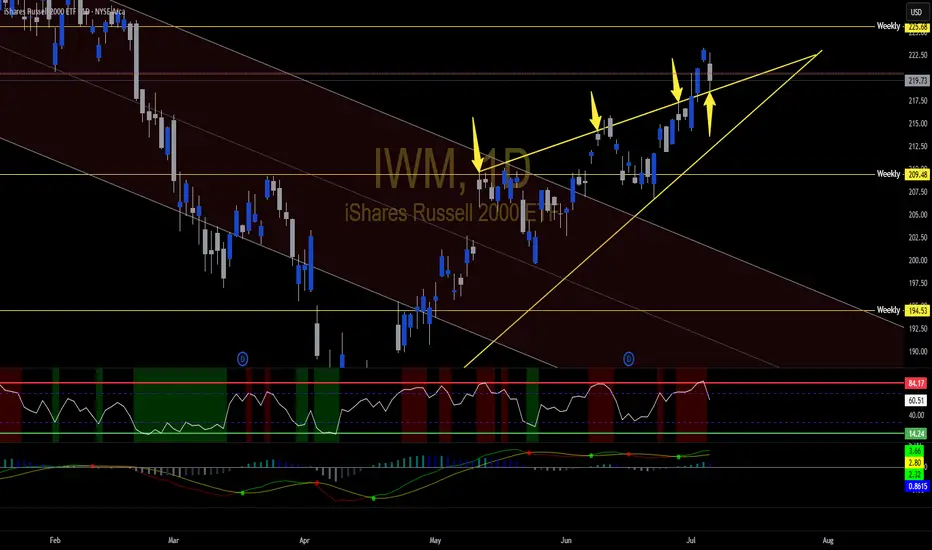
Chart Pattern Analysis Of MSTU.
From K1 to K6,
It is a small scale consolidation or a bullish triangle pattern.
The supply pressure is decreasing too.
It seems that K7 or K8 will break up or fall down.
If the following candles close upon the neckline,
It is likely that another bull run will start here to test 14USD area.
On the other hand,
If the following candles close below the uptrend line,
The risk will sharply increase.
Long-8.18/Stop-7.8/Target-14
Long-8.5/Stop-7.8/Target-14
