SPY July 7th 2025SPY July 7th 2025
Day 1 of journaling my day trades on SPY. I am going to start journaling my ideas every night if possible in order to fine tune my setup and to analyze my wins and losses. I will be using Renko (Traditional, 2 box size, 1m) as my main chart, Range Bars (50R, 100R, 200R, or 500R), and candle sticks (various timeframes) to identify supply/demand, price ranges, and trends - placing a high emphasis on volume as it applies to the Wyckoff Method. I will also occasionally refer to real time options charts and VIX, however I will primarily use those for my entries during the day.
Each day I will provide setups for a bullish and bearish bias, which should help minimize instances where the price moves against me - with slow reactions leading to holding losing trades and hesitating to enter a trade on the side of the new trend. I’ll try to come up with a consistent format as time goes on. For today, I will go down the list of my indicators and provide notes that fit the bias of each trading strategy.
+++++++++++++++++++++++++++
Bullish Analysis
Renko: Strong breakout from ascending channel on June 30. Fisher Transform is signaling continuation. A retest of the top of the channel would take the price back to ~$618.
100R ($1) Chart: Price is in an uptrend being supported by high volume. 34VWMA (purple) is above 200MA (green). The bounce on July 2nd (around $616) was supported by a high volume node, indicating genuine interest pushing the price higher.
30m Chart: Price closed on July 3rd at the top of an ascending channel inside of a larger ascending channel. Since the larger ascending channel is one of strength, it can be assumed that the smaller one is a sign of strength as well. A break too far below the lower end of this smaller channel would be a sign of weakness, which does not seem to fit the current market structure after last week’s breakouts, but it is still possible that the trend fails. Fisher transform is forming a “hook” pattern that can signal continuation.
+++++++++++++++++++++++++++
Bearish Analysis
On a smaller scale, the price appears due for a pullback, which can fit both the bullish and bearish trading ideas depending on where the market opens.
Renko: The price closed at the top of an ascending channel on July 2nd and will find more buyers upon a test of the lower band and the anchored VWAP.
50R (50¢) Chart: If the price pulls back to the bottom of the channel (around $620) this would coincide with a retracement of 0.618 - which is a key fib level. A break below the 1.00 extension ($616) could signal a break of the uptrend - a $9+ drop if an entry can be found near the top of the channel, not too bad.
5m Chart: The price left a gap down to $620 on July 3rd. Filling this gap could provide important liquidity to propel the price higher. Additionally, The high volume at the start and end of Thursday’s flat trading day (with low volume in between) could be a sign of accumulation or lack of sellers.
1DTE ATM Put, 2m: If a more prolonged (and profitable) downward move is expected from smart money, we should see volume increase for ATM puts during the session. Depending on where things open, we could see a potential spring/false bearish breakout (below $2.20), or a true bullish breakout (above $2.80). Using an options calculator, $623.75 on AMEX:SPY would set up the Spring and a drop below $622.50 could confirm the put breakout.
+++++++++++++++++++++++++++
Targets
Calls: Enter $618-$620, Target $625-$628, Stop Loss $617.75
Puts: Enter $623-$625, Target $620, Stop Loss $626.25
To conclude, overnight action on CME_MINI:ES1! and the gap up on TVC:VIX shows that the price is already retracing. The top of the wedge for VIX would be just above $20 - a key level to watch for a reversal. Unless the upper part of the channel on SPY is tested and rejected again after the open, I will sit out and wait to hit the bullish targets. We are still in a strong uptrend after last week’s breakouts, so going short is the riskier bet anyway, as buyers could step in at any time.
Looking at ATM calls and puts side by side (bottom two charts), it is clear that calls were not heading into today with a good setup. It would be worth taking a chance on puts if a Spring forms (below $2.20), which, again, would correlate with AMEX:SPY hitting $623.75 during the session - and not much higher.
My main idea for the start of this week is to look for a good pullback for calls, so I will be patient and will try not to force anything. If smart money has a bullish sentiment, there will still need to be a short accumulation phase for calls so I will watch to see what the chart is doing for ATM calls around $620.
ETF market

$SPY $SPX to 5650 Realistic pull back target AMEX:SPY SP:SPX Realistic pull back target. It’s been a while since I gave a good 5 year volatility based pullback target. 😏
Let’s take a look back in August. 5655 for SPX, 563 SPY

$QQQ – Fibonacci Roadmap to 700+ | VolanX Macro ProjectionPosted by WaverVanir International LLC | July 7, 2025
We're now entering a potentially historic expansion phase in the $QQQ. Our macro model, embedded in the VolanX DSS framework, projects a highly probable move toward the 1.786–2.0 Fibonacci extension zone, targeting $696.80 to $739.27, with 711.45 as a primary convergence level.
🔍 Key Technical Breakdown:
📐 Measured Move Base: November 2023 to March 2025 low
🟡 Fib Anchors: 404.65 low ➜ 540.81 high
🧬 Primary Support Zone: 0.5–0.618 retracement (449–465) held structurally during Q1 volatility
🚀 Resistance Breakout: Sustained break above 540.81 initiated the next Fibonacci leg
📈 Next Major Extension Target:
1.618: 663.46
1.786: 696.80
2.0: 739.27
🎯 Projected Path: Consolidation near current highs, followed by a liquidity-driven breakout into 700+ by mid-2026
🧠 Macro Context via VolanX Alpha Layer:
Liquidity Regimes: Improving risk-on flows with tech sector leadership resurging
AI & Infrastructure Megatrend: QQQ components benefit directly from AI adoption, infrastructure stimulus, and cloud capex
Volatility Compression: VIX continues to trend lower, fueling breakout setups on high beta indices
📊 Strategy Insight – VolanX DSS Signal:
✅ Long bias remains intact while price holds above 528 (last microstructure support)
🔄 Optimal entry zones: Dips toward 540–545 = reload opportunities
⏱️ Swing horizon: 4–6 months
🛡️ Risk Management: Invalidate long thesis on weekly close < 504
📌 Note: This projection is derived from our institutional Decision Support System (DSS), blending Fibonacci confluence, macro catalysts, and structural flows.
🔔 Follow @WaverVanir for more high-conviction macro setups powered by VolanX Protocol.

SPY: How are ya?Long time no talk.
Just an update to appease some people requesting updates haha.
Mostly going over the larger term outlook for SPY, the quarterly and some discussions on the weekly.
As always, not advice and remember to follow your strategies and risk management approaches!
Safe trades everyone!

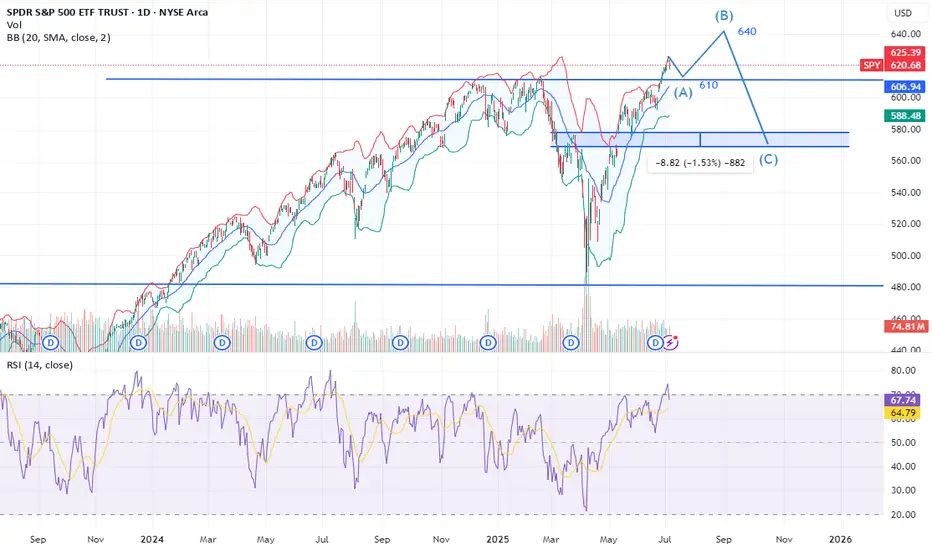
clear path to 640 then 570 spyTariffs news are temporary but pump of any good news can lead us to 640 but remember we have to fill the gap 570.
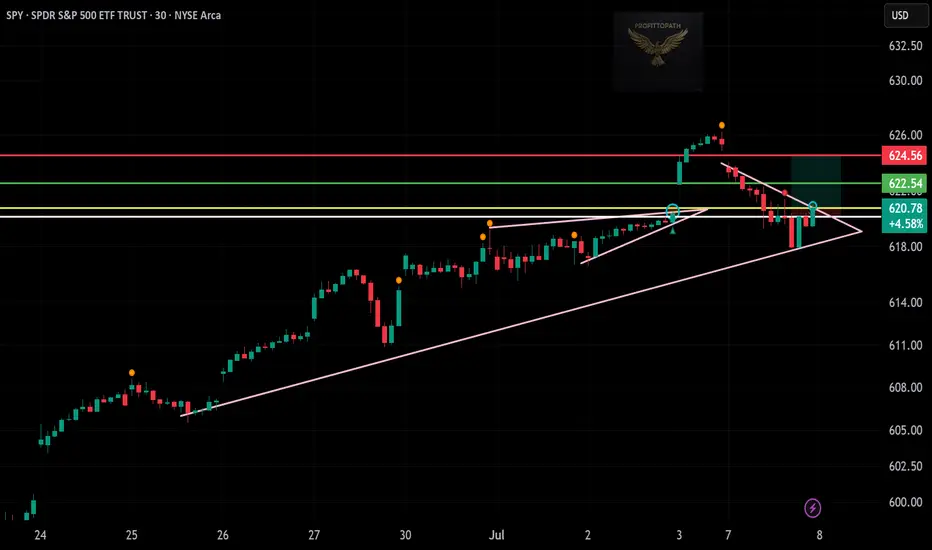
SPY Breakout Setup – Bullish Pattern Watch! 📈 🟢
SPY has formed a clear ascending triangle with strong support at $616. After a pullback, it’s now breaking out above $620.78 with a bounce from trendline support and rejection of lower prices.
📌 Trade Details:
🔹 Entry: $620.78
🔹 Stop Loss: $616.00
🔹 Target: $624.56
🔹 Pattern: Ascending Triangle Breakout
This setup aligns with market momentum and breakout structure. Great risk-reward for bulls watching major index movement.
—
📊 Posted by: ProfittoPath
#SPY #SP500 #ETFTrading #BreakoutSetup #MarketUpdate #ProfittoPath #TechnicalAnalysis #StockTrader #ChartAnalysis
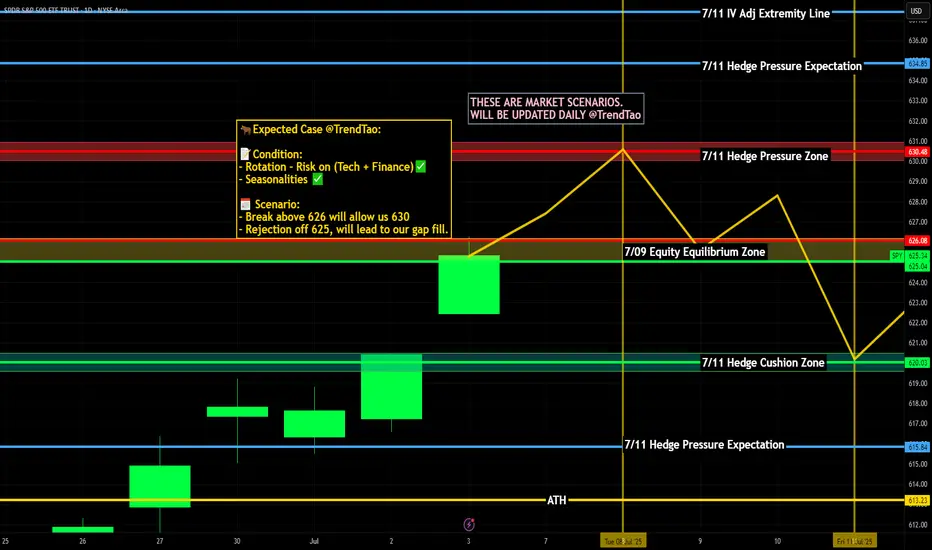
Nightly $SPY / $SPX Scenarios for July 8, 2025🔮 Nightly AMEX:SPY / SP:SPX Scenarios for July 8, 2025 🔮
🌍 Market-Moving News 🌍
📉 U.S. Stocks Slip on New Tariff Threats
President Trump announced plans to impose 25% tariffs on imports from Japan, South Korea, Malaysia, Kazakhstan, South Africa, Laos, and Myanmar starting August 1, reigniting trade jitters. The Dow fell ~0.9%, the S&P 500 dropped ~0.8%, and the Nasdaq slid ~0.9% on the news, while bond futures rallied and the dollar strengthened
⚖️ Tariff Pause Deadline Looms
Markets are focused on the July 9 deadline for the current tariff pause, which now hinges on imminent trade negotiations. Investors are balancing the risk of reimposition against progress with agreements involving the U.K., Vietnam, and Canada
💵 Consumer Credit Moderates
June’s consumer credit increase slowed to $10.60 billion vs. April’s $17.87 billion—still strong, but a cooling sign in household borrowing patterns. This tempered the dollar’s rise amid mixed signals on consumer resilience.
🛢️ Oil Drops on Rising OPEC+ Supply
Oil prices fell, with Brent dipping to ~$68.00/barrel and WTI to ~$65.30, after confirmation of OPEC+’s August supply hike—adding to bearish cues for energy stocks .
📊 Key Data Releases & Events 📊
📅 Tuesday, July 8:
3:00 PM ET – Consumer Credit (June)
Moderation in borrowing signals possible easing in consumer-driven growth.
4:30 PM ET – API Weekly Crude Inventories
A key indicator for energy markets; lower inventories lift oil prices, while builds push them down.
Throughout the Day – Tariff Pause Deadline
Market stability hinges on whether trade agreements materialize before the break expires.
⚠️ Disclaimer:
This information is for educational and informational purposes only and should not be construed as financial advice. Always consult a licensed financial advisor before making investment decisions.
📌 #trading #stockmarket #economy #tariffs #consumercredit #oil #technicalanalysis

spy puts on level 610 and 614There some level i would like to meet 610 and 614
Disclaimer- it a opinion

Monday Markets Update SP500 may start pulling back, we'll have to see if they can get any downward pressure hapening. USOIL still looks bearish. Gold and Nat Gas both looks like they are going sideways right now. BTC still hasn't broken out above 110k.

QQQ Massive Short! SELL!
My dear subscribers,
QQQ looks like it will make a good move, and here are the details:
The market is trading on 556.22 pivot level.
Bias - Bearish
My Stop Loss - 564.94
Technical Indicators: Both Super Trend & Pivot HL indicate a highly probable Bearish continuation.
Target - 542.15
About Used Indicators:
The average true range (ATR) plays an important role in 'Supertrend' as the indicator uses ATR to calculate its value. The ATR indicator signals the degree of price volatility.
Disclosure: I am part of Trade Nation's Influencer program and receive a monthly fee for using their TradingView charts in my analysis.
———————————
WISH YOU ALL LUCK

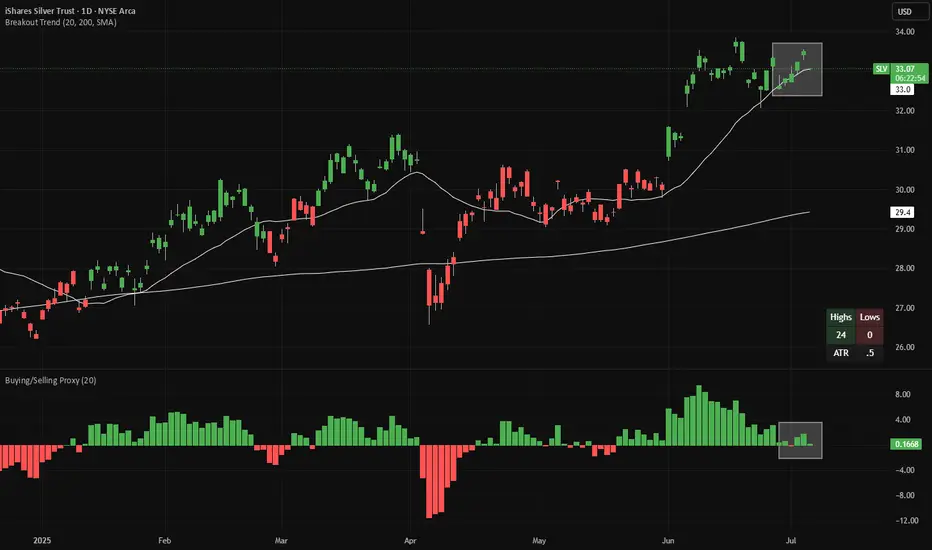
Long Silver - Buy the DipSilver is making 20-day highs (green candles in the main chart), while pulling back towards the 20D EMA line. Meanwhile, looking at a proxy of net buying/selling (bottom panel), we are almost at net selling levels.
There is good risk/reward to buy silver here, with a stop-loss if the price closes at a 20-day low. If a 20-day low is made, the candles will change color from green to red.
Both indicators (Breakout Trend and Buying/Selling Proxy) are available for free on TradingView.
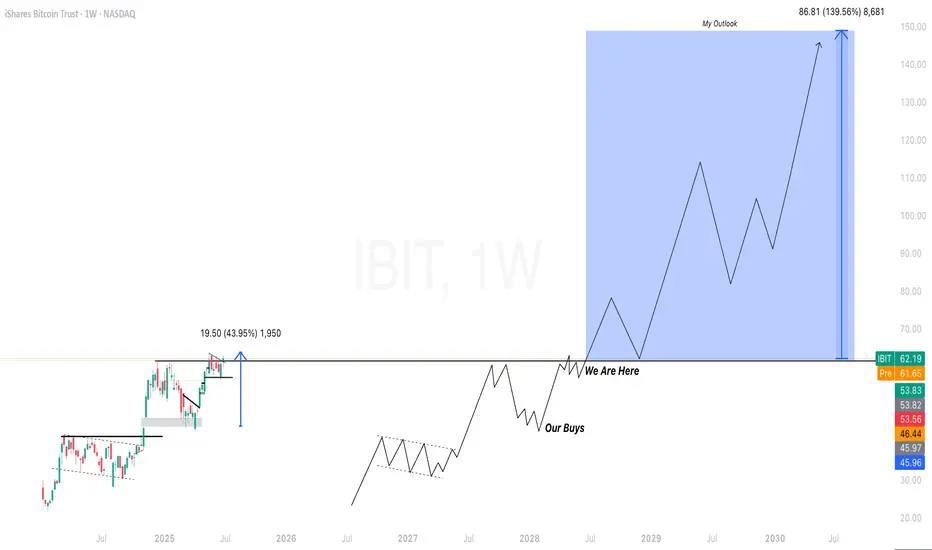
$IBIT Long Term Outlook BTC has tons of room for upside and I see the same for IBIT in the next 5 years 📈. Incredibly high conviction!
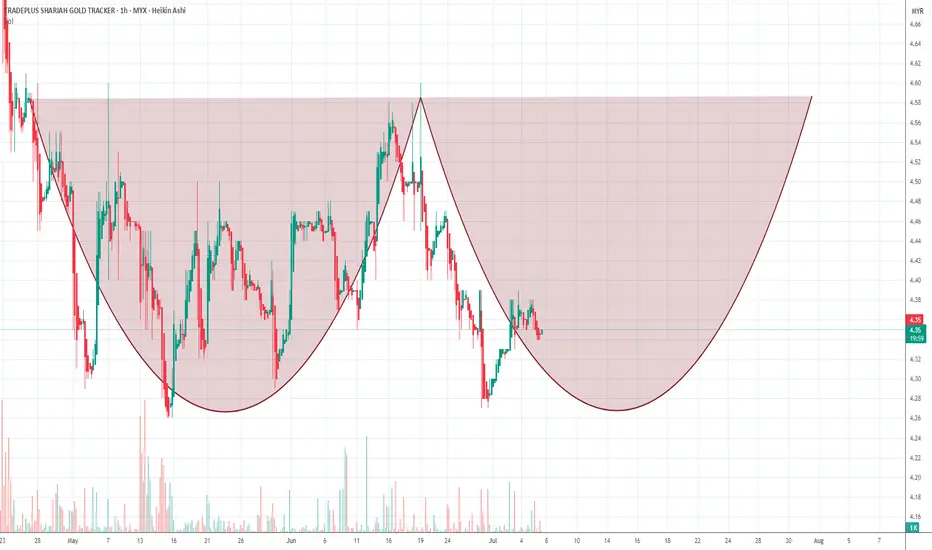
It's possible?Using this method, is it possible to go up again? I think it made sand because if you follow the trends, the chart will be like a parabola, and it always repeats the process.
The Mag 7 over a yearThis chart tracks the Mag 7 over 1 year:
Amazon
Apple
Microsoft
Google
Tesla
NASDAQ
In general, the SPY has gone up to all time highs, so has the NASDAQ but some individual players in Mag7 haven't.

Weekly $SPY / $SPX Scenarios for July 7–11, 2025🔮 Weekly AMEX:SPY / SP:SPX Scenarios for July 7–11, 2025 🔮
🌍 Market‑Moving News 🌍
📈 From Panic to "Goldilocks" Rally
The S&P 500 and Nasdaq hit fresh record highs, surging ~20% from April lows. Markets rallied on a combination of easing Middle East tensions, the 90‑day tariff pause, a new fiscal bill in Washington, and strong June jobs data. Still, strategists caution that optimism may be ahead of fundamentals, especially if trade volatility returns
💱 Dollar Weakness & Bond Market Watch
The U.S. dollar remains near 3.5‑year lows amid rate‑cut speculation and trade progress. Treasury yields are volatile this week, impacted by concerns over escalating debt issuance, upcoming tariff deadlines (July 9), and the Federal Reserve’s stance .
🏢 Tech Leadership Shifts
With the “Magnificent Seven” tech stocks near heights, growth is spreading: cyclical sectors, small‑caps, and industrials are gaining momentum. AI remains the primary engine, but resilience across a broader stock base is signaling a potentially sustainable rally
⚠️ Tariff Truce Deadline Looms (July 9)
The April tariff pause expires mid‑week. U.S. plans to extend exemptions via trade talks with partners like UK, Vietnam, and Canada—yet any delay or failure may shock markets. Watch for headlines that may trigger spillover effects .
📊 Key Data Releases & Events 📊
📅 Monday, July 7:
Independence Day markets resume. Light trading expected ahead of data and tariff deadline.
📅 Tuesday, July 8:
10:00 AM ET – Consumer Credit (June)
Gauges borrowing trends—an indicator of household health in a low‑rate environment.
📅 Wednesday, July 9:
EIA Crude Oil Inventories & MBA Mortgage Apps & Wholesale Inventories
Key mid‑week data points; oil builds may pressure energy stocks.
Tariff Pause Deadline – Expect market volatility on news of extension or reimposition.
📅 Thursday, July 10:
8:30 AM ET – Initial & Continuing Jobless Claims
10:00 AM ET – Natural Gas Inventories
Markets focus on labor health and energy trends.
📅 Friday, July 11:
10:00 AM ET – Treasury Budget Statement
Details on government borrowing and fiscal outlook—markets sensitive to deficit risks.
⚠️ Disclaimer:
These insights are for educational purposes only—not financial advice. Consult a licensed advisor before making investing decisions.
📌 #trading #stockmarket #economy #news #tariffs #Fed #AI #technicalanalysis
SPY (S&P500 ETF) - Daily Golden Cross and All-Time-High PriceSPY (S&P500 ETF) price has reached all-time-highs in July 2025, after a SMA Golden Cross printed on the daily chart.
SPY is still in a price uptrend since May 2025, however a higher-low pullback has not occurred for the past two weeks.
Resistance levels: $625, $630, $635, $640.
Support levels: $622, $617, $614, $611.
A significant reversal or bearish candle pattern has not occurred yet on either the daily or weekly charts.
The Stochastic RSI indicator has reached overbought levels, both on the Daily chart and Weekly chart.
Stock market earnings season begins in July 2025, trade deal negotiations and new tariffs are in progress this week. Volatility could increase this month due to these news catalysts.

Opportunity Beneath the Fear: SPY's Reversal SetupIn the Shadow of Headlines: SPY’s Drop Could Be 2025’s Big Opportunity
As markets react sharply to renewed tariff fears and Trump-related headlines, SPY continues its descent. Panic is setting in—but behind the noise, a strategic opportunity may be quietly forming.
While many rush to exit, others are beginning to position for the bounce. A well-structured entry strategy could be key to turning uncertainty into gains.
Entry Zone (Staggered):
🔹 543: First watch level—look for signs of slowing momentum.
🔹 515: Deeper entry point as the selloff extends.
🔹 <500 (TBD): Stay flexible—if panic accelerates, this could mark a generational setup.
Profit Targets:
✅ 570: Initial rebound target.
✅ 590: Mid-range level if recovery builds.
✅ 610+: Full recovery potential—rewarding those with patience and vision.
Remember: Headlines fade, but price action and preparation stay. This selloff may continue—but it might also be laying the foundation for 2025’s most powerful move. The key? Enter with discipline, protect your capital, and let the market come to you.
⚠️ Disclaimer: This content is for educational purposes only and does not constitute financial advice. Trading carries significant risk. Always conduct your own research and use proper risk management.

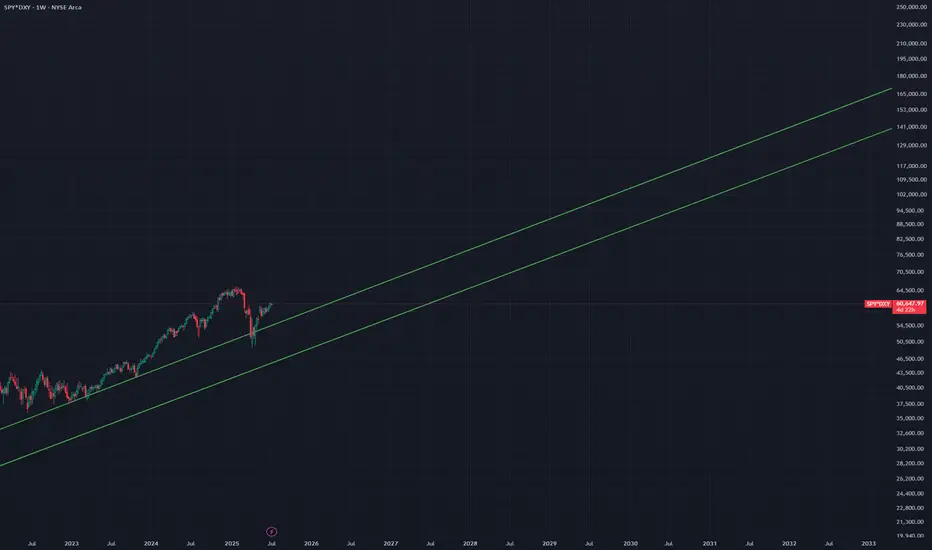
Real SPY vs DevaluationMacro traders and swing traders often employ this type of analysis to comprehend broader economic trends.
Particularly, the inverse correlation between a strong USD and equity markets.
Longterm S&P 500 Equal weight.The long-term Elliott Wave pattern appears to be approaching completion, and primary Wave 5 could be an ending diagonal.
This formation suggests a significant reversal down to the start of the E.D, which would be around the COVID low. This would be only be Wave A in a larger bearish pattern.

Weekly review of SPY, QQQ, GC, CL, ETH, BTC, UBER, TOAST, TKOWeekly review of SPY, QQQ, GC, CL, ETH, BTC, UBER, TOAST, TKO

SpySooooo.. the technicals are flashing red.
No earnings
No fed Speak
No economic data
We'll need a catalyst to get the reset going.
There are 2 catalyst
1. Tariffs
2. 30yr bond auction Thursday
I actually think between July 7th- 17th
We will retest the previous high between 610-611. Depending on how long this takes the 20sma should gravitate toward 610 by the End of this week.
The last two major Pullbacks actually took 2weeks and the price action was terrible. I circled it to illustrate
And this is why I said this pullback could take up to July 17th to complete.
July 18th is the kick off of big bank earnings and let me tell you from experience, you don't want to be going into earning season short especially if seasonality is against you.
Banking sector
AMEX:XLF
I think price pulls back with the rest of the marker but pushes back up to 54-55.00
With bank earnings
From there I expect a bigger correction
Weekly chart says banks won't make it out of July alive . Most likely a sell back to 49-50 or 10% drop
I would say this market would on be bearish with a close back beneath 600.00 on spy.
The problem with that is, not every big tech stock is overbought and some actually look like they are about to rally higher.
Here's an example of what I mean
So here's NASDAQ:SMH or chip sector which is a reflection of Nvda and TSM
Weekly technicals are saying a pullback is coming for this sector!
RSI, Moneyflow are too overbought on both weekly and daily time frames so I'm expecting weakness here over the next few weeks.
On the other hand you have
AMEX:XLY
This is the sector that reflects
Amzn and Tsla
The white line represents the resistance price was consolidating behind for 2months.
The purple circle represents a major bullflag
The green line is the V shape recovery that I think is about to happen with this sector this quarter.
Price may retest 217-218 but if that holds this sector and the stocks in it will outperform.
So what happens with the Spy if let's say you have
Msft
Nvda
Avgo
Tsm
All red
And then
Amzn
Tsla
Googl
Aapl
Mostly green?
Fawkery lol.
And this is why I say a pullback to 610 and then we'll see..
AMEX:IWM and TVC:DJI still have a little room left to move higher but both are supper extended on the daily time frame and I expect a pullback from them this week
There is 2 red flags I see on a bigger time frame and that is TVC:NYA and TVC:VIX
NYA weekly chart
Near the top of rising wedge here which means for the broader marker you will start seeing weakness in a few weeks
Price could grind up here for a few weeks but I doubt we break above 21,000
Vix
Daily chart and RSI
Is screaming that a move to 23 is imminent
If the vix pops back above 20 I can't see the Spy holding above 620
Trade ideas
NASDAQ:TSLA
I like calls above 322.00
Target 332.
Have patience for the move above 322, tsla is beneath all its moving averages right now!.
332 will be tough, if price can break above that then 347 is next up
NASDAQ:QQQ
557 is resistance .
I like the short to 552 gap support. At 552 I'd cover and wait for a break below 548.00 to short to 544..
Below 543.00 and we close gap at 539. I don't think price will drop back below 539 before tech earnings
Be careful about swinging short, it will only work if there is a vicious sell off. Otherwise you will find yourself with annoying small gap ups that will drag this out like I highlighted above on the Spy chart with the last to previous Pullbacks.
So what I'm looking for over the next 2 weeks is a retest for Spy 610 and qqq 540. Then we go into earning season
BTC - Channel is Broken, Now What?
The most bullish scenario right now is that the price stays in the upper part of the channel, tests the top of the channel and continues to rise.
If this breakout in BTC remains a manipulation, the price may also make the same manipulation downwards. When the price breaks through, my first thought is that it may find support at the midpoint of the channel, but this is a low probability. The higher probability is that it will make the same manipulation downwards and then re-enter the channel.

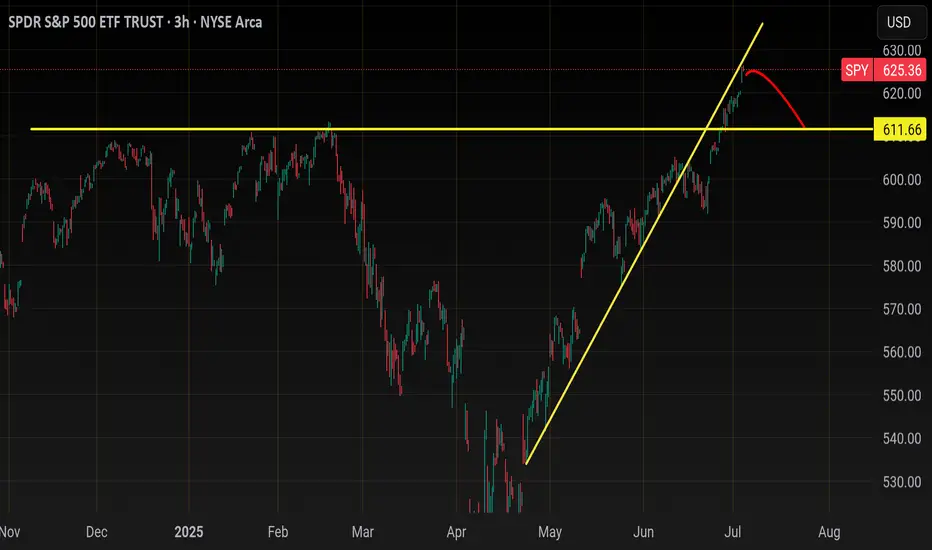
SPY: Bearish Continuation & Short Trade
SPY
- Classic bearish pattern
- Our team expects retracement
SUGGESTED TRADE:
Swing Trade
Sell SPY
Entry - 625.36
Stop - 633.00
Take - 611.27
Our Risk - 1%
Start protection of your profits from lower levels
Disclosure: I am part of Trade Nation's Influencer program and receive a monthly fee for using their TradingView charts in my analysis.
❤️ Please, support our work with like & comment! ❤️
